

- The National Bridge Inspection Program and the Highway Bridge Replacement and Rehabilitation Program
- Overview and Evolution of the Bridge Programs
- Information Collected Through the Bridge Inspection Program
- Composition of the Bridge Network
- Bridges by ADT
- Bridges by Functional Classification
- Bridges by Age of Construction
- Bridges by Type of Superstructure Material
- Conditions of Bridges
- Actions Taken to Remove Deficiencies
- Conclusions
Composition of the Bridge Network
An overview of the composition and conditions of the bridge system was presented in Chapter 2. This chapter presents additional detail for the system of bridges as a whole and according to traffic volumes, functional classifications, age, and superstructure materials and designs.
The NBI contains nearly 700,000 records, which describe either the features carried by a bridge, termed as "on" records, or the features crossed by the structure, termed as "under" records. Separating the on records from the under records reveals that there are 591,707 bridges over 6.1 meters (20 feet) in total length located on public roads in the United States. These bridges, on average, carry nearly 4 billion vehicles per day and comprise a total deck area in excess of 300 million square meters.
| Q. | How do the bridge ownership percentages compare with road ownership percentages? |
| A. | The majority of bridges (98 percent) and roadways (97 percent) are owned by State and local agencies. The vast majority of roadways, however, are owned by local agencies (77 percent). Bridge ownership is nearly equally divided between State (47 percent) and local agencies (51 percent). |
The discussion of bridges in Chapters 2 and 3 primarily considered the number of bridges in different classifications. Using this approach, every bridge in the inventory is counted equally. Thus, large suspension bridges, such as the Golden Gate or the George Washington Bridges, are considered equivalent to small, two-lane bridges carrying low volumes of traffic. In some cases, better insights into the condition or the composition of bridges can be obtained by considering the size of the structure and/or the traffic carried. Considerations of size of the structure can be incorporated through presentation of information using the deck area of the bridge. Considerations of the volume of traffic served by the structure can be incorporated through presentation of information using average daily traffic (ADT).
Bridges by ADT
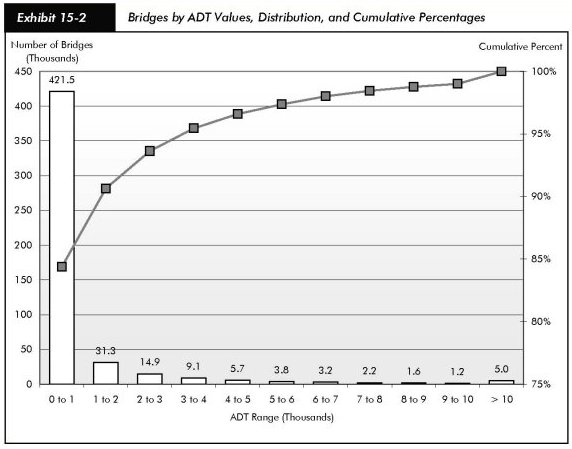
Approximately 27 percent of structures in terms of numbers have an ADT of 100 or less. In excess of 50 percent of these structures have an ADT lower than 700. 96.5 percent of structures have an ADT of 40,000 or below and 97.5 percent have an ADT of 50,000 or below.
In terms of numbers of bridges, low-volume roadways are predominant. However, the high-volume structures have a significant impact on the user population. There are approximately 21,000 structures with ADT values in excess of 40,000 vehicle crossings daily. These structures are predominantly in urban environments (approximately 90 percent in terms of numbers, nearly 95 percent in terms of deck area). Over 95 percent of such bridges are located on Interstates or other principal arterials.
Weighting the number of bridges by ADT values provides a mechanism for evaluating the impacts of the composition and conditions of bridges in terms of their impact on the highway user. Exhibit 15-2 shows that the distribution is significantly skewed to lower values of ADT.
Bridges by Functional Classification
Exhibit 15-3 shows the percentage of bridges by functional classification with bridges equally weighted by numbers, weighted by ADT, and weighted by deck area. Rural bridges are predominant when the percentages are determined by numbers, as 77.1 percent of all structures are located in a rural environment. Urban bridges, which comprise 22.9 percent of the inventory, carry over 73 percent of all daily traffic. Not surprisingly, urban structures are generally larger in terms of deck area as additional lanes are required to carry larger volumes of traffic. Urban structures constitute 52.6 percent of all total deck area on bridges in the inventory.
The disparity between urban and rural structures in terms of traffic carried and size is readily evident on the national level by comparing the percentages. Further examination of Exhibit 15-3 reveals similar trends across functional classification. Whereas bridges on Interstate and other arterial routes comprise approximately one-third of the inventory by numbers, they carry close to 90 percent of all daily traffic and approximately 70 percent of the deck area. Likewise, the local and collector roads constitute two-thirds of the inventory by numbers, but carry only 10 percent of total daily traffic volume.
| Functional Class | Total | % by Nos. (% of All) |
% of ADT | % of Deck Area |
|
|---|---|---|---|---|---|
| Rural | |||||
| Interstate | 27,316 | 4.6% | 10.2% | 8.0% | |
| Other Principal Arterials | 35,227 | 6.0% | 6.5% | 9.0% | |
| Minor Arterial | 39,587 | 6.7% | 3.7% | 6.6% | |
| Major Collector | 94,781 | 16.0% | 3.8% | 10.0% | |
| Minor Collector | 49,320 | 8.3% | 0.9% | 3.6% | |
| Local | 209,722 | 35.4% | 1.6% | 10.2% | |
| Rural Total | 455,953 | 77.1% | 26.6% | 47.3% | |
| Urban | |||||
| Interstate | 27,929 | 4.7% | 35.2% | 19.2% | |
| Other Expressways | 16,844 | 2.8% | 14.3% | 9.2% | |
| Other Principal Arterials | 24,307 | 4.1% | 12.1% | 10.7% | |
| Minor Arterial | 24,516 | 4.1% | 7.1% | 7.0% | |
| Collectors | 15,171 | 2.6% | 2.3% | 2.8% | |
| Local | 26,609 | 4.5% | 2.3% | 3.5% | |
| Urban Total | 135,376 | 22.9% | 73.3% | 52.6% | |
| Unclassified | 378 | 0.1% | 0.0% | 0.1% | |
| Total | 591,707 | ||||
Bridges by Age of Construction
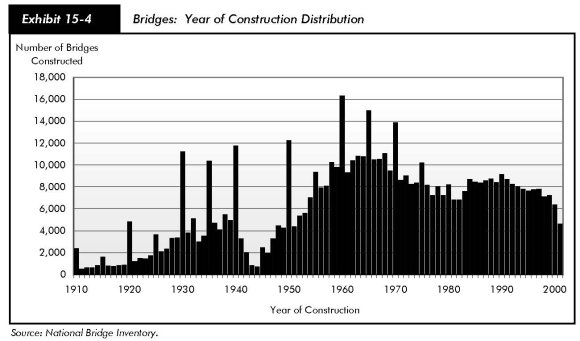
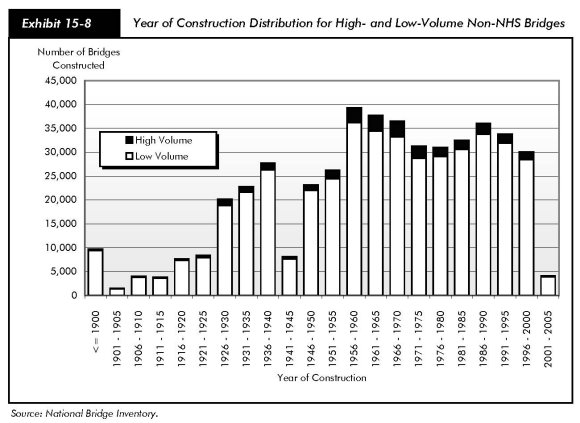
For each bridge in the NBI, the year of construction is recorded and a year of construction distribution may be generated. This is shown in Exhibit 15-4 where the number of bridges constructed by year is presented for all owners and for all functional classifications. Note that some of the annual "spikes" seen in the number of bridges constructed before 1970 are artificial, as some localities have recorded year of construction information using 5-year increments for older bridges. Peak periods of construction are seen mainly before World War II and during the Interstate construction era.
Exhibit 15-5 shows the average year of bridge construction by functional classification and owner. Standard deviations are provided with the mean values in order to give additional information on the distributions. Bridges in the inventory are, on average, 40 years old with an average year of construction of 1964. Urban structures are slightly younger than rural structures, with an average year of construction of 1968. Comparing rural bridges across ownership classifications shows that State, local, and Federal owners have values within a few years of the mean for all rural bridges. Rural bridges owned by other owners, which are primarily private owners and railroads, are on average 10 years older than the general population. With urban bridges, State and locally owned bridges are slightly younger or slightly older than average, respectively. Federally owned urban bridges and urban structures owned by others are 5 to 10 years older than State and local counterparts on average. It is important to note, however, that the number of bridges owned by Federal and other agencies is much smaller.
| Functional Class | Average Year of Construction and Standard Deviation | ||||
|---|---|---|---|---|---|
| State | Local | Federal | Other | All Owners | |
| Rural | |||||
| Interstate | 1968 (11) | 1959 (28) | 1963 (6) | 1965 (11) | 1968 (11) |
| Other Principal Arterial | 1965 (22) | 1968 (24) | 1967 (18) | 1973 (19) | 1966 (22) |
| Minor Arterial | 1958 (23) | 1972 (28) | 1968 (21) | 1966 (27) | 1959 (23) |
| Major Collector | 1960 (21) | 1963 (22) | 1968 (18) | 1949 (32) | 1962 (22) |
| Minor Collector | 1962 (20) | 1964 (24) | 1962 (19) | 1950 (32) | 1963 (23) |
| Local | 1966 (22) | 1963 (28) | 1965 (20) | 1946 (33) | 1963 (27) |
| All Rural Bridges | 1963 (21) | 1963 (26) | 1965 (20) | 1952 (32) | 1963 (24) |
| Urban | |||||
| Interstate | 1970 (12) | 1963 (17) | 1956 (8) | 1975 (19) | 1970 (12) |
| Other Freeways and Expressways | 1973 (16) | 1971 (20) | 1945 (37) | 1980 (15) | 1973 (16) |
| Other Principal Arterial | 1964 (22) | 1962 (25) | 1961 (30) | 1960 (32) | 1964 (23) |
| Minor Arterial | 1964 (22) | 1964 (25) | 1965 (21) | 1946 (33) | 1964 (24) |
| Collector | 1966 (22) | 1965 (25) | 1959 (18) | 1953 (34) | 1965 (24) |
| Local | 1969 (20) | 1966 (25) | 1958 (21) | 1949 (36) | 1966 (25) |
| All Urban Bridges | 1968 (18) | 1965 (25) | 1959 (22) | 1960 (33) | 1967 (21) |
| Rural and Urban | |||||
| Interstate | 1969 (11) | 1963 (17) | 1962 (6) | 1973 (18) | 1969 (11) |
| Other Principal Arterials | 1967 (21) | 1964 (24) | 1965 (22) | 1974 (22) | 1967 (21) |
| Minor Arterials | 1960 (23) | 1965 (26) | 1968 (21) | 1951 (32) | 1961 (24) |
| Collectors | 1961 (21) | 1964 (23) | 1963 (19) | 1951 (33) | 1963 (22) |
| Local | 1966 (22) | 1963 (28) | 1965 (20) | 1947 (34) | 1964 (27) |
| All: Rural and Urban | 1964 (20) | 1964 (26) | 1965 (20) | 1957 (33) | 1964 (24) |
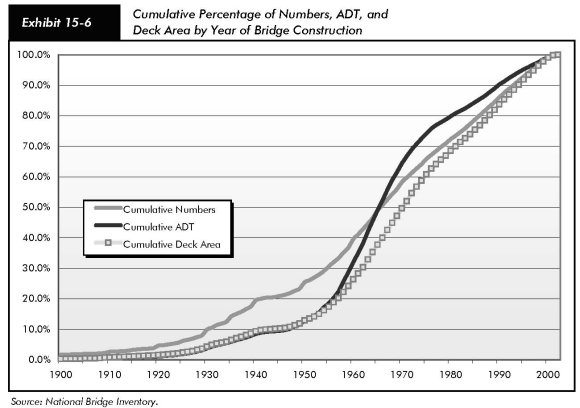
The cumulative distributions shown in Exhibit 15-6 depict the increased rate of construction during the Interstate era. Cumulative distribution curves are presented for the numbers, ADT, and deck area. The mean year of construction occurs where the curves pass through the 50 percent value and is roughly equivalent when bridges are weighted equally (numbers) or when bridges are weighted by traffic carried (ADT). Half of all the bridges in the country were built before 1964, and 50 percent of all daily traffic carried by the system travels over these structures. The mean year of construction is approximately 1971 where structures are weighted by deck area. This indicates that recent structures tend to be larger than their older counterparts. This conforms with conventional wisdom as standards have changed over time.
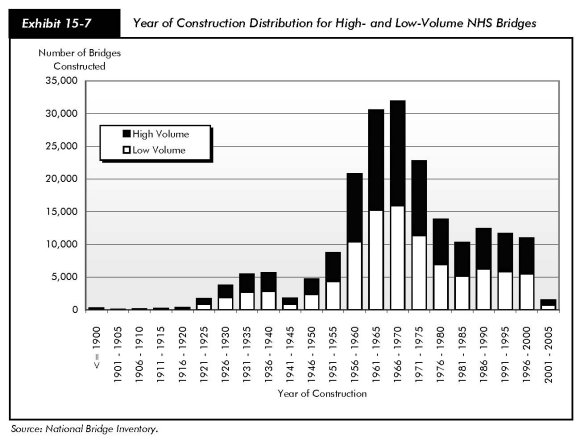
Chapter 17 provides information on the composition and conditions of high and low-volume bridges on and off the NHS. The majority of traffic is carried on NHS structures, which include the Interstate System. High and low-volume NHS structures are defined using a threshold of 50,000 vehicle crossings daily. NHS structures include the majority of higher functional classifications and are typically owned by State agencies. The threshold value for distinguishing between high and low-volume NHS structures is 10,000. Local ownership tends to focus on low-volume non-NHS structures. Exhibits 15-7 and 15-8 show the year of construction distributions for high and low-volume NHS and non-NHS bridges.
Bridges by Type of Superstructure Material
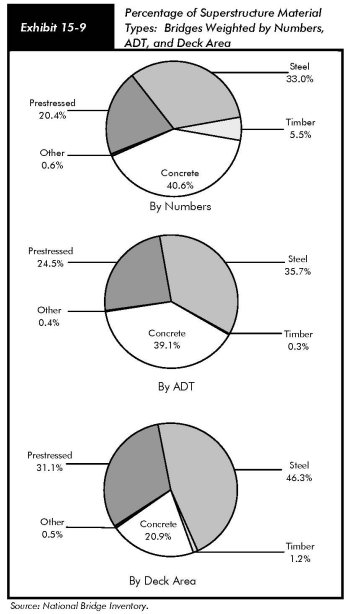
Superstructure material types are maintained in the database for the main span and for the approach spans. Predominant materials used for bridge superstructures are steel, concrete, prestressed concrete, and timber. Other materials, such as aluminum, iron, and composite materials, are utilized on less than 1 percent of the structures. The percentage of superstructure materials utilized is shown in Exhibit 15-9 weighting bridges equally by numbers, weighting by ADT, and weighting by deck area. While only 33.0 percent of bridges have steel superstructures, these bridges carry 35.7 percent of bridge traffic, and represent 46.3 percent of total deck area on all bridges. From these percentages, it may be inferred that steel bridges tend to be utilized for longer-than-average structures carrying higher-than-average volumes of traffic. Timber bridges, which constitute 5.5 percent of the inventory by numbers, carry small volumes of traffic and are smaller than average in terms of deck area.
The number of bridges by type, superstructure material, functional classification, and ownership are shown in Exhibit 15-10. The average year of construction and the standard deviation are shown for these combinations in Exhibit 15-11. Bridges carrying Interstate, other principal arterial, and minor arterial routes are predominantly constructed of reinforced concrete, steel and prestressed concrete. Timber superstructures and other materials become more significant within the population of bridges carrying collectors and local roadways.
Concrete and steel superstructure bridges on the Interstate are, on average, 35 to 40 years old. Prestressed designs were introduced more recently and have become the predominant superstructure material employed today, with over 50 percent of new structures employing prestressed concrete. Today, there are over 45,000 prestressed superstructure bridges carrying Interstates, other principal arterials, and minor arterials in the United States. There are also sizable numbers of prestressed concrete bridges carrying collector and local roadways. Bridges constructed of this material are, on average, 25 years old. The average age of timber superstructure bridges is approximately 45 years, while the average age of other materials is in excess of 65 years. Other materials are used on many older designs that used iron and masonry or on newer structures employing composites or other new materials.
Considering functional classifications, only small variations are seen in the average age of construction between the owners. For all functional classifications and for all material types, the average year of construction (1964/1965) are effectively equivalent for State, local, and Federal owners. There is also minimal variation between the functional classifications with average ages for all functional classifications for State, local, and Federal owners in the 1960s.

| Material & Functional Class | Ownership | ||||
|---|---|---|---|---|---|
| State | Local | Federal | Other | All Owners | |
| Interstate | |||||
| Concrete | 19,843 | 61 | 10 | 3 | 19,917 |
| Steel | 21,532 | 222 | 7 | 16 | 21,777 |
| Prestressed | 13,429 | 30 | 3 | 5 | 13,467 |
| Timber | 4 | 3 | 7 | ||
| Other | 54 | 1 | 55 | ||
| Total | 54,862 | 317 | 20 | 24 | 55,223 |
| Other Principal Arterial | |||||
| Concrete | 30,243 | 3,003 | 15 | 151 | 33,412 |
| Steel | 20,102 | 1,889 | 37 | 165 | 22,193 |
| Prestressed | 18,082 | 1,595 | 21 | 497 | 20,195 |
| Timber | 275 | 28 | 303 | ||
| Other | 176 | 72 | 1 | 4 | 253 |
| Total | 68,878 | 6,587 | 74 | 817 | 76,356 |
| Minor Arterial | |||||
| Concrete | 26,040 | 7,424 | 160 | 101 | 33,725 |
| Steel | 13,197 | 3,299 | 133 | 153 | 16,782 |
| Prestressed | 8,681 | 3,456 | 112 | 64 | 12,313 |
| Timber | 519 | 300 | 30 | 14 | 863 |
| Other | 181 | 199 | 9 | 3 | 392 |
| Total | 48,618 | 14,678 | 444 | 335 | 64,075 |
| Collector | |||||
| Concrete | 40,392 | 37,684 | 849 | 84 | 79,009 |
| Steel | 19,933 | 23,392 | 199 | 208 | 43,732 |
| Prestressed | 12,117 | 17,108 | 278 | 110 | 29,613 |
| Timber | 1,670 | 4,306 | 31 | 45 | 6,052 |
| Other | 313 | 522 | 20 | 7 | 862 |
| Total | 74,425 | 83,012 | 1,377 | 454 | 159,268 |
| Local | |||||
| Concrete | 8,507 | 63,212 | 2,002 | 211 | 73,932 |
| Steel | 16,222 | 71,976 | 1,677 | 469 | 90,344 |
| Prestressed | 6,923 | 36,542 | 1,165 | 147 | 44,777 |
| Timber | 1,215 | 21,337 | 2,400 | 237 | 25,189 |
| Other | 263 | 1,546 | 50 | 9 | 1,868 |
| Total | 33,130 | 194,613 | 7,294 | 1,073 | 236,110 |
| All Bridges | |||||
| Concrete | 125,025 | 111,384 | 3,036 | 550 | 239,995 |
| Steel | 90,986 | 100,778 | 2,053 | 1,011 | 194,828 |
| Prestressed | 59,232 | 58,731 | 1,579 | 823 | 120,365 |
| Timber | 3,683 | 25,974 | 2,461 | 296 | 32,414 |
| Other | 987 | 2,340 | 80 | 23 | 3,430 |
| Total | 279,913 | 299,207 | 9,209 | 2,703 | 591,032 |
classifications, or ownership codes were not included.
| Material & Functional Class | Ownership | ||||
|---|---|---|---|---|---|
| State | Local | Federal | Other | All Owners | |
| Interstate | |||||
| Concrete | 1966 (10) | 1969 (23) | 1963 (2) | 1974 (19) | 1966 (10) |
| Steel | 1968 (11) | 1958 (11) | 1958 (9) | 1966 (17) | 1968 (11) |
| Prestressed | 1975 (11) | 1989 (12) | 1968 (5) | 1993 (5) | 1975 (12) |
| Timber | 1971 (13) | 1969 (15) | 0 (0) | 0 (0) | 1970 (13) |
| Other | 1987 (16) | 1979 (0) | 0 (0) | 0 (0) | 1986 (16) |
| All Materials | 1969 (11) | 1963 (17) | 1962 (6) | 1973 (18) | 1969 (11) |
| Other Principal Arterial | |||||
| Concrete | 1959 (21) | 1960 (23) | 1965 (17) | 1963 (24) | 1960 (21) |
| Steel | 1965 (19) | 1959 (24) | 1954 (20) | 1964 (30) | 1965 (19) |
| Prestressed | 1981 (15) | 1979 (18) | 1985 (9) | 1981 (14) | 1981 (15) |
| Timber | 1942 (12) | 1957 (22) | 0 (0) | 0 (0) | 1944 (14) |
| Other | 1943 (51) | 1913 (36) | 1918 (0) | 1910 (19) | 1933 (49) |
| All Materials | 1967 (21) | 1964 (24) | 1965 (22) | 1974 (22) | 1967 (21) |
| Minor Arterial | |||||
| Concrete | 1954 (22) | 1965 (24) | 1961 (23) | 1953 (33) | 1957 (23) |
| Steel | 1959 (20) | 1956 (27) | 1968 (20) | 1943 (30) | 1958 (22) |
| Prestressed | 1979 (18) | 1977 (19) | 1978 (12) | 1970 (29) | 1978 (18) |
| Timber | 1945 (14) | 1968 (29) | 1958 (14) | 1947 (29) | 1953 (23) |
| Other | 1916 (41) | 1910 (41) | 1983 (13) | 1909 (9) | 1914 (42) |
| All Materials | 1960 (23) | 1965 (26) | 1968 (21) | 1951 (32) | 1961 (24) |
| Collector | |||||
| Concrete | 1957 (20) | 1963 (22) | 1959 (17) | 1951 (33) | 1960 (21) |
| Steel | 1959 (20) | 1956 (24) | 1962 (20) | 1943 (31) | 1958 (22) |
| Prestressed | 1979 (17) | 1978 (17) | 1977 (12) | 1977 (25) | 1978 (17) |
| Timber | 1952 (16) | 1959 (22) | 1955 (15) | 1931 (23) | 1957 (21) |
| Other | 1933 (41) | 1938 (40) | 1954 (43) | 1925 (24) | 1936 (41) |
| All Materials | 1961 (21) | 1964 (23) | 1963 (19) | 1951 (33) | 1963 (22) |
| Local | |||||
| Concrete | 1961 (22) | 1966 (26) | 1960 (19) | 1957 (36) | 1965 (26) |
| Steel | 1964 (20) | 1954 (29) | 1963 (22) | 1940 (32) | 1956 (28) |
| Prestressed | 1979 (15) | 1980 (18) | 1977 (14) | 1974 (26) | 1980 (17) |
| Timber | 1959 (22) | 1960 (23) | 1964 (19) | 1937 (26) | 1960 (23) |
| Other | 1953 (52) | 1936 (43) | 1951 (35) | 1906 (27) | 1939 (44) |
| All Materials | 1966 (22) | 1963 (28) | 1965 (20) | 1947 (34) | 1964 (27) |
| All Classes | |||||
| Concrete | 1959 (20) | 1965 (25) | 1960 (18) | 1957 (32) | 1962 (22) |
| Steel | 1964 (18) | 1955 (28) | 1963 (22) | 1945 (32) | 1959 (24) |
| Prestressed | 1978 (15) | 1980 (18) | 1977 (13) | 1978 (20) | 1979 (16) |
| Timber | 1953 (19) | 1960 (23) | 1964 (19) | 1937 (26) | 1959 (23) |
| Other | 1940 (48) | 1934 (43) | 1954 (37) | 1913 (23) | 1936 (44) |
| All Materials | 1964 (20) | 1964 (26) | 1965 (20) | 1957 (33) | 1964 (24) |