Strategic Highway Network (STRAHNET)
The Strategic Highway Network (STRAHNET) is critical to the Department of Defense's (DoD's) domestic operations. The STRAHNET is a 62,791-mile system of roads deemed necessary for emergency mobilization and peacetime movement of heavy armor, fuel, ammunition, repair parts, food, and other commodities to support U.S. military operations. Even though DoD primarily deploys heavy equipment by rail, highways play a critical role.
The Surface Deployment and Distribution Command Transportation Engineering Agency (SDDCTEA) is the DoD designated agent for public highway matters, including STRAHNET and STRAHNET Connectors. The SDDCTEA identified STRAHNET and the Connector routes in coordination with the Federal Highway Administration (FHWA), the State transportation departments, the military Services and installations, and the ports. Together, STRAHNET and the Connectors define the total minimum defense public highway network needed to support a defense emergency.
System Characteristics
Exhibit 18-1 shows the extent of STRAHNET. Most of the STRAHNET miles in 2002 were on Interstate highway routes. STRAHNET Connectors (about 1,700 miles) are additional highway routes linking over 200 important military installations and ports to STRAHNET. These routes are typically used when moving personnel and equipment during a mobilization or deployment. Additionally, there were 79,852 bridges on STRAHNET in 2002.
| Interstate | 46,749 |
| Non-Interstate | 16,042 |
| Total | 62,791 |
| Q. | Why is the number of bridges shown on the STRANET system in the 2002 report different than the number in the current report? |
| A. | Some of the bridges identified as being on STRAHNET in the last report based on year 2000 data were actually on a broader "Defense Highway Network" that is no longer in existence. Starting with the 2001 National Bridge Inventory data, a major effort was made by States to recode this information to line up better with STRAHNET as it is currently designated. |
Exhibit 18-2 identifies lane miles and daily vehicle miles traveled on STRAHNET in 2002 by functional class.
| Functional Class | Lane Miles | DVMT (millions of miles) |
|---|---|---|
| Rural Areas (Under 5,000 in Population) | ||
| Interstate | 134,945 | 772.14 |
| Other Principal Arterial | 35,583 | 130.14 |
| Minor Arterial | 2,212 | 4.25 |
| Major Collector | 606 | 1.40 |
| Minor Collector | 21 | 0.04 |
| Local | 28 | 0.03 |
Subtotal Rural | 173,395 | 908.00 |
| Urban Areas (5,000 or more in population) | ||
| Interstate | 75,714 | 1,129.49 |
| Other Freeway and Expressway | 7,476 | 114.41 |
| Other Principal Arterial | 6,621 | 41.79 |
| Minor Arterial | 503 | 2.48 |
| Collector | 43 | 0.21 |
| Local | 14 | 0.02 |
Subtotal Urban | 90,372 | 1,288.39 |
| Total Rural and Urban | 263,767 | 2,196.39 |
Physical Conditions: Pavements
Exhibit 18-3 shows the condition of STRAHNET. In 2002, 96.1 percent of all mileage in STRAHNET had a measured pavement roughness (using the International Roughness Index [IRI]) less than or equal to 170 inches per mile. As discussed in Chapters 3 and 17, National Highway System (NHS) pavement with an IRI less than or equal to 170 is classified as "acceptable" in the annual FHWA Performance Plans.
| Percent STRAHNET Miles with IRI ≤ 170 | |
|---|---|
| Interstate | 96.2 |
| Non-Interstate | 95.6 |
| Total | 96.1 |
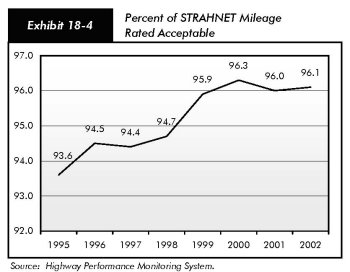
The percent of STRAHNET miles with acceptable ride quality has shown a general increase since 1995. This trend is shown by Exhibit 18-4.
When compared with the NHS, the overall STRAHNET system has consistently been maintained at a higher level of ride acceptability. In 2002, 96.1 percent of the STRAHNET miles were rated at an IRI value of 170 or less, compared with 93.7 percent of the NHS miles rated at an IRI of 170 or less. Exhibit 18-5 compares the percent of miles with IRI in the acceptable range on STRAHNET with that on the NHS from 1998 through 2002.
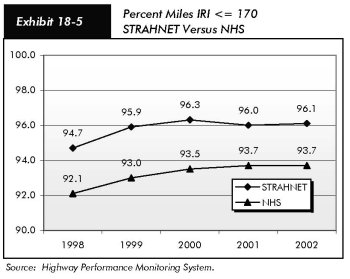
Exhibit 18-6 compares the percentage of vehicle miles traveled on STRAHNET that occurs on pavements with acceptable ride quality with the percentage of total travel on pavements with acceptable ride quality for selected functional classes. For rural principal arterials, STRAHNET routes have a lower percentage of pavements with acceptable ride quality than do non-STRAHNET routes. However, for the remaining functional classes, pavements on STRAHNET appear to be in the same or better condition than those on non-STRAHNET routes.

| STRAHNET | Total System | |
|---|---|---|
| Rural Interstate | 97.3% | 97.3% |
| Rural Other Principal Arterial | 95.4% | 96.2% |
| Rural Minor Arterial | 98.1% | 93.8% |
| Rural Major Collector | 94.3% | 87.6% |
| Urban Interstate | 89.6% | 89.6% |
| Urban Other Freeway and Expressway | 89.6% | 87.8% |
| Urban Other Principal Arterial | 89.1% | 71.0% |
| Urban Minor Arterial | 85.0% | 76.3% |
Physical Conditions: Bridges
Exhibit 18-7 shows the condition of STRAHNET by the percent of deficient bridges on STRAHNET routes. About 20.6 percent of STRAHNET bridges were deficient in 2002. Approximately 5.2 percent were structurally deficient, and 15.3 percent were functionally obsolete. By comparison, about 27.5 percent of all bridges nationwide were deficient in 2002, while roughly 13.7 percent were structurally deficient and 13.8 percent were functionally obsolete. Exhibit 18-8 shows how the percent of deficient STRAHNET bridges has declined since 1995.
| Deficient Bridges | ||
|---|---|---|
| Number | Percent | |
| STRAHNET Bridges | 79,852 | |
| Deficient Bridges | 16,426 | 20.6% |
| Structurally Deficient Bridges | 4,186 | 5.2% |
| Functionally Obsolete Bridges | 79,852 | 15.3% |
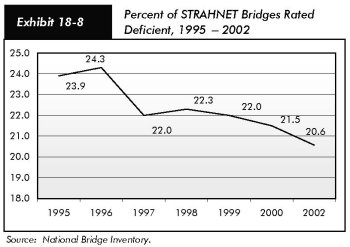
Exhibit 18-9 shows the percent of deficient deck area for STRAHNET bridges. In 2002, 25.7 percent of the deck area on STRAHNET bridges was deficient. By comparison, about 27.5 percent of bridge deck area nationwide was considered deficient.
| All STRAHNET Bridges | 25.7% |
| Structurally Deficient Bridges | 7.9% |
| Functionally Obsolete Bridges | 17.8% |
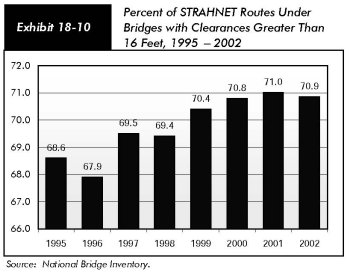
Exhibit 18-10 shows the percent of STRAHNET routes under bridges with vertical clearances greater than 16 feet. In 2002, about 70.9 percent of STRAHNET routes under bridges met this threshold. This indicator has a generally steady improvement since 1995. This is an important measure because military convoys and emergency response vehicles need to be able to clear structures on the STRAHNET system.