


Finance: Highways
Taken together, all levels of government spent $135.9 billion for highways in 2002. The Federal government funded $32.8 billion (24.1 percent). This figure reflects cash outlays by all Federal agencies combined for highway-related purposes, including amounts transferred to State and local governments for use on highways. States funded $69.0 billion (50.8 percent). Counties, cities, and other local government entities funded $34.1 billion (25.1 percent).
Total highway expenditures by all levels of government increased 33.3 percent between 1997 and 2002. Highway spending rose faster than inflation over this period, growing 18.4 percent in constant dollar terms.
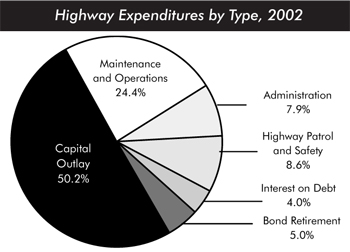
Of the total $135.9 billion spent for highways in 2002, $68.2 billion (50.2 percent) went for capital outlay. 2001 was the first year since 1975 that this percentage exceeded 50 percent.
Capital outlay grew by 41.0 percent between 1997 and 2002. Federal cash expenditures for capital purposes rose 56.3 percent, while State and local capital investment increased by 29.7 percent.
From 1987 to 1997, the portion of total capital outlay funded by the Federal government varied within a range of 41 to 46 percent. This share dropped down to 37.1 percent in 1998, but has subsequently rebounded sharply to 46.1 percent in 2002, as the full effects of increased investment levels under the Transportation Equity Act for the 21st Century (TEA-21) have begun to take hold.
State and local governments devoted more than half of their capital spending to the preservation of their existing roads and bridges in 2002. All levels of government spent a combined $35.8 billion (52.6 percent) of capital funds for system preservation in 2002; $12.9 billion (18.9 percent) went for new roads and bridges; $13.6 billion (19.9 percent) went for adding new lanes to existing roads; and $5.9 billion (8.6 percent) went for system enhancements, such as safety, operational, or environmental enhancements.
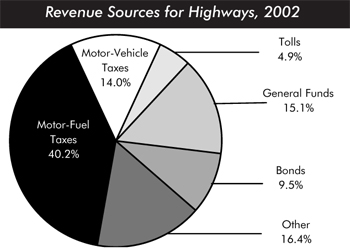
Highway-user revenues—the total amount generated from motor-fuel taxes, motor-vehicle fees, and tolls—were $100.5 billion in 2002. Of this, $79.6 billion (79.2 percent) was spent on highways. This represented 59.1 percent of the total revenues generated by all levels of government in 2002 for use on highways.
States are increasingly looking to the private sector as another potential source of highway and transit funding, either in addition to or in concert with new credit and financing tools. A number of States have taken legislative action to permit greater use of public-private partnerships.