


- National Highway System
- Background
- System Characteristics and Conditions
- Pavement Ride Quality
- Bridges
- Strategic Highway Network
- Operational and Safety Performance
- Finance
- Future Capital Investment and Performance
- Rural NHS Routes
- Urban NHS Routes
- Bridge Rehabilitation and Replacement
- Current Spending and Future Investment
National Highway System
This chapter provides a snapshot of the current physical conditions, operational performance, and finance of the National Highway System (NHS), and projects the potential impacts of future investment on the NHS. The NHS includes the Interstate System as well as other routes most critical to national defense, mobility, and commerce. This chapter represents a supplementary analysis to the information presented for all highways and bridges in Chapters 2 through 9.
Background
With the Interstate System essentially complete, the Intermodal Surface Transportation Efficiency Act of 1991 (ISTEA) revised the Federal-aid highway program for the post-Interstate era. The legislation provided for designation of an NHS that would focus Federal resources on roads that are the most important to interstate travel, economic expansion, and national defense; that connect with other modes of transportation; and that are essential to the country's role in the international marketplace. The NHS was limited to 155,000 miles, plus or minus 15 percent.
The legislation required the U.S. Department of Transportation (DOT) to submit a list and description of proposed NHS routes. This list was submitted in December 1993. Based on the Department's proposals, the National Highway System Designation Act of 1995 identified a 160,955-mile network.
The NHS was designed to be a dynamic system able to change in response to future travel and trade demands. The DOT may approve modifications to the NHS without congressional approval. States must cooperate with local and regional officials in proposing modifications. In metropolitan areas, local and regional officials must act through metropolitan planning organizations and the State transportation department when proposing modifications. A number of such modifications are proposed and approved each year.
The NHS has five components. The first, the Interstate System (described in Chapter 11), is the core of the NHS and includes the most-traveled routes. The second component includes selected other principal arterials deemed most important for commerce and trade. The third is the Strategic Highway Network (STRAHNET), described later in this chapter, which are highways important to military mobilization. The fourth is the system of STRAHNET connectors, also described in this chapter, that provide access between major military installations and routes that are part of STRAHNET. The final component consists of intermodal connectors, which were not included in the 1995 Act but are eligible for NHS funds. These are highways that provide access between major intermodal passenger and freight facilities and the other four subsystems making up the NHS.
The NHS was not envisioned as a new Interstate construction program. The non-Interstate portions of the NHS will be upgraded to the standards appropriate for improved safety and operational efficiency. In ISTEA and subsequent legislation, Congress has authorized funds for this and other purposes aimed at preserving and improving the NHS.
System Characteristics and Conditions
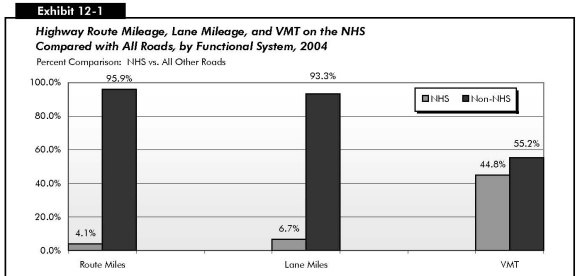
Exhibit 12-1 summarizes NHS route miles, lane miles, and vehicle miles traveled (VMT) for the NHS components. The NHS is overwhelmingly concentrated on higher functional systems. All Interstates are part of the NHS, as are 84.0 percent of rural other principal arterials, 87.5 percent of urban other freeways and expressways, and 35.9 percent of urban other principal arterials. The share of minor arterials, collectors, and local roads on the NHS is relatively small. There are currently 162,158 route miles on the NHS, excluding some sections not yet open to traffic.
| Route Miles | Lane Miles | VMT (Millions) | ||||
|---|---|---|---|---|---|---|
| Total on NHS | Percent of Functional System | Total on NHS | Percent of Functional System | Total on NHS | Percent of Functional System | |
| Rural NHS | ||||||
| Interstate | 31,477 | 100.0% | 128,012 | 100.0% | 267,397 | 100.0% |
| Other Principal Arterial | 80,430 | 83.8% | 214,301 | 85.9% | 211,995 | 87.9% |
| Minor Arterial | 1,901 | 1.4% | 4,731 | 1.7% | 4,466 | 2.6% |
| Major Collector | 705 | 0.2% | 1,530 | 0.2% | 1,326 | 0.7% |
| Minor Collector | 11 | 0.0% | 1,530 | 0.0% | 5 | 0.0% |
| Local | 37 | 0.0% | 88 | 0.0% | 55 | 0.0% |
| Subtotal Rural NHS | 114,562 | 3.8% | 348,680 | 5.7% | 485,244 | 45.3% |
| Urban NHS | ||||||
| Interstate | 15,359 | 100.0% | 84,016 | 100.0% | 459,766 | 100.0% |
| Other Freeway & Expressway | 9,016 | 87.5% | 42,431 | 88.8% | 193,155 | 92.4% |
| Other Principal Arterial | 21,576 | 35.9% | 79,898 | 38.0% | 185,710 | 40.9% |
| Minor Arterial | 1,200 | 1.2% | 3,676 | 1.5% | 6,347 | 1.7% |
| Collector | 328 | 0.3% | 902 | 0.4% | 1,238 | 0.8% |
| Local | 117 | 0.0% | 281 | 0.0% | 246 | 0.1% |
| Subtotal Urban NHS | 47,596 | 4.8% | 211,205 | 9.5% | 846,463 | 44.5% |
| Total NHS | 162,158 | 4.1% | 559,884 | 6.7% | 1,331,707 | 44.8% |
While only 4.1 percent of the Nation's total road mileage is on the NHS, these roads carry 44.8 percent of VMT. This represents an increase since 1997, when 43.5 percent of total VMT were on the NHS. The 559,884 lane miles on the NHS in 2002 represent 6.7 percent of the national total, reflecting the fact that NHS routes are wider on average than non-NHS routes.
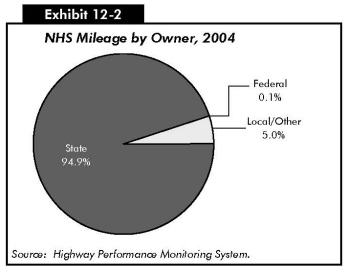
Exhibit 12-2 describes the ownership of NHS mileage. Approximately 94.9 percent of route miles were State-owned in 2004. Only 5.0 percent were locally owned, and the Federal government owned the remaining 0.1 percent. By comparison, 20.4 percent of all route miles in the United States were State-owned, 76.5 percent were locally owned, and the Federal government owned 3.1 percent. (See the "Highways by Ownership" section of Chapter 2.) Since the NHS is concentrated on higher functional systems, the percentage of locally owned NHS routes is relatively small.
Pavement Ride Quality
The Federal Highway Administration 1998 National Strategic Plan introduced a new descriptive term for pavement condition: "acceptable ride quality." That plan stated that, by 2008, 93 percent of the NHS mileage should meet pavement standards for "acceptable ride quality," which was defined as having an International Roughness Index (IRI) value less than or equal to 170 inches per mile. This goal was accomplished in 1999.
The Federal Highway Administration (FHWA) subsequently revised this metric to be based on the percentage of VMT on NHS pavements with acceptable ride quality. This revised metric placed greater emphasis on the benefits of ride quality to highway users and presented a more challenging performance target.
The FHWA has since adopted an even more exacting performance measure and goal. The new performance measure is the total VMT on the NHS on pavements meeting the standard for "good ride quality," defined as having an IRI value less than 95 inches per mile.
Routes on the NHS tend to have better overall pavement condition than the remainder of the highway system pavement. In 2004, the percent of VMT on NHS routes with good ride quality was 52.0, compared with 40.7 percent for the total highway system.
The percentage of NHS VMT on pavements with good ride quality has risen sharply over time, from 37 percent in 1996 to 52 percent in 2004. The VMT on NHS pavements meeting the less stringent standard of acceptable ride quality grew more slowly, from 89 percent in 1996 to 91 percent in 2004. [Exhibit 12-3]
| 1996 | 1997 | 1998 | 1999 | 2000 | 2001 | 2002 | 2003 | 2004 | |
|---|---|---|---|---|---|---|---|---|---|
| Good (IRI<95) | 37% | 39% | 43% | 46% | 48% | 49% | 50% | 52% | 52% |
| Acceptable (IRI<170) | 89% | 89% | 90% | 91% | 91% | 91% | 91% | 91% | 91% |
Rural NHS routes tend to have better pavement conditions than urban NHS routes, as 68.0 percent of rural NHS VMT was on pavements with good ride quality while 42.5 percent of the urban NHS VMT was on pavements with good ride quality. However, the total traffic in urban areas was higher than in rural areas.
Rural NHS VMT on pavements providing good ride quality increased from 66.6 percent in 2002 to 68.0 percent in 2004. The percent of VMT on rural pavements meeting the standard of acceptable ride quality remained fairly constant between 2002, 96.9 percent, and 2004, 97.0 percent. The percentage of NHS VMT on pavements with good ride quality in urban areas increased from 38.6 percent in 2002 to 42.5 percent in 2004. The urban NHS VMT on acceptable pavements rose slightly from 86.3 percent in 2002 to 86.9 percent in 2004. [Exhibit 12-4]
| 2002 | 2004 | |
|---|---|---|
| Rural | ||
| Good (IRI<95) | 66.6% | 68.0% |
| Acceptable (IRI≤170) | 96.9% | 97.0% |
| Urban | ||
| Good (IRI<95) | 38.6% | 42.5% |
| Acceptable (IRI≤170) | 86.3% | 86.9% |
Bridges
The National Bridge Inventory (NBI) shows 115,104 bridges on the NHS. This represented approximately 19.4 percent of the total bridges on the Nation's roadway system. These bridges had approximately 49.5 percent of the total deck area and carried 71.1 percent of the total travel on bridges in the Nation in 2004. State agencies own over 96 percent of the bridges on the NHS. Local agencies own slightly more than 3 percent of the NHS bridges with the remaining less than 1 percent being owned by Federal agencies and other groups.
As shown in Exhibit 12-5, approximately 5.6 percent of NHS bridges were classified as structurally deficient in 2004, down from 5.9 percent in 2002. The percentage classified as functionally obsolete also declined, from 17.2 percent in 2002 to 14.9 percent in 2004. The overall percentage of deficient NHS bridges has continued to decline over time, from 28.7 percent in 1995 to 23.0 percent in 2002 and 20.5 percent in 2004. (See the "Bridge System Conditions" section in Chapter 3 for definitions of these deficiency classifications.)
| 1995 | 1997 | 2000 | 2002 | 2004 | |
|---|---|---|---|---|---|
| Structurally Deficient | 7.9% | 7.7% | 6.0% | 5.9% | 5.6% |
| Functionally Obsolete | 20.9% | 18.4% | 17.7% | 17.2% | 14.9% |
| Total | 28.7% | 26.1% | 23.7% | 23.0% | 20.5% |
As shown in Exhibit 12-6, while 19.4 percent of all bridges were on the NHS, bridges on the NHS represented 14.9 percent of the Nation's total deficient bridges in 2004. Of the total deficient deck area on all bridges in 2004, 46.6 percent was on deficient NHS bridges, which carried 63.4 percent of the travel on deficient bridges. Among structurally deficient bridges, NHS bridges made up only 8.2 percent, but among functionally obsolete bridges, NHS bridges constituted 21.4 percent of the total.
| NHS as Percent of Total for All Bridges | |
|---|---|
| Total Bridges | |
| Percent by Number | 19.4% |
| Percent of Deck Area | 49.5% |
| Percent of Travel Carried | 71.1% |
| Structurally Deficient Bridges | |
| Percent by Number | 8.2% |
| Percent of Deck Area | 42.3% |
| Percent of Travel Carried | 62.6% |
| Functionally Obsolete Bridges | |
| Percent by Number | 21.4% |
| Percent of Deck Area | 49.0% |
| Percent of Travel Carried | 63.7% |
| Total Deficient Bridges | |
| Percent by Number | 14.9% |
| Percent of Deck Area | 46.6% |
| Percent of Travel Carried | 63.4% |
Strategic Highway Network
STRAHNET is a network of highways critical to the U.S. Department of Defense's (DoD's) domestic operations providing access, continuity, and emergency transportation for defense purposes. STRAHNET Connectors are roads and highways that provide links or connections between major military installations and the STRAHNET highways. All STRAHNET highways and STRAHNET Connectors are part of the NHS.
The STRAHNET is a 62,250-mile system of roads deemed necessary for moving personnel and equipment during a mobilization or deployment and the peacetime movement of heavy armor, fuel, ammunition, repair parts, food, and other commodities to support U.S. military operations. Exhibit 12-7 identifies STRAHNET mileage by functional class. Even though DoD primarily deploys heavy equipment by rail, highways play a critical role. Links to over 200 important military installations and ports are provided by approximately 1,700 miles of roadways designated as STRAHNET Connectors.
| Miles | |
|---|---|
| Rural | |
| Interstate | 31,477 |
| Other Principal Arterial | 10,588 |
| Minor Arterial | 903 |
| Major Collector | 214 |
| Minor Collector | 4 |
| Local | 18 |
| Subtotal Rural | 43,204 |
| Urban | |
| Interstate | 15,359 |
| Other Freeway and Expressway | 1,533 |
| Other Principal Arterial | 1,933 |
| Minor Arterial | 188 |
| Collector | 28 |
| Local | 6 |
| Subtotal Urban | 19,047 |
| Total | 62,250 |
The Surface Deployment and Distribution Command Transportation Engineering Agency (SDDCTEA) is the DoD-designated agent for public highway matters, including STRAHNET and STRAHNET Connectors. The SDDCTEA identified STRAHNET and the Connector routes in coordination with the FHWA, the State transportation departments, the military Services and installations, and the ports. Together, STRAHNET and the Connectors define the total minimum defense public highway network needed to support a defense emergency.
As shown in Exhibit 12-8, the percent of VMT on STRAHNET on pavements providing "good" ride quality increased from 54.2 percent in 2002 to 56.9 percent in 2004. The percent of VMT on pavements meeting the "acceptable" standard remained fairly constant from 2002, 92.7 percent, to 2004, 93 percent.
| 2002 | 2004 | |
|---|---|---|
| Rural | ||
| Good (IRI<95) | 69.8% | 72.2% |
| Acceptable (IRI(≤170) | 97.1% | 97.6% |
| Urban | ||
| Good (IRI<95) | 43.1% | 47.6% |
| Acceptable (IRI≤170) | 89.6% | 90.3% |
| Rural and Urban | ||
| Good (IRI<95) | 54.2% | 56.9% |
| Acceptable (IRI≤170) | 92.7% | 93.0% |
In 2004, approximately 72,024 bridges were on the STRAHNET system. This was slightly more than 12.1 percent of all bridges on the Nation's roadway system. Approximately 54.3 percent of the STRAHNET bridges were located in rural areas and 45.6 percent were in urban areas.
In 2004, 20.3 percent of the bridges on the STRAHNET system were rated as deficient compared with 20.6 percent in 2002 [Exhibit 12-9]. In comparison, 26.7 percent of the bridges on the total roadway system for the Nation were rated as deficient in 2004.
| 2002 | 2004 | |
|---|---|---|
| Deficient Bridges | 20.6% | 20.3% |
| Structurally Deficient Bridges | 5.2% | 4.9% |
| Functionally Obsolete Bridges | 15.3% | 15.4% |
Approximately 4.9 percent of STRAHNET bridges were structurally deficient in 2004, down from 5.2 percent in 2002. About 15.4 percent were functionally obsolete in 2004, up slightly from 15.3 percent in 2002. By comparison, of the Nation's total bridges, 13.1 percent were structurally deficient and 13.6 percent were functionally obsolete in 2004.
The structurally deficient bridges were distributed fairly equally between rural and urban areas with approximately 48 percent in rural and 52 percent in urban areas. Rural areas contained approximately 43 percent of the functionally obsolete bridges, while 58 percent were in urban areas.
In 2004, the total deck area of STRAHNET bridges represents more than 32 percent to the Nation's total bridge deck area. The percent of deck area on deficient bridges on STRAHNET was slightly less than 26 percent in 2004. The majority of the deck area on deficient bridges was on functionally obsolete bridges, approximately 18 percent, with the remaining nearly 8 percent being on structurally deficient bridges.
Operational and Safety Performance
Many of the operational performance measures discussed in Chapter 4 are not computed separately for the NHS. However, data for the Daily Vehicle Miles Traveled (DVMT) per Lane Mile metric are available and demonstrate the change in the demand being placed on the NHS. From 2002 to 2004, DVMT per lane mile on the rural NHS decreased from 4,193 to 3,802 and from 11,011 to 10,950 on the urban NHS. The decrease in DVMT per lane mile on the rural NHS can be attributed in part to the transfer of rural lane-miles and the accompanying travel volumes to urban areas due to the urban-rural boundary changes resulting from the 2000 Census. The lane miles that were reclassified from rural to urban would be expected to have a higher than average traffic level for rural areas, so that removing them from the rural category would tend to bring down the rural average DVMT per lane mile. However, these reclassified line miles would also be expected to have lower than average traffic levels for urban areas, so that adding them to the urban category would tend to bring down the urban average as well. This accounts in part for the slight decrease in the DVMT per lane mile on the urban portion of the NHS. (Comparable data for all roads can be found in the "DVMT per Lane Mile" section in Chapter 4).
As stated earlier in this chapter, the NHS carried 44.8 percent of the total VMT on the Nation's roadway system in 2004. The total number of fatalities on the Nation's roadways was 42,636 for 2004. Of these, 13,583, or 31.9 percent, were on the NHS. The fatality rate for 2004 was 1.02 fatalities per 100 million VMT on the NHS, compared with 1.44 per 100 million VMT for all roads.
Finance
Exhibit 12-10 describes highway capital outlay on the NHS by functional system in 2004. Approximately $12.3 billion were spent on NHS rural arterials and collectors in 2004, and another $22.3 billion were spent on urban arterials and collectors on the NHS. Reported State government spending on NHS routes functionally classified as rural local or urban local was negligible in the year 2004. It is not currently possible to identify spending by local government on these routes, which would mainly consist of intermodal connectors and STRAHNET Connectors.
Of the total $34.6 billion spent by all levels of government for the capital improvements to the NHS in 2004, approximately 45.0 percent was used on the Interstate component of the NHS.
| Functional Class | Total ($Billions) | Percent of Total NHS |
|---|---|---|
| Rural Arterials and Collectors | ||
| Interstate | $4.5 | 13.0% |
| Other Principal Arterial | $6.9 | 19.9% |
| Minor Arterial | $0.6 | 1.7% |
| Major Collector | $0.4 | 1.0% |
| Minor Collector | $0.0 | 0.0% |
| Subtotal | $12.3 | 35.6% |
| Urban Arterials and Collectors | ||
| Interstate | $11.0 | 32.0% |
| Other Freeway and Expressway | $5.5 | 15.9% |
| Other Principal Arterial | $5.0 | 14.6% |
| Minor Arterial | $0.4 | 1.1% |
| Collector | $0.3 | 0.8% |
| Subtotal | $22.3 | 64.4% |
| Subtotal, Rural and Urban | $34.6 | 100.0% |
| Rural and Urban Local | $0.0 | 0.0% |
| Total, All Systems | $34.6 | 100.0% |
Exhibit 12-11 categorizes capital spending on the NHS by type of improvement. System rehabilitation expenditures of $14.8 billion constituted 42.7 percent of total NHS capital spending in 2004. The $17.0 billion spent for system expansion represented 49.3 percent of total NHS capital spending, while the $2.8 billion spent for NHS system enhancement constituted 8.0 percent.
The $34.6 billion spent for capital improvements to the NHS in 2004 constituted 49.2 percent of the $70.3 billion identified in Chapter 6 as the total amount of highway capital investment on all roads. Approximately 40.5 percent of total highway rehabilitation investment on all roads was directed toward the NHS, including 16.4 percent directed toward rural NHS routes and 24.2 percent directed toward urban NHS routes.
Of total highway system expansion investment on all roads in 2004, approximately 61.9 percent was directed toward the NHS, including 19.9 percent directed toward rural NHS routes and 42.0 percent directed toward urban NHS routes. Approximately 43.7 percent of total capital expenditures classified as system enhancements on all roads in 2004 was directed toward NHS routes. (See the "Capital Outlay by Improvement Type" section in Chapter 6 for definitions of these improvement types.)
| Total Invested (Billions of Dollars) | Percent of Total | NHS Percent of Total Capital Expenditures for All Highways | |||||
|---|---|---|---|---|---|---|---|
| Rural | Urban | Total | Rural | Urban | Total | ||
| System Rehabilitation | |||||||
| Highway | $4.6 | $5.4 | $10.0 | 28.8% | 17.7% | 20.7% | 38.4% |
| Bridge | $1.4 | $3.4 | $4.8 | 13.9% | 13.0% | 32.9% | 45.9% |
| Subtotal | $6.0 | $8.8 | $14.8 | 42.7% | 16.4% | 24.2% | 40.5% |
| System Expansion | |||||||
| Additions to Existing Roadways | $2.9 | $4.4 | $7.3 | 21.2% | 22.8% | 34.3% | 57.1% |
| New Routes | $2.3 | $6.3 | $8.6 | 24.8% | 17.4% | 48.0% | 65.4% |
| New Bridges | $0.3 | $0.9 | $1.1 | 3.3% | 18.3% | 54.6% | 72.9% |
| Subtotal | $5.5 | $11.5 | $17.0 | 49.3% | 19.9% | 42.0% | 61.9% |
| System Enhancement | $0.9 | $1.9 | $2.8 | 8.0% | 13.5% | 30.2% | 43.7% |
| Total Investment | $12.3 | $22.3 | $34.6 | 100.0% | 17.5% | 31.7% | 49.2% |
Future Capital Investment and Performance
This section mirrors the investment analysis in Chapter 11 for rural and urban Interstates, expanding it to include the non-Interstate sections of the NHS. Exhibits 12-12 through 12-15 show the impacts of different levels of future capital spending on the physical conditions and operational performance of the rural and urban portions of the NHS. The first line in each exhibit shows current values for each of the measures, and the second line corresponds to the maximum economically efficient level of investment. All investment levels are in constant 2004 dollars.
Exhibits 12-12 and 12-14 show the impact of different levels of combined highway rehabilitation and expansion spending on rural and urban pavement condition, respectively, and Exhibits 12-13 and 12-15 show the impact of these same outlays on measures of rural and urban operational performance. Highway rehabilitation and system expansion investments are modeled by the Highway Economic Requirements System (HERS) (see Appendix A).
Expenditures on system enhancement (including traffic operational improvements, safety improvements, and environmental enhancements) are not directly modeled and are not included in the totals shown in the exhibits. Bridge rehabilitation and replacement investment is discussed separately below.
Rural NHS Routes
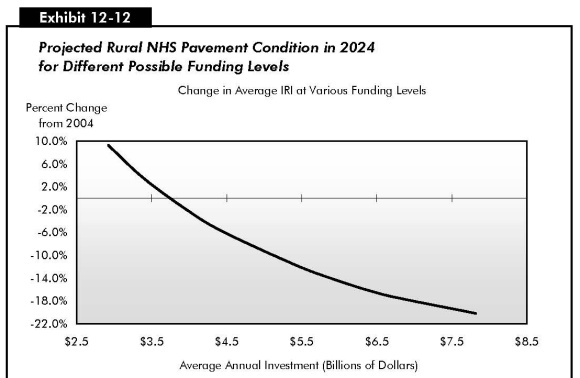
Exhibit 12-12 shows projected values for the average IRI and the percentage of VMT at an IRI below 95 ("good" ride quality) and below 170 ("acceptable" ride quality). The exhibit shows that the 2004 rehabilitation and expansion investment level of $10.1 billion on rural NHS routes exceeded the maximum economic investment level of $7.8 billion estimated by HERS. As a result, significant improvements in pavement quality on the rural NHS would be expected if 2004 funding levels were maintained in constant dollars over 20 years. Once the existing backlog of pavement deficiencies is addressed, the model suggests that investments of this type could be cost effectively scaled back. The percent of rural NHS travel on roads with "good" ride quality could be maintained at a funding level of $4.5 billion annually.
|
|
|
Is it possible to spend above the Maximum Economic Investment (Cost to Improve) level in a given year, while still investing only in cost-beneficial projects?
Yes. The values identified in this report for the "Maximum Economic Investment" scenario are average annual values for a 20-year period. There is currently a significant backlog of cost-beneficial improvements that could be made. It would be possible for investment to exceed the Cost to Improve level for several years before this backlog would be exhausted.
|
| Average Annual Highway Rehabilitation + Expansion Investment (Rural NHS) (Billions of 2004 Dollars) | Percent Change in Average IRI |
Percent of VMT on Roads with IRI<95 IRI<170 |
Funding Level Description: Investment Required to... | |
|---|---|---|---|---|
| $10.1 | 68.4% | 96.9% | 2004 Values | |
| $7.8 | -20.2% | 85.2% | 99.4% | |
| $6.8 | -17.4% | 83.1% | 98.9% | |
| $6.4 | -16.1% | 82.0% | 98.7% | |
| $5.9 | -14.1% | 79.9% | 98.4% | |
| $5.4 | -11.8% | 77.5% | 98.0% | |
| $4.5 | -5.9% | 70.3% | 97.2% | ...Maintain VMT with IRI<95 |
| $4.0 | -2.1% | 65.7% | 96.8% | ...Maintain Avg IRI |
| $3.4 | 3.5% | 59.5% | 96.2% | |
| $2.9 | 9.3% | 53.4% | 95.2% | |
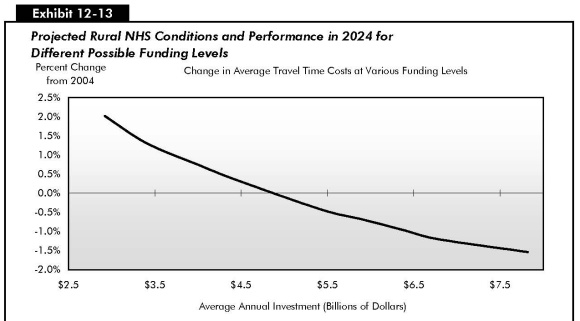
Exhibit 12-13 indicates that significant improvements in operational performance on the rural portion of the NHS would also result if the rehabilitation and expansion investment levels for 2004 were continued in the future, with values for average delay per VMT (discussed in Chapter 9), total user costs, and travel time costs all declining by a wide margin. Average user costs on rural NHS routes would be maintained at an average annual investment level of $4.0 billion, while average delay and average travel time costs could be maintained at a funding level of $5.4 billion. As also noted for the rural Interstate component of the NHS in Chapter 11, while the percentage changes in average total delay at various funding levels are large, they are applied to a relatively small base, as delay on the NHS in rural areas is significantly lower than in urban areas.
| Average Annual Highway Rehabilitation + Expansion Investment (Rural NHS) (Billions of 2004 Dollars) |
Percent Change in | Funding Level Description: Investment Required to... |
||
|---|---|---|---|---|
| Average Total Delay |
Total User Costs | Travel Time Costs | ||
| $10.1 | 2004 Values | |||
| $7.8 | -16.9% | -2.2% | -1.5% | |
| $6.8 | -13.3% | -1.9% | -1.2% | |
| $6.4 | -10.3% | -1.8% | -1.0% | |
| $5.9 | -7.6% | -1.6% | -0.7% | |
| $5.4 | -4.1% | -1.4% | -0.4% | ...Maintain Avg Delay and Travel Time Costs |
| $4.5 | 4.5% | -0.8% | 0.3% | |
| $4.0 | 9.5% | -0.4% | 0.8% | ...Maintain Average User Costs |
| $3.4 | 15.2% | 0.1% | 1.3% | |
| $2.9 | 22.9% | 0.7% | 2.0% | |
Urban NHS Routes
Exhibit 12-14 shows that the current rehabilitation and expansion investment level of $16.9 billion on urban NHS sections would likely be sufficient to maintain average IRI and the percentage of travel on pavements with "acceptable" ride quality on these sections, assuming the mix of future rehabilitation and capacity investments was consistent with those that HERS has identified. The percentages of travel on urban NHS pavements with "good" ride quality would increase significantly at this level of investment.
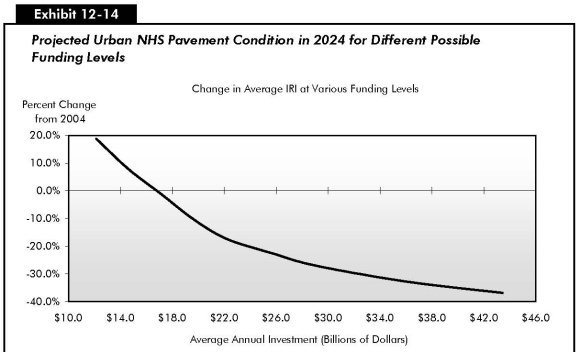
| Average Annual Highway Rehabilitation + Expansion Investment (Urban NHS) (Billions of 2004 Dollars) |
Percent Change in Average IRI |
Percent of VMT on Roads with IRI<95 IRI<170 |
Funding Level Description: Investment Required to... |
|
|---|---|---|---|---|
| $16.9 | 44.1% | 87.8% | 2004 Values | |
| $43.4 | -36.8% | 88.6% | 98.5% | |
| $36.3 | -32.9% | 85.0% | 97.1% | |
| $29.1 | -27.1% | 80.2% | 95.2% | |
| $25.6 | -22.4% | 76.5% | 93.9% | |
| $22.2 | -17.3% | 71.7% | 92.5% | |
| $19.6 | -10.1% | 67.1% | 90.6% | |
| $17.1 | -0.9% | 61.0% | 87.9% | ...Maintain Avg IRI and VMT with IRI<170 |
| $14.6 | 7.7% | 55.2% | 85.1% | |
| $12.1 | 18.9% | 49.2% | 81.9% | |
Exhibit 12-15 indicates that an average annual investment level in highway rehabilitation and capacity expansion of between $17.1 and $19.6 billion would be needed to maintain average total user costs on urban NHS routes. These amounts are higher than the 2004 level of rehabilitation and expansion expenditure on these roads ($16.9 billion). Funding levels between $19.6 and $22.2 billion annually would be required to maintain average total delay and average travel time costs on the NHS in urban areas. These amounts are approximately $3 billion to $5 billion higher than the comparable 2004 funding. Rehabilitation and expansion funding levels on the urban NHS as a whole are thus much closer (in percentage terms) to the levels that would be needed to maintain performance than is the case for the Interstate portion of the NHS alone.
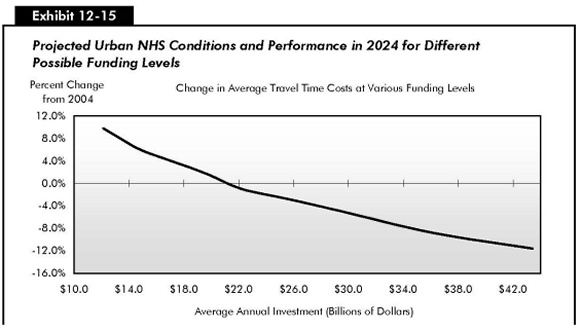
| Average Annual Highway Rehabilitation + Expansion Investment (Urban NHS) (Billions of 2004 Dollars) |
Percent Change in | Funding Level Description: Investment Required to... |
||
|---|---|---|---|---|
| Average Total Delay |
Total User Costs | Travel Time Costs | ||
| $16.9 | 2004 Values | |||
| $43.4 | -35.6% | -9.0% | -11.6% | |
| $36.3 | -26.7% | -7.5% | -8.9% | |
| $29.1 | -13.7% | -5.2% | -4.8% | |
| $25.6 | -7.6% | -4.0% | -2.8% | |
| $22.2 | -2.0% | -2.7% | -1.0% | ...Maintain Avg Delay and Travel Time Costs |
| $19.6 | 5.6% | -1.0% | 1.7% | ...Maintain Average User Costs |
| $17.1 | 11.9% | 0.6% | 4.0% | |
| $14.6 | 18.1% | 2.2% | 6.2% | |
| $12.1 | 27.9% | 4.6% | 9.8% | |
Bridge Rehabilitation and Replacement
As described in Chapter 7, the National Bridge Investment Analysis System (NBIAS) model analyzes rehabilitation and replacement investment for all bridges, including those on the NHS. The current NHS bridge investment backlog is estimated at $32.1 billion. (See the "Bridge Investment Backlog" section in Chapter 7).
Exhibit 12-16 describes what the NHS bridge backlog after 20 years would be at different funding levels. An average annual investment in bridge rehabilitation and replacement of $3.5 billion in constant 2004 dollars would be required so that the NHS bridge investment backlog would not increase above its current level over a 20-year period. An average annual investment of $5.1 billion is estimated to be sufficient to eliminate the existing NHS bridge investment backlog and correct other deficiencies that are expected to develop over the next 20 years, where it is cost-beneficial to do so.
| Average Annual Investment | 2024 NHS Bridge Backlog |
|---|---|
| $5.1 | $0.0 |
| $4.8 | $5.6 |
| $4.6 | $11.1 |
| $4.4 | $15.0 |
| $3.9 | $24.2 |
| $3.5 | $32.1 |
| $3.1 | $40.1 |
| $2.6 | $52.5 |
Exhibit 12-10 indicated that bridge rehabilitation expenditures on the NHS totaled $4.8 billion in 2004. If this level of investment were maintained in constant dollar terms over 20 years, NBIAS projects that the bridge investment backlog would decline to $5.6 billion.
Current Spending and Future Investment
Exhibits 12-12 through 12-16 indicate that current levels of highway rehabilitation and system expansion investment on rural sections of the NHS are well above the levels necessary to maintain conditions and performance in the future, and even exceed the maximum level of economic investment estimated by HERS. The same is true of current levels of bridge investment relative to the levels identified in NBIAS for maintaining or eliminating the NHS bridge investment backlog. On urban Interstates, maintaining current funding levels for rehabilitation and expansion would be expected to result in improved pavement quality, but a slight decline in overall operational performance.