


- Summary
- Highway
- Bridge
- Transit
- Highway System Characteristics
- Highways by Ownership
- Highways by Ownership and Size of Area
- Highways by Purpose
- Review of Functional Classification Concepts
- Functional Classification Data
- Highway Travel
- Intelligent Transportation Systems (ITS)
- Highways by Ownership
- Bridge System Characteristics
- Bridges by Owner
- Bridges by Functional Classification
- Bridges by Traffic Carried
- Bridges by Age
- Bridges by Material
- Transit System Characteristics
- System History
- System Infrastructure
- Transit Agencies
- Transit Fleet
- Track, Stations, and Maintenance Facilities
- System Coverage: Urban Directional Route Miles
- System Capacity
- Ridership
- Rural Transit Systems (Section 5311 Providers)
- Transit System Characteristics for Americans with Disabilities and the Elderly
Summary
Exhibit 2-1 summarizes the key findings in this chapter, comparing system and use characteristics data in this report with the 2002 values shown in the 2004 Conditions and Performance (C&P) Report. Some of the 2002 values have subsequently been revised, which is reflected in the second column as appropriate. The third column contains comparable values based on 2004 data.
| 2002 Data | |||
|---|---|---|---|
| Statistic | 2004 C&P Report | Revised | 2004 Data |
| Percentage of Total Highway Miles Owned by Local Governments | 77.5% | 76.5% | |
| Percentage of Total Highway Miles Owned by State Governments | 19.5% | 20.4% | |
| Percentage of Total Highway Miles Owned by the Federal Government | 3.0% | 3.1% | |
| Local Transit Operators in Urbanized Areas | 610 | 640 | |
| Rural and Specialized Transit Service Providers | 6,051 | 6,051 | |
| Total Rural Highway Miles (Population under 5,000) | 3.08 million | 3.00 million | |
| Total Urban Highway Miles (Population equal to or above 5,000) | 0.90 million | 0.99 million | |
| Total Highway Miles | 3.98 million | 3.99 million | |
| Transit Route Miles (Rail) | 9,484 | 9,782 | |
| Transit Route Miles (Nonrail) | 225,820 | 216,620 | |
| Total Transit Route Miles | 235,304 | 226,402 | |
| Total Rural Highway Lane Miles (Population under 5,000) | 6.31 million | 6.15 million | |
| Total Urban Highway Lane Miles (Population equal to or above 5,000) | 2.02 million | 2.23 million | |
| Total Highway Lane Miles | 8.33 million | 8.37 million | |
| Urban Transit Capacity-Equivalent Miles (Rail) | 2.18 billion | 2.27 billion | 2.41 billion |
| Urban Transit Capacity-Equivalent Miles (Nonrail) | 2.03 billion | 2.04 billion | 2.06 billion |
| Urban Transit Capacity-Equivalent Miles (Total) | 4.21 billion | 4.31 billion | 4.48 billion |
| Vehicle Miles Traveled on Rural Highways (Population under 5,000) | 1.13 trillion | 1.07 trillion | |
| Vehicle Miles Traveled on Urban Highways (Population equal to or above 5,000) | 1.74 trillion | 1.91 trillion | |
| Vehicle Miles Traveled on All Highways | 2.87 trillion | 2.98 trillion | |
| Transit Passenger Miles (Rail) | 24.6 billion | 25.7 billion | |
| Transit Passenger Miles (Nonrail) | 21.3 billion | 20.9 billion | |
| Transit Passenger Miles (Total) | 45.9 billion | 46.5 billion | |
Highway
There were almost 4 million miles of public roads in the United States in 2004, of which 3.0 million miles were in rural areas (rural areas are defined as locations with less than 5,000 people, and urban communities are defined as those areas with 5,000 or more people). Local governments controlled 76.5 percent of total highway miles in 2004; States controlled 20.4 percent; and the Federal government owned 3.1 percent. Hence, the Nation's highway system is overwhelmingly rural and local.
Total highway lane mileage was almost 8.4 million in 2004. Total lane miles have increased at an average annual rate of about 0.2 percent since 1995, mostly in urban areas. Urban lane mileage grew to more than 2.2 million by 2004, while rural lane mileage decreased to nearly 6.2 million.
|
|
|
Is the increase in urban lane mileage entirely due to new construction?
No. While some of the additional lane miles are attributable to new road construction or the widening of existing roads, a significant percentage is attributable to functional reclassification due to population growth and the adjustment of urban boundaries due to the results of the 2000 census.
As urban boundaries have expanded to encompass areas formerly classified as rural, the mileage within those boundaries has been reclassified as small urban mileage. The same situation has occurred as urbanized area boundaries have expanded to subsume areas that were formerly classified as rural or small urban.
Since the 2000 census, States have been gradually updating their reported mileage data in the Highway Performance Monitoring System (HPMS) to reflect these new urban boundaries.
|
The total number of vehicle miles traveled (VMT) between 1995 and 2004 maintained the same growth rate, an average annual rate of 2.5 percent, as for the period from 1993 to 2002 as presented in the previous C&P report. Approximately 1.1 trillion VMT were on rural highways with 1.9 trillion VMT on urban roads. The total VMT in rural areas decreased from 2002 to 2004 by 0.06 trillion VMT. Total traffic increased in metropolitan areas by 0.17 trillion VMT between 2002 and 2004.
Bridge
There were 594,101 bridges in excess of 6 meters (20 feet) in total length on public roads in the United States in 2004. While 76.8 percent of bridges are located in rural areas, 72.6 percent of the daily traffic on bridges is carried by the urban structures. Responsibility for and ownership of bridges is split primarily between State agencies (47.6 percent) and local governments (50.6 percent). Federal agencies own less than 8,500 bridges nationwide (1.4 percent), and there are a small number of privately owned or railroad-owned bridges carrying public roadways. State agencies tend to own bridges located on higher functional classifications, such as principal arterials; the majority of local government bridges are located on local and collector roadways.
|
|
|
Are the 2004 HPMS data cited in this report fully consistent with those reported in the Highway Statistics 2004 publication?
The data reflected in this report represent the latest available HPMS data as of the date the chapters were written. As the data submitted by the States are reviewed for omissions or inconsistencies, revisions are submitted by the States to correct these items. The statistics presented in this report are not fully consistent with comparable information presented in the Highway Statistics 2004 publication, since certain States have subsequently revised their data. The HPMS database is subject to further change if other States identify a need to revise their data. Such changes will be reflected in the next edition of the C&P report. Additional information on HPMS is available on the following Web site: https://www.fhwa.dot.gov/policyinformation/hpms.cfm
|
Transit
Transit system coverage, capacity, and use in the United States continued to increase between 2002 and 2004. In 2004, there were 640 transit operators serving urbanized areas compared with 610 operators in 2002. In 2002, the most recent year for which information is available, there were an estimated 4,836 providers of special service transit services to the elderly and disabled in both urban and rural areas. In 2000, the most recent year for which information is available, there were 1,215 transit operators serving rural areas. A transit provider may be an independent agency; a unit of a regional transportation agency; or a unit of a state, county, or city government.
In 2004, transit agencies in urban areas operated 120,659 vehicles, of which 92,520 were in areas of more than 1 million people. Rail systems had 10,892 miles of rail track and 2,961 rail stations, compared with 10,722 miles of track and 2,862 stations in 2002. The number of bus and rail maintenance facilities in urban areas increased from 769 in 2002 to 793 in 2004, and the number of stations increased from 2,862 in 2002 to 2,961 in 2004. The most recent survey of rural transit operators, undertaken in 2000, estimated that 19,185 transit vehicles operated in rural areas; the Federal Transit Administration (FTA) has estimated that in 2002 there were 37,720 special service vehicles operated for the elderly and disabled, of which 16,219 had been funded by the FTA.
In 2004, transit systems operated 226,402 directional route miles, of which 216,620 were nonrail and 9,782 were rail route miles. Total route miles decreased in total by 3.8 percent between 2002 and 2004. Nonrail route miles decreased by 4.1 percent, and rail route miles increased by 3.1 percent.
Transit system capacity as measured by capacity-equivalent vehicle revenue miles (VRM) increased by 3.9 percent in total between 2002 and 2004. Capacity-equivalent VRM measure the distance traveled by a transit vehicle in revenue service, adjusted by the passenger-carrying capacity of each transit vehicle type, with the passenger-carrying capacity of a motorbus representing the baseline. The capacity of rail modes increased by 6.1 percent between 2002 and 2004 in total, and the capacity of nonrail modes by 1.3 percent. In 2004, as in earlier years, slightly more than half of capacity-equivalent VRM were provided by rail modes, and slightly less than half were provided by nonrail modes. Capacity-equivalent VRM provided by light rail systems grew rapidly between 2002 and 2004, reflecting New Starts openings and extensions, increasing in total by 19.3 percent.
Transit passenger miles increased by 1.3 percent in total between 2002 and 2004, from 45.9 billion to 46.5 billion. Passenger miles traveled on nonrail modes decreased from 21.3 billion in 2002 to 20.9 billion in 2004, or by total of 2.1 percent. Passenger miles on rail transit modes increased in total by 4.3 percent, from 24.6 billion in 2002 to 25.7 billion in 2004.
Highway System Characteristics
Highways are typically classified by either ownership or purpose, a distinction used in previous editions of the C&P report. Ownership can be determined by which jurisdiction has primary responsibility over a particular portion of the infrastructure, while purpose and level of service are identified by the item's function. This section presents highway miles by jurisdiction as well as system and use characteristics by functional classification.
Highways by Ownership
Ownership is largely split among the Federal, State, and local governments. Roads owned by these governments are considered "public." States own almost 20 percent of the Nation's public road mileage. The Federal government has control over about 3 percent, primarily in National parks and forests, on Indian reservations, and on military bases.
In 2004 over 76 percent of American roads were locally owned, although some intergovernmental agreements may authorize States to construct and maintain locally owned highways. Approximately 1,050 counties in the United States had at least 1 mile of public roads owned by the Federal Government. Most of these counties are in the Western United States.
As Exhibit 2-2 demonstrates, the share of locally owned roads has shown slight growth over the past decade. The share of local public road mileage increased from 75.9 to 76.5 percent between 1995 and 2004. During that same period, the share of State-owned public road mileage grew slightly, from 19.7 to 20.4 percent.
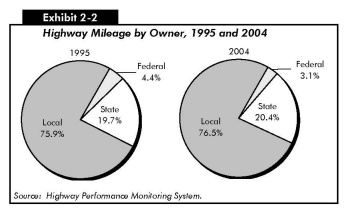
The Federally owned public road mileage has declined from 1995 to 2004 from 4.4 to 3.1 percent. Federal road mileage reached a peak in 1984, when 7 percent of all public roads were owned by the Federal government, and has steadily decreased since then, until reaching the current 3.1 percent in 2004. As noted in the previous C&P report, much of the change occurred as the result of Federal land management agencies reclassifying some of their mileage from public to nonpublic status.
Highways by Ownership and Size of Area
Highway mileage in urban areas has continued to increase in recent years, accompanied by a decrease in rural mileage. This is depicted in Exhibit 2-3, which shows that total mileage in small urban areas grew by an average annual rate of 1.2 percent between 1995 and 2004. In larger urbanized areas, 50,000 or greater in population, the annual growth was 2.3 percent between 1995 and 2004. In rural areas, however, highway mileage decreased at an average annual rate of 0.3 percent over the same time period
| 1995 | 1997 | 2000 | 2002 | 2004 | Annual Rate of Change 2004/1995 | |
|---|---|---|---|---|---|---|
| Rural Areas (under 5,000 in population) | ||||||
| Federal | 170,574 | 167,368 | 116,707 | 117,775 | 118,866 | -3.9% |
| State | 660,666 | 661,473 | 663,763 | 664,814 | 683,789 | 0.4% |
| Local | 2,259,064 | 2,280,042 | 2,308,842 | 2,295,006 | 2,200,786 | -0.3% |
| Subtotal Rural | 3,090,304 | 3,108,883 | 3,089,312 | 3,077,595 | 3,003,441 | -0.3% |
| Small Urban Areas (5,000-49,999 in population) | ||||||
| Federal | 494 | 482 | 458 | 980 | 723 | 4.3% |
| State | 27,442 | 27,455 | 27,596 | 27,639 | 30,719 | 1.3% |
| Local | 139,825 | 143,848 | 148,094 | 154,869 | 155,406 | 1.2% |
| Subtotal Small Urban Areas | 167,761 | 171,785 | 176,148 | 183,488 | 186,848 | 1.2% |
| Urbanized Areas (50,000 or more in population) | ||||||
| Federal | 982 | 980 | 1,026 | 1,840 | 2,847 | 12.6% |
| State | 83,016 | 83,428 | 83,944 | 84,135 | 101,881 | 2.3% |
| Local | 574,319 | 587,426 | 597,837 | 632,025 | 702,446 | 2.3% |
| Subtotal Urbanized Areas | 658,317 | 671,834 | 682,807 | 718,000 | 807,173 | 2.3% |
| Total Highway Miles | ||||||
| Federal | 172,050 | 168,830 | 118,191 | 120,595 | 122,436 | -3.7% |
| State | 771,124 | 772,356 | 775,303 | 776,588 | 816,388 | 0.6% |
| Local | 2,973,208 | 3,011,316 | 3,054,773 | 3,081,900 | 3,058,638 | 0.3% |
| Total | 3,916,382 | 3,952,502 | 3,948,267 | 3,979,083 | 3,997,462 | 0.2% |
| Percent of Total Highway Miles | ||||||
| Federal | 4.4% | 4.3% | 3.0% | 3.0% | 3.1% | |
| State | 19.7% | 19.5% | 19.6% | 19.5% | 20.4% | |
| Local | 75.9% | 76.2% | 77.4% | 77.5% | 76.5% | |
| Total | 100.0% | 100.0% | 100.0% | 100.0% | 100.0% | |
Two factors have contributed to the apparent increase in urban highway mileage, in addition to the construction of new roads. First, the redefinition of urban boundaries based on the 2000 decennial census has resulted in an expansion of urban areas, and thus has moved some rural mileage into urban areas. Also, the FHWA has recently focused on achieving a more complete reporting of highways owned by Federal agencies that are not primarily transportation oriented. The result has been a significant increase in the Federal mileage in urban areas shown in Exhibit 2-3.
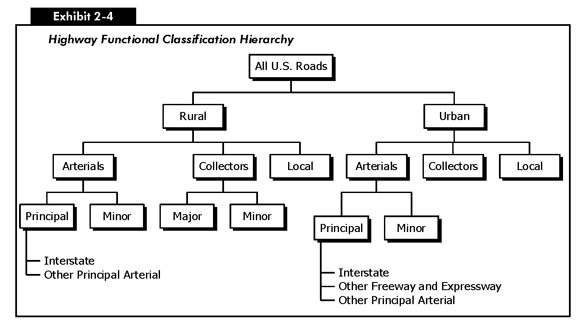
Highways by Purpose
Another way to categorize roads is by purpose, which is commonly called functional classification. The Highway Functional Classification System (HFCS) is the basic organization used for most of this report. Exhibit 2-4 shows the hierarchy of the HFCS pictorially.
Review of Functional Classification Concepts
The overarching principle of functional classification is interconnectedness or system. That is, each segment of road other than the lowest classification (local) should connect at both ends only to another segment functionally classified at an equal or higher level. Exceptions to this principle typically occur because of unusual geographic or traffic conditions (e.g., connections to international borders, coastal cities, waterports, and airports).
Roadways serve two important functions: land access and mobility. The better any individual segment is at serving one of these functions, the worse it is at serving the other. Thus, routes on the Interstate Highway System will allow a driver to travel long distances in a relatively short time, but will not allow the driver to enter each farm field or business along the way. Contrarily, a subdivision street will allow a driver access to any address along its length, but will not allow the driver to travel at a high rate of speed and will frequently be interrupted by intersections, often controlled by stop signs.
Arterials provide the highest level of mobility, at the highest speed, for long and uninterrupted travel. Arterials typically have higher design standards than other roads. They often include multiple lanes and have some degree of access control.
The rural arterial network provides interstate and intercounty service so that all developed areas are within a reasonable distance of an arterial highway. This network is broken down into principal and minor routes, of which principal roads are more significant. Virtually all urbanized areas with more than 50,000 people, and most urban areas with more than 25,000 people, are connected by rural principal arterial highways. The rural principal arterial network is divided into two subgroups, Interstate highways and other principal arterials.
Similarly, in urban areas the arterial system is divided into principal and minor arterials. The urban principal arterial system is the most important group; it includes (in descending order of importance) Interstate highways, other freeways and expressways, and other principal arterials. The urban principal arterial system serves major metropolitan centers, corridors with the highest traffic volume, and those with the longest trip lengths. It carries most trips entering and leaving metropolitan areas and provides continuity for rural arterials that cross urban boundaries. Urban minor arterial routes provide service for trips of moderate length at a lower level of mobility. They connect with the urban principal arterial system and other minor arterial routes.
Collectors provide a lower degree of mobility than arterials. They are designed for travel at lower speeds and for shorter distances. Generally, collectors are two-lane roads that collect travel from local roads and distribute it to the arterial system.
The rural collector system is stratified into two subsystems: major and minor collectors. Major collectors serve larger towns not accessed by higher order roads, and important industrial or agricultural centers that generate significant traffic but are not served by arterials. Rural minor collectors are typically spaced at intervals consistent with population density to collect traffic from local roads and to ensure that a collector road serves all small urban areas.
In urban areas, the collector system provides traffic circulation within residential neighborhoods and commercial and industrial areas. Unlike arterials, collector roads may penetrate residential communities, distributing traffic from the arterials to the ultimate destination for many motorists. Urban collectors also channel traffic from local streets onto the arterial system. Unlike rural collectors, the urban collector system has no subclassification.
Local roads represent the largest element in the American public road network in terms of mileage. For rural and urban areas, all public road mileage below the collector system is considered local. Local roads provide basic access between residential and commercial properties, connecting with higher order highways.
Functional Classification Data
Exhibit 2-5 summarizes the percentage of highway miles, lane miles, and VMT stratified by functional system. The share of mileage on rural systems declined from 2002 to 2004 from 77.3 to 75.1 percent, a trend shown earlier in Exhibit 2-3. The share of lane miles on rural highways also decreased during this same period of time, from 75.7 to 73.4 percent and the share of VMT in rural areas decreased from 39.4 percent to 35.9 percent. These declines are due, in large part, to the results of urban boundary changes based on the results of the 2000 census.
| Functional System | Miles | Lane Miles | VMT |
|---|---|---|---|
| Rural Areas (under 5,000 in population) | |||
| Interstate | 0.8% | 1.5% | 9.0% |
| Other Principal Arterial | 2.4% | 3.0% | 8.1% |
| Minor Arterial | 3.4% | 3.4% | 5.7% |
| Major Collector | 10.5% | 10.1% | 6.7% |
| Minor Collector | 6.7% | 6.4% | 2.0% |
| Local | 51.3% | 49.0% | 4.4% |
| Subtotal Rural | 75.1% | 73.4% | 35.9% |
| Small Urban Areas (5,000-49,999 in population) | |||
| Interstate | 0.1% | 0.1% | 0.9% |
| Other Freeway and Expressway | 0.0% | 0.1% | 0.3% |
| Other Principal Arterial | 0.3% | 0.5% | 2.1% |
| Minor Arterial | 0.5% | 0.5% | 1.4% |
| Collector | 0.6% | 0.6% | 0.7% |
| Local | 3.2% | 3.0% | 1.1% |
| Subtotal Small Urban Area | 4.7% | 4.8% | 6.5% |
| Urbanized Areas (50,000 or more in population) | |||
| Interstate | 0.3% | 0.9% | 14.6% |
| Other Freeway and Expressway | 0.2% | 0.5% | 6.7% |
| Other Principal Arterial | 1.2% | 2.0% | 13.2% |
| Minor Arterial | 2.0% | 2.5% | 10.9% |
| Collector | 2.0% | 2.0% | 4.8% |
| Local | 14.5% | 13.9% | 7.5% |
| Subtotal Urbanized Areas | 20.2% | 21.8% | 57.5% |
| Total | 100.0% | 100.0% | 100.0% |
The share of urban mileage, for both small urban and urbanized areas, increased between 2002 and 2004, from 22.6 to 24.9 percent. Total lane mileage for both types of urban areas also increased, from 24.3 to 26.6 percent. The share of VMT in small urban and urbanized areas increased from 60.6 percent to 64 percent from 2002 to 2004
In 2004, the rural Interstate and the rural other principal arterial systems accounted for approximately 0.8 percent and 2.4 percent of total miles in the United States, respectively, while carrying 9.0 percent and 8.1 percent, respectively, of total travel. These two systems carried a total of 47.5 percent of all rural travel (rural Interstate—25 percent, rural other principal arterials—22.5 percent). Rural minor arterials represented 3.4 percent of total U.S. miles but carried 5.7 percent of total travel in the United States, or 15.8 percent of rural travel.
During 2004 the urban Interstate and the urban other freeway and expressway systems comprised slightly less than 1.6 percent of the total highway lane-miles in the Nation. These two systems carried approximately 22.5 percent of the total travel in the Nation and 35 percent of the total VMT in small urban and urbanized areas. The small urban and urbanized minor arterial networks represented 3.0 percent of total U.S. lane-miles. This system carried 19.1 percent of total travel for the Nation, or 12.3 percent of urban travel.
|
|
|
Does the decrease in rural lane mileage signify roadway abandonment?
Public road mileage rarely is abandoned. Rural mileage near metropolitan areas is routinely functionally reclassified as urban mileage as urban boundaries expand, resulting in a decrease in the rural mileage without an abandonment of any roadway. The results of the 2000 census have caused many urban boundaries to expand, thereby removing amounts of highway mileage from the rural category and reclassifying it as urban in the HPMS database. This change does not occur immediately as the individual States do not complete their adjustments at the same time and therefore submit their new data over a period of time. The majority of mileage adjustments in the rural and urban categories associated with the 2000 census appears in this edition of the C&P report.
|
Rural major collectors accounted for 10.1 percent of total U.S. lanes-miles in 2004. They carried 6.7 percent of total travel, in the United States, or 18.8 percent of rural travel. The rural minor collector system accounted for 6.4 percent of total U.S. lane-miles in 2004. These roads carried 2.0 percent of total travel, in the United States, or 5.6 percent of rural travel.
In 2004, the small urban and urbanized collector networks accounted for 2.6 percent of U.S. lane-miles but carried 5.5 percent of total travel, in the United States, or 8.6 percent of urban travel.
In 2004, rural local roads represented 49.0 percent of total U.S. lane-miles. This is a decrease from 52.9 percent from 2002. Local roads carried only 4.4 percent of total travel, in the United States, or only 7.8 percent of rural travel. Roads classified as local roads in small urban areas, 5,000 to 49,999 population, and local roads in urbanized areas, 50,000 or more in population, accounted for 16.9 percent of total lane-miles in the Nation for the year 2004, an increase from 16.2 percent in 2002. The functional classification local roads in the small urban and urbanized areas carried approximately 8.6 percent of total travel, in the United States, or 3.5 percent of urban travel.
Exhibit 2-6 shows the total public road route mileage in the United States. In 2004, there were slightly more than 3.99 million route miles in the United States. Approximately 75.1 percent of this mileage, or just over 3 million route miles, was in rural areas. The remaining 24.9 percent of route mileage, or approximately 994,000 miles, was in urban communities. Overall route mileage increased by an average annual rate of about 0.2 percent between 1995 and 2004. On an average annual basis, mileage decreased by 0.4 percent in rural America and increased at an average annual rate of 1.2 percent in small urban communities and in urbanized areas at an average annual rate of 2.3 percent from 1995 to 2004.
| Functional System | 1995 | 1997 | 2000 | 2002 | 2004 | Annual Rate of Change 2004/1995 |
|---|---|---|---|---|---|---|
| Rural Areas (under 5,000 in population) | ||||||
| Interstate | 32,703 | 32,919 | 33,152 | 33,107 | 31,477 | -0.4% |
| Other Principal Arterial | 98,039 | 98,358 | 99,023 | 98,945 | 95,998 | -0.2% |
| Minor Arterial | 137,440 | 137,791 | 137,863 | 137,855 | 135,683 | -0.1% |
| Major Collector | 432,492 | 433,500 | 433,926 | 431,754 | 420,293 | -0.3% |
| Minor Collector | 274,750 | 273,043 | 272,477 | 271,371 | 268,088 | -0.3% |
| Local | 2,125,054 | 2,141,111 | 2,115,293 | 2,106,725 | 2,051,902 | -0.4% |
| Subtotal Rural | 3,100,478 | 3,116,722 | 3,091,733 | 3,079,757 | 3,003,441 | -0.4% |
| Small Urban Areas (5,000-49,999 in population) | ||||||
| Interstate | 1,731 | 1,744 | 1,794 | 1,808 | 2,088 | 2.1% |
| Other Freeway and Expressway | 1,282 | 1,253 | 1,219 | 1,227 | 1,218 | -0.6% |
| Other Principal Arterial | 12,432 | 12,477 | 12,474 | 12,590 | 13,532 | 0.9% |
| Minor Arterial | 19,538 | 19,635 | 19,800 | 19,926 | 19,956 | 0.2% |
| Collector | 21,301 | 21,338 | 21,535 | 21,813 | 23,706 | 1.2% |
| Local | 111,566 | 115,420 | 119,342 | 126,140 | 126,348 | 1.4% |
| Subtotal Small Urban Areas | 167,850 | 171,867 | 176,163 | 183,503 | 186,848 | 1.2% |
| Urbanized Areas (50,000 or more in population) | ||||||
| Interstate | 11,569 | 11,651 | 11,729 | 11,832 | 13,270 | 1.5% |
| Other Freeway and Expressway | 7,740 | 7,864 | 7,977 | 8,150 | 9,087 | 1.8% |
| Other Principal Arterial | 40,622 | 40,993 | 41,084 | 41,090 | 46,556 | 1.5% |
| Minor Arterial | 69,475 | 70,050 | 70,502 | 70,996 | 78,491 | 1.4% |
| Collector | 66,623 | 67,312 | 67,263 | 68,033 | 79,680 | 2.0% |
| Local | 462,537 | 474,044 | 484,650 | 518,309 | 580,088 | 2.5% |
| Subtotal Urbanized Areas | 658,566 | 671,914 | 683,205 | 718,409 | 807,173 | 2.3% |
| Total Highway Route Miles | 3,926,894 | 3,960,503 | 3,951,101 | 3,981,670 | 3,997,462 | 0.2% |
Exhibit 2-7 shows the number of highway lane miles by functional system. In 2004, there were 8.3 million lane miles in the United States. Lane miles have grown at an average annual rate of about 0.2 percent since 1995, mostly in urban areas (lane mileage in rural areas having decreased overall by 0.3 percent per year during the same time period). In small urban areas (those with between 5,000 and 49,999 residents) lane miles grew at 1.2 percent while in urbanized areas (those with 50,000 or more residents), lane miles grew at 2.2 percent annually between 1995 and 2004. It must be noted that part of the increase in mileage in small urban and urbanized areas is the result of the expansion of the boundaries of these areas due to the results of the 2000 census, rather than to the construction of new roads.
| Functional System | 1995 | 1997 | 2000 | 2002 | 2004 | Annual Rate of Change 2004/1995 |
|---|---|---|---|---|---|---|
| Rural Areas (under 5,000 in population) | ||||||
| Interstate | 132,346 | 133,573 | 135,000 | 135,032 | 128,012 | -0.4% |
| Other Principal Arterial | 245,164 | 248,921 | 253,586 | 256,458 | 249,480 | 0.2% |
| Minor Arterial | 288,222 | 288,872 | 287,750 | 288,391 | 283,173 | -0.2% |
| Major Collector | 872,767 | 875,393 | 872,672 | 868,977 | 845,513 | -0.4% |
| Minor Collector | 549,500 | 546,085 | 544,954 | 542,739 | 536,177 | -0.3% |
| Local | 4,250,107 | 4,282,222 | 4,230,588 | 4,213,448 | 4,103,804 | -0.4% |
| Subtotal Rural | 6,338,106 | 6,375,066 | 6,324,550 | 6,305,044 | 6,146,159 | -0.3% |
| Small Urban Areas (5,000-49,999 in population) | ||||||
| Interstate | 7,269 | 7,365 | 7,626 | 7,776 | 8,890 | 2.3% |
| Other Freeway and Expressway | 4,828 | 4,747 | 4,627 | 4,685 | 4,754 | -0.2% |
| Other Principal Arterial | 37,135 | 37,618 | 37,806 | 38,275 | 41,015 | 1.1% |
| Minor Arterial | 44,390 | 44,982 | 45,212 | 45,682 | 45,335 | 0.2% |
| Collector | 43,755 | 44,216 | 44,525 | 45,095 | 48,977 | 1.3% |
| Local | 223,132 | 230,839 | 238,684 | 252,279 | 252,697 | 1.4% |
| Subtotal Small Urban Areas | 360,509 | 369,767 | 378,482 | 393,793 | 401,667 | 1.2% |
| Urbanized Areas (50,000 or more in population) | ||||||
| Interstate | 64,865 | 65,603 | 67,020 | 68,088 | 75,127 | 1.6% |
| Other Freeway and Expressway | 35,705 | 36,655 | 37,428 | 38,782 | 43,016 | 2.1% |
| Other Principal Arterial | 143,572 | 146,585 | 149,224 | 150,250 | 169,491 | 1.9% |
| Minor Arterial | 183,595 | 185,273 | 184,199 | 187,512 | 205,434 | 1.3% |
| Collector | 143,517 | 145,927 | 145,313 | 147,020 | 171,201 | 2.0% |
| Local | 925,073 | 948,087 | 969,300 | 1,036,619 | 1,160,175 | 2.5% |
| Subtotal Urbanized Areas | 1,496,327 | 1,528,130 | 1,552,484 | 1,628,271 | 1,824,444 | 2.2% |
| Total Highway Lane Miles | 8,194,942 | 8,272,963 | 8,255,516 | 8,327,108 | 8,372,270 | 0.2% |
Highway Travel
This section describes highway infrastructure use, which is typically defined by VMT. During the 1990s, Americans traveled at record levels, a phenomenon prompted by the booming economy, population growth, and other socioeconomic factors. As Exhibit 2-8 shows, VMT grew by an average annual rate of 2.3 percent between 1995 and 2004. By the end of that period, Americans were traveling almost 3.0 trillion vehicle miles annually. Approximately 1.1 trillion vehicle miles were on rural highways, and 1.9 trillion vehicle miles were on urban roads.
| (Millions of Miles) Functional System | 1995 | 1997 | 2000 | 2002 | 2004 | Annual Rate of Change 2004/1995 |
|---|---|---|---|---|---|---|
| Rural Areas (under 5,000 in population) | ||||||
| Interstate | 224,705 | 241,451 | 269,533 | 281,461 | 267,397 | 2.0% |
| Other Principal Arterial | 215,988 | 229,133 | 249,177 | 258,009 | 241,282 | 1.2% |
| Minor Arterial | 156,253 | 164,129 | 172,772 | 177,139 | 169,168 | 0.9% |
| Major Collector | 194,420 | 202,588 | 210,595 | 214,463 | 200,926 | 0.4% |
| Minor Collector | 50,386 | 52,809 | 58,183 | 62,144 | 60,278 | 2.0% |
| Local | 105,819 | 113,248 | 127,560 | 139,892 | 132,474 | 2.5% |
| Subtotal Rural | 947,571 | 1,003,358 | 1,087,820 | 1,133,107 | 1,071,524 | 1.4% |
| Small Urban Areas (5,000-49,999 in population) | ||||||
| Interstate | 17,310 | 18,393 | 21,059 | 22,578 | 25,784 | 4.5% |
| Other Freeway and Expressway | 8,854 | 9,251 | 9,892 | 10,442 | 10,245 | 1.6% |
| Other Principal Arterial | 53,202 | 55,359 | 58,170 | 59,490 | 61,426 | 1.6% |
| Minor Arterial | 39,270 | 40,845 | 43,035 | 44,566 | 41,961 | 0.7% |
| Collector | 18,710 | 19,749 | 20,412 | 21,492 | 21,761 | 1.7% |
| Local | 27,970 | 30,368 | 33,277 | 34,241 | 33,439 | 2.0% |
| Subtotal Small Urban Areas | 165,317 | 173,965 | 185,845 | 192,808 | 194,616 | 1.8% |
| Urbanized Areas (50,000 or more in population) | ||||||
| Interstate | 327,329 | 346,376 | 376,116 | 389,903 | 433,982 | 3.2% |
| Other Freeway and Expressway | 141,980 | 151,231 | 168,293 | 180,199 | 198,840 | 3.8% |
| Other Principal Arterial | 313,676 | 332,448 | 343,186 | 351,436 | 392,442 | 2.5% |
| Minor Arterial | 251,470 | 263,296 | 283,854 | 297,393 | 323,846 | 2.9% |
| Collector | 104,453 | 111,874 | 116,596 | 122,129 | 142,569 | 3.5% |
| Local | 179,392 | 176,268 | 202,774 | 207,480 | 224,178 | 2.5% |
| Subtotal Urbanized Areas | 1,318,300 | 1,381,495 | 1,490,819 | 1,548,540 | 1,715,857 | 3.0% |
| Total VMT | 2,431,188 | 2,558,818 | 2,764,484 | 2,874,455 | 2,981,998 | 2.3% |
| Total PMT | 3,868,070 | 4,089,366 | 4,390,076 | 4,667,038 | 4,832,394 | 2.5% |
While highway mileage is mostly rural, a majority of highway travel (almost 64 percent) occurred in urban areas in 2004. In the 2004 C&P report it was noted that rural travel had grown faster than urban over the period from 1993 to 2002; however, in looking at the period from 1995 to 2004, that trend has reversed. The average annual rate of change for rural travel was 1.4 percent between 1995 and 2004. For the same period the average annual rate of change in small urban areas was 1.8 percent and for urbanized areas the rate was 2.9 percent. Again, it must be noted, the portions of these increases are the result of the expansion of the boundaries of these areas due to the results of the 2000 census and the inclusion of travel that was previously recorded in the rural category.
Exhibit 2-8 shows that, in rural areas, travel grew the fastest on the local roadways while the highest VMT was still on the Interstate system. The highest growth in travel in small urban areas was on the Interstate system at an average annual rate of 4.5 percent. The most travel was on the other principal arterials in small urban areas. For urbanized areas the most growth was on other freeways and expressways with 3.8 percent. The most travel in urbanized areas was on the Interstate system.
Exhibits 2-9 and 2-10 expand on the information in Exhibit 2-8. They depict highway travel by functional classification and vehicle type. Three types of vehicles are identified: passenger vehicles (PV), including buses and 2-axle, 4-tire models; single-unit (SU) trucks having 6 or more tires; and combination (combo) trucks, including trailers and semi-trailers. The totals in Exhibit 2-9 include all vehicles, whereas those in Exhibit 2-10 exclude motorcycles.
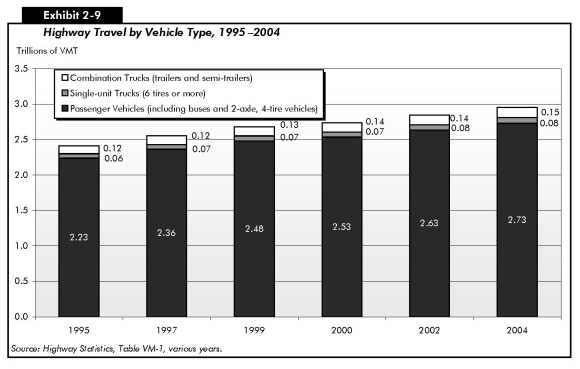
For the period from 1995 to 2004, travel among all vehicle types and on all functional classifications grew fastest among single-unit and combination trucks. Between 1995 and 2004, for example, combination truck traffic grew by 2.5 percent per year on rural Interstates and single-unit truck traffic grew by 2.7 percent per year on the rural Interstate system. The largest rates of growth have been on the urban Interstate system with single-unit trucks having an average annual growth of 4.4 percent from 1995 to 2004 and combination trucks having an average annual growth of 4.1 percent for the same period. Overall, passenger vehicle travel grew by an average annual rate of 2.2 percent between 1995 and 2004. Single-unit trucks grew by 2.9 percent per year and combination trucks grew by 2.6 percent per year for the same period.
| Annual Rate of Change | |||||||
|---|---|---|---|---|---|---|---|
| Functional System Vehicle Type |
1995 | 1997 | 2000 | 2002 | 2004 | 2004/2002 | 2004/1995 |
| Rural Interstate | |||||||
| PV | 178,973 | 189,869 | 214,532 | 224,375 | 211,369 | -2.9% | 1.9% |
| SU | 6,708 | 7,671 | 8,236 | 8,745 | 8,548 | -1.1% | 2.7% |
| Combo | 36,643 | 41,665 | 44,248 | 45,633 | 45,754 | 0.1% | 2.5% |
| Other Arterial | |||||||
| PV | 330,029 | 351,313 | 377,270 | 389,758 | 365,951 | -3.1% | 1.2% |
| SU | 12,980 | 13,688 | 13,644 | 14,606 | 14,771 | 0.6% | 1.4% |
| Combo | 24,076 | 25,505 | 28,005 | 27,818 | 27,817 | 0.0% | 1.6% |
| Other Rural | |||||||
| PV | 314,158 | 341,323 | 366,433 | 383,724 | 361,080 | -3.0% | 1.6% |
| SU | 12,948 | 13,698 | 13,722 | 14,963 | 15,611 | 2.1% | 2.1% |
| Combo | 12,676 | 12,471 | 12,555 | 14,090 | 15,035 | 3.3% | 1.9% |
| Total Rural | |||||||
| PV | 823,160 | 882,505 | 958,235 | 997,857 | 938,400 | -3.0% | 1.5% |
| SU | 32,636 | 35,057 | 35,602 | 38,314 | 38,930 | 0.8% | 2.0% |
| Combo | 73,395 | 79,641 | 84,808 | 87,541 | 88,606 | 0.6% | 2.1% |
| Urban Interstate | |||||||
| PV | 314,422 | 331,343 | 359,592 | 373,957 | 415,254 | 5.4% | 3.1% |
| SU | 7,148 | 7,906 | 8,716 | 9,106 | 10,512 | 7.4% | 4.4% |
| Combo | 18,491 | 20,643 | 23,465 | 23,887 | 26,481 | 5.3% | 4.1% |
| Other Urban | |||||||
| PV | 1,097,161 | 1,146,289 | 1,213,109 | 1,259,859 | 1,372,307 | 4.4% | 2.5% |
| SU | 22,921 | 23,930 | 26,182 | 28,467 | 31,665 | 5.5% | 3.7% |
| Combo | 23,565 | 24,300 | 26,747 | 27,215 | 30,310 | 5.5% | 2.8% |
| Total Urban | |||||||
| PV | 1,411,583 | 1,477,632 | 1,572,701 | 1,633,816 | 1,787,561 | 4.6% | 2.7% |
| SU | 30,069 | 31,836 | 34,898 | 37,573 | 42,177 | 5.9% | 3.8% |
| Combo | 42,056 | 44,943 | 50,212 | 51,102 | 56,791 | 5.4% | 3.4% |
| Total | |||||||
| PV | 2,234,743 | 2,360,137 | 2,530,936 | 2,631,673 | 2,725,961 | 1.8% | 2.2% |
| SU | 62,705 | 66,893 | 70,500 | 75,887 | 81,107 | 3.4% | 2.9% |
| Combo | 115,451 | 124,584 | 135,020 | 138,643 | 145,397 | 2.4% | 2.6% |
Intelligent Transportation Systems (ITS)
All of the previous exhibits represent a traditional look at the highway system—its mileage, ownership, functional classification, and use. This section looks at the extent of ITS deployment and integration in metropolitan areas. ITS uses advanced technology to improve highway safety and efficiency. The deployment of ITS for freight and operations management are discussed more fully in Chapters 14 and 15.
Exhibit 2-11 describes the deployment of ITS devices in 78 of the largest metropolitan areas, based on a survey by the U.S. Department of Transportation Intelligent Transportation Systems Joint Program Office. The exhibit shows that freeway deployment has advanced steadily, with real-time data collection sensors deployed on more than one-third of the total freeway mileage, and on-call service patrols covering half of the freeway mileage. Arterial deployment of service patrols lags behind that seen on freeways, but is advancing steadily. Transit agencies have advanced rapidly in deployment of ITS, with more than half of the buses equipped with automatic vehicle location capability by 2005. Other well-established ITS technologies are electronic fare payment for transit vehicles, computer-aided dispatch on emergency vehicles, and electronic toll collection.
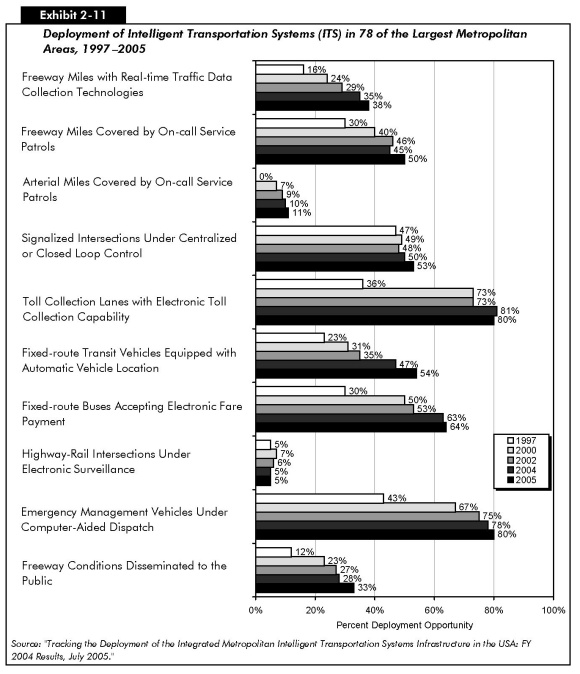
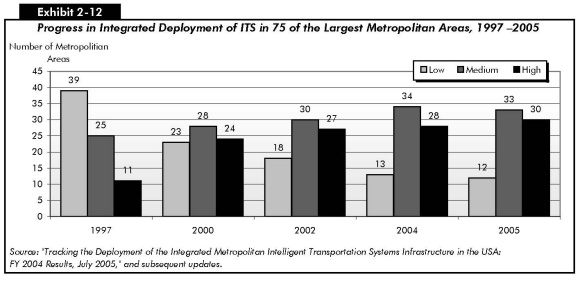
Exhibit 2-12 shows the progress of deployment of an integrated ITS infrastructure in 75 of the largest metropolitan areas. The measure incorporates both deployment and integration. Progress in deployment is measured by tracking outputs for five key infrastructure components: freeways, arterials, transit, public safety, and information dissemination. Integration is measured by assessing links between agencies, chosen to involve key levels of government and transit agencies. Crossing a threshold value for either deployment or integration means that a metropolitan area has made a significant commitment to deploy and integrate the metropolitan ITS infrastructure. However, it does not mean that deployment or integration is complete. Progress has been tracked through a series of national surveys covering 1997 through 2005. The exhibit shows that substantial progress was made in deploying integrated infrastructures in this period, with the number of areas ranked low going from 39 to 12, and the number ranked high going from 11 to 30.
Bridge System Characteristics
The National Bridge Inventory (NBI) contains nearly 700,000 records, which describe either the features carried by a bridge, termed as "on" records, or the features crossed by the structure, termed as "under" records. Separating the on records from the under records reveals that there were 594,101 bridges over 6.1 meters (20 feet) in total length located on public roads in the United States in 2004. As discussed in Chapter 3, the National Bridge Inspection Standards require biennial safety inspections of bridges that exceed this length; as part of these inspections, information is collected concerning both the characteristics and physical conditions of the structures.
Bridges by Owner
Exhibit 2-13 shows the number of highway bridges by owner from 1996 to 2004. State and local ownership includes highway agencies; park, forest, and reservation agencies; toll authorities; and other State or local agencies, respectively. The vast majority of State and local bridges are owned by highway agencies. Federal ownership includes a number of agencies, mostly from the Department of Interior and the Department of Defense. A small number (less than 1 percent) of bridges carrying public roadways are owned by other agencies, such as private entities and railroads.
| Number of Bridges by Year | |||||
|---|---|---|---|---|---|
| Owner | 1996 | 1998 | 2000 | 2002 | 2004 |
| Federal | 6,171 | 7,748 | 8,221 | 9,371 | 8,425 |
| State | 273,198 | 273,897 | 277,106 | 280,266 | 282,552 |
| Local | 299,078 | 298,222 | 298,889 | 299,354 | 300,444 |
| Private/Railroad | 2,378 | 2,278 | 2,299 | 1,502 | 1,497 |
| Unknown/Unclassified | 1,037 | 1,131 | 415 | 1,214 | 1,183 |
| Total | 581,862 | 583,276 | 586,930 | 591,707 | 594,101 |
|
|
|
Is information on railroad bridge inspections included in the NBI?
Bridges carrying railroads are not included in the database unless they also carry a public road or cross a public road where information of certain features, such as vertical or horizontal clearances, is required for management of the highway system.
Some bridges carrying highway traffic are owned by railroads. For instance, a public road that crosses railroad tracks may be owned by the railroad if built within the railroad right-of-way. Ownership in these cases depends on the agreements made between the political jurisdiction and the railroad.
|
Local agencies own 300,444 bridges on the Nation's roadways, or 50.6 percent of all bridges. These agencies include cities, counties, townships, and other non-State or non-Federal governmental agencies. State agencies own 47.6 percent, or 282,552 of the Nation's bridges on all functional roadway classifications. State and local agencies, when combined, own 582,996 of the total 594,101 of the Nation's bridges or 98.2 percent of all bridges on the Nation's roadway system.
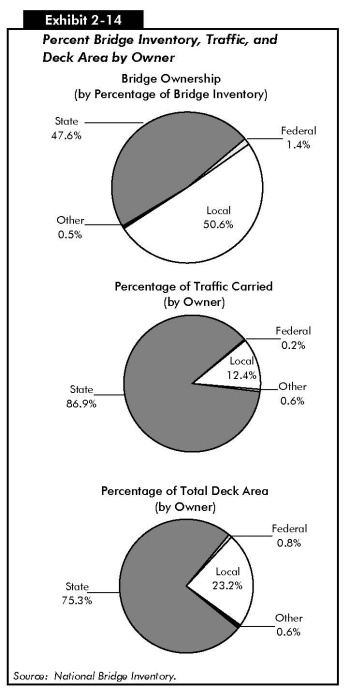
Deeper insight into the condition or the composition of bridges can be obtained by considering the size of the structure and/or the traffic carried. Consideration of the structure size can be incorporated using the bridge deck area data. Consideration of the volume of traffic served by the structure can be incorporated using average daily traffic (ADT) data. Exhibit 2-14 compares the ownership percentages based on the actual number of bridges with percentages based on ADT on bridges and bridge deck area, respectively. Bridges owned by State agencies carry significantly higher cumulative traffic volumes, on average, than bridges owned by local agencies. State-owned bridges also tend to have greater deck area than locally owned bridges.
|
|
|
How do the bridge ownership percentages compare with the road ownership percentages?
The majority of bridges (98 percent) and roadways (97 percent) are owned by State and local agencies. Bridge ownership is nearly equally divided between State (47 percent) and local agencies (51 percent). The vast majority of roadways, however, are owned by local agencies (77 percent). States tend to own larger, higher-volume structures, such as those on Interstates and expressways. Localities own smaller structures on lower-volume roadways, such as local roads and collectors.
|
If an agency owns a bridge, it is responsible for the maintenance and operation of the structure. Interagency agreements may be formed, such as those between State highway agencies and localities. In these cases, a secondary agency (such as the State) performs maintenance and operation work under agreement. This, however, does not transfer ownership and therefore does not negate the responsibilities of the bridge owners for maintenance and operation in compliance with Federal and State requirements.
Bridges by Functional Classification
Highway functional classifications are maintained by the NBI according to the hierarchy used for highway systems previously described. The number of bridges by functional classification is summarized and compared with previous years in Exhibit 2-15. Overall percentages of each functional classification tend to remain relatively constant over time, although bridges are functionally reclassified as urban boundaries change.
| Functional Classification | 1996 | 1998 | 2000 | 2002 | 2004 | |
|---|---|---|---|---|---|---|
| Rural | ||||||
| Interstate | 28,638 | 27,530 | 27,797 | 27,316 | 27,648 | |
| Other Arterial | 72,970 | 73,324 | 74,796 | 74,814 | 76,456 | |
| Collector | 144,246 | 143,140 | 143,357 | 144,101 | 143,470 | |
| Local | 211,059 | 210,670 | 209,415 | 209,722 | 208,641 | |
| Subtotal | 456,913 | 454,664 | 455,365 | 455,953 | 456,215 | |
| Urban | ||||||
| Interstate | 26,596 | 27,480 | 27,882 | 27,929 | 27,929 | |
| Other Arterial | 59,064 | 60,901 | 63,177 | 65,667 | 66,443 | |
| Collector | 14,848 | 14,962 | 15,038 | 15,171 | 15,548 | |
| Local | 24,441 | 24,962 | 25,684 | 26,609 | 27,940 | |
| Subtotal | 124,949 | 128,305 | 131,781 | 135,376 | 137,860 | |
| Total | 581,862 | 582,969 | 587,146 | 591,329 | 594,075 | |
Rural bridges are predominant based on the number of bridges on the Nation's roadway systems as 76.8 percent of all structures are located in a rural environment. Urban bridges comprise 23.2 percent of the inventory but carry 72.6 percent of all daily traffic. Not surprisingly, urban structures are generally larger in terms of deck area as additional lanes are required to carry larger volumes of traffic. Urban structures constitute 52.5 percent of all total deck area on bridges in the inventory.
Exhibit 2-16 shows the relationship between the number of bridges, functional class, ADT carried, and deck area. The deck area for rural bridges is 47.5 percent versus 52.5 percent for urban bridges. The major difference is the amount of ADT carried by rural bridges versus urban bridges.
Urban Interstate bridges comprise 18.8 percent of the total bridge deck area of bridges on the Nation's roadway system but carry 34.7 percent of the ADT. Bridges on urban other freeways and expressways account for 9.3 percent of the total deck area and carry 14.7 percent of the ADT. Bridges on urban other principal arterials carry 11.7 percent of the ADT but have only 10.7 percent of the total deck area.
While the higher-order functional classifications (including rural and urban Interstate, other freeways and expressways, and other principal arterials) account for 133,215 bridges, 22.4 percent of the total bridges by number, they carry close to 78.3 percent of all daily traffic and account for approximately 56.3 percent of the deck area.
Bridges by Traffic Carried
Many bridges carry relatively low volumes of traffic on a typical day. Approximately 27 percent of these structures in terms of numbers have an ADT of 100 or less. Over 50 percent of bridges have an ADT lower than 700. Only 3 percent of bridges have an ADT higher than 50,000.
In terms of numbers of bridges, low-volume roadways are predominant. However, the high-volume structures have a significant impact on the user population. There are approximately 21,000 structures with ADT values in excess of 40,000 vehicle crossings daily. These structures are predominantly in urban environments (approximately 90 percent in terms of numbers, nearly 95 percent in terms of deck area). Over 95 percent of such bridges are located on Interstates or other principal arterials. Weighting the number of bridges by ADT values provides a mechanism for evaluating the impacts of the composition and conditions of bridges in terms of their impact on the highway user.
| Functional Class | Number of Bridges | % by Total Number. |
% of Total ADT |
% of Total Deck Area |
||
|---|---|---|---|---|---|---|
| Rural | ||||||
| Interstate | 27,648 | 4.7% | 10.6% | 8.0% | ||
| Other Principal Arterials | 36,259 | 6.1% | 6.7% | 9.4% | ||
| Minor Arterial | 40,197 | 6.8% | 3.8% | 6.6% | ||
| Major Collector | 94,079 | 15.8% | 3.7% | 9.8% | ||
| Minor Collector | 49,391 | 8.3% | 0.9% | 3.5% | ||
| Local | 208,641 | 35.1% | 1.6% | 10.1% | ||
| Rural Total | 456,215 | 76.8% | 27.4% | 47.5% | ||
| Urban | ||||||
| Interstate | 27,667 | 4.7% | 34.7% | 18.8% | ||
| Other Expressways | 17,112 | 2.9% | 14.7% | 9.3% | ||
| Other Principal Arterials | 24,529 | 4.1% | 11.7% | 10.7% | ||
| Minor Arterial | 24,802 | 4.2% | 6.9% | 7.0% | ||
| Collectors | 15,548 | 2.6% | 2.3% | 2.8% | ||
| Local | 27,940 | 4.7% | 2.3% | 3.7% | ||
| Urban Total | 137,598 | 23.2% | 72.6% | 52.5% | ||
| Unclassified | 288 | 0.0% | 0.0% | 0.1% | ||
| Total | 594,101 | 100.0% | 100.0% | 100.0% | ||
Bridges by Age
Peak periods of construction are seen mainly before World War II and during the Interstate construction era. The latter period saw an intense period of construction of bridges across the Nation. Half of all bridges in the country were built before 1964. The mean year of construction is approximately 1971 where structures are weighted by deck area. This indicates that recent structures tend to be larger than their older counterparts. This change is the result of design standards having improved and becoming stricter over time.
Bridges in the national inventory are, on average, 40 years old, with an average year of construction of 1964. Urban structures are slightly younger than rural structures, with an average year of construction of 1968. Comparing rural bridges across ownership classifications shows that State, local, and Federal owners have values within a few years of the mean for all rural bridges. Rural bridges owned by others, which are primarily private owners and railroads, are on average 10 years older than the general population. With urban bridges, State and locally owned bridges are slightly younger or slightly older than average, respectively. Federally owned urban bridges and urban structures owned by others are 5 to10 years older than State and local counterparts on average. It is important to note, however, that the number of bridges owned by Federal and other agencies is much smaller.
Considering functional classifications, only small variations are seen in the average age of construction between the owners. For all functional classifications and for all material types, the average year of construction is 1964 or 1965. This average is effectively equivalent for State, local, and Federal owners. There is also minimal variation between the functional classifications with average ages for all functional classifications for State, local, and Federal owners in the 1960s.
Bridges by Material
Superstructure material types are maintained in the NBI database for the main span and for the approach spans. Predominant materials used for bridge superstructures are steel, concrete, prestressed concrete, and timber. Other materials, such as aluminum, iron, and composite materials, are utilized on less than 1 percent of the structures. Bridges carrying Interstate, other principal arterial, and minor arterial routes are predominantly constructed of reinforced concrete, steel, and prestressed concrete. Timber superstructures and other materials become more significant within the population of bridges carrying collectors and local roadways.
Concrete and steel superstructure bridges on the Interstate are, on average, 35 to 40 years old. Prestressed designs were introduced more recently and have become the predominant superstructure material employed today, with over 50 percent of new structures employing prestressed concrete. Today, there are over 45,000 prestressed superstructure bridges carrying Interstates, other principal arterials, and minor arterials in the United States. There are also sizable numbers of prestressed concrete bridges carrying collector and local roadways. Bridges constructed of this material are, on average, 25 years old. The average age of timber superstructure bridges is approximately 45 years, while the average age of other materials is in excess of 65 years. Other materials are used on many older designs that used iron and masonry or on newer structures employing composites or other new materials.
Transit System Characteristics
System History
The first transit systems in the United States date to the middle of the 19th century. Initially, the Federal Government had little involvement in the public transit sector. Over time, however, leaders at all levels of government began to realize that developing and sustaining transit services was an important national, as well as local, concern. In 1964, Congress passed the Urban Mass Transportation Act, which generated an influx of Federal funding for transit systems. The Act also changed the character of the industry by specifying that Federal funds for transit were to be given to local or metropolitan-level public agencies, and not to private firms. This reinforced the already existing trend of transferring the ownership and operation of most transit systems in the United States from private to public hands. The Act also required local governments to contribute matching funds in order to receive Federal aid for transit services, setting the stage for the multi-level governmental partnerships that characterize the transit sector today.
State governments are also involved in the provision of transit services, generally through financial support and performance oversight. Thirty States have taxes dedicated to transit. In some cases, States have undertaken outright ownership and operation of transit services; five States—Connecticut, Delaware, Maryland, New Jersey, and Rhode Island—own and operate transit systems directly.
Several Federal initiatives from 1962 to 1965, in effect, mandated the creation of metropolitan planning organizations (MPOs) for each of the Nation's urbanized areas, although some of the nation's largest urbanized areas already had similar organizations. MPOs are composed of local and State officials and address the transportation planning needs of an urbanized area at a regional level. MPO coordination is now an essential prerequisite for Federal funding of many transit projects.
Given the wide array of combinations of governmental involvement in transit, transit agencies may take on a number of different forms. A transit provider may be a unit of a regional transportation agency; be run directly by the State, county, or city government; or be an independent agency with an elected or appointed Board of Governors. Transit operators may provide service directly with their own equipment or they may purchase transit services through an agreement with a contractor. All public transit services must be open to the general public without discrimination and meet the accessibility requirements of the Americans with Disabilities Act of 1990 (ADA).
System Infrastructure
Transit Agencies
In 2004, there were 640 active reporters in urbanized areas reporting to the National Transit Database (NTD), of which 600 were public agencies, including 6 State Departments of Transportation. Of the 640 active reporters, 93 received a reporting exemption for operating nine or fewer vehicles, or else received a temporary reporting waiver. The remaining 547 reporting agencies provided service on 1,042 different modal systems; 142 agencies operated a single mode and 405 transit agencies operated more than one mode. In 2000, the most recent year for which information is available, there were an additional 1,215 transit operators serving rural areas.
The Nation's motorbus and demand response systems are much more extensive than the Nation's rail transit system. In 2004, there were 468 motorbus systems and 438 demand response systems in urban areas, compared with 14 heavy rail systems, 19 commuter rail systems, and 27 light rail systems. While motorbus and demand response systems were found in every major urbanized area in the United States, only 31 urbanized areas had service on at least one of the three primary rail modes, including 11 urbanized areas with service on the heavy rail mode. In addition to these modes, there were 43 transit vanpool systems, 17 ferryboat systems, 4 trolleybus systems, 3 automated guideway systems, 3 inclined plane systems, and 2 jitney systems operating in urbanized areas of the United States and its territories. The transit statistics presented in this report also include the San Francisco Cable Car, the Seattle Monorail, the Roosevelt Island Aerial Tramway in New York, and the Alaska Railroad (which is a combination of long-distance passenger rail transportation, sightseeing services, and freight transportation services.)
|
|
|
What is demand response service, when is a demand response service considered to be transit, and who provides demand response service?
The term "demand response" refers to transit service dispatched directly in response to customer requests. Demand response services operate passenger cars, vans, or small buses without fixed routes or fixed schedules. Typically, a vehicle is dispatched to pick up multiple passengers at different locations before taking them to their respective destinations. A demand response system is considered to be part of the Nation's urban transit system (and hence neither a "taxi" system nor a "shared-ride shuttle" system) if the system is run by or under contract to a transit agency. Demand response vehicles are included as "regular vehicles" in Exhibit 2-17, both as rural service vehicles, and as vehicles in urbanized areas.
Demand response systems are commonly used to meet transit agencies' obligations under the Americans with Disabilities Act. Another less common form of demand response service, often called "Kiddie Cabs," provides service to schoolchildren. Demand response services for the general public may be provided in small towns, rural areas, and in some urban neighborhoods with limited transit demand.
The Federal Transit Administration (FTA) grants funding to some private organizations and certain private entities to provide demand response-type service to the elderly and those with disabilities. These "special services" are not included in the "demand response mode" and are discussed in the section at the end of this chapter.
|
|
|
|
What are the differences between heavy rail, light rail, and commuter rail?
There are three primary rail modes in the United States' transit system: heavy rail, light rail, and commuter rail.
Despite their names, the terms "heavy rail" and "light rail" do not refer to the weight of the rail equipment. Although the precise origins of the terms are not known, the most plausible explanation is that they refer to the level of passenger traffic that can be accommodated on the respective systems, with "heavy rail" systems carrying "heavy" passenger loads, and "light rail" systems carrying "light" passenger loads. Modern technologies, however, have somewhat blurred this distinction.
Heavy rail systems are electric railways that always operate on exclusive guideways. These systems usually have high platform loading and are typically powered by a third rail. Heavy rail trains are often six or more cars long to accommodate high passenger loads and are commonly called "metros," "rapids," or "subways" (although light rail trains may also operate occasionally in underground tunnels).
Light rail systems are electric railways that operate at least part of the time in a mixed guideway with foot and automobile traffic or have at least some at-grade crossings with foot and automobile traffic. These systems usually have low platform loading and are typically powered by overhead wires. Light rail trains are usually only one or two cars long and are often called "streetcars" or "trolleys."
Commuter rail systems typically operate on existing or retired freight rail tracks. These systems usually have low platform loading and are often powered by diesel engines (but may also be electric powered). Commuter rail systems provide service from outlying suburbs and small cities to a central downtown area, with only one or two stops in the central downtown area. A commuter rail system must get at least 50 percent of its traffic from persons using the system to commute between home and work at least three days a week to be considered a transit system (as opposed to an intercity rail system).
|
|
|
|
What are jitney, 'aiga bus, and público services?
Jitney systems use personal vehicles, typically passenger cars, modified light trucks, or vans, to provide frequent service on fixed or semi-fixed routes, but with few or no set stops, and typically without a fixed schedule. The vehicles may be owned or leased by the operator, and capacities vary from eight passengers to modified light trucks holding 30 or more passengers. There is only one jitney service in the incorporated areas of the United States, which has been operating in Laguna Beach, California, since 1914. A newspaper reporter coined the name "jitney" because the service charged a "jitney," or five cents, for a ride. "Público" is simply the name of the jitney service in San Juan, Puerto Rico, while " 'aiga bus" is the name of the jitney service that operates on Tutuila Island (the main island) in American Samoa ('aiga is the Samoan word for "family"). 'Aiga bus data are not reported to the NTD.
|
Transit Fleet
Exhibit 2-17 provides an overview of the nation's transit fleet in 2004 by type of vehicle. Although there is a strong correlation between some types of vehicles and certain modes, many vehicles, particularly small buses and vans, are used by different modes of transit. For example, vans may be used to provide vanpool, demand response, público, or motorbus services.
| Areas Over 1 Million in Population |
Areas Under 1 Million in Population |
Total | |
|---|---|---|---|
| Urbanized Area Regular Vehicles | |||
| Heavy Rail Vehicles | 10,965 | 0 | 10,965 |
| Self-Propelled Commuter Rail | 2,441 | 0 | 2,441 |
| Commuter Rail Passenger Cars | 3,361 | 78 | 3,439 |
| Commuter Rail Locomotives | 664 | 75 | 739 |
| Other Commuter Rail Vehicles 1 | 23 | 0 | 23 |
| Light Rail Vehicles | 1,564 | 101 | 1,665 |
| Busses | 49,043 | 19,746 | 68,789 |
| Other Motorbus Mode Vehicles 2 | 0 | 25 | 25 |
| Vans | 16,029 | 6,519 | 22,548 |
| Other Regular Vehicles 3 | 8,430 | 1,595 | 10,025 |
| Total Urbanized Area Regular Vehicles | 92,520 | 28,139 | 120,659 |
| Rural Service Regular Vehicles (2000)4 | 0 | 19,185 | 19,185 |
| Total Regular Vehicles | 92,520 | 47,324 | 139,844 |
| Special Service Vehicles 5 | 10,107 | 27,613 | 37,720 |
| Total Active Vehicles | 102,627 | 74,937 | 177,564 |
2 Vehicles reported for the motorbus mode, but not reported by vehicle type.
3 Includes aerial tramway vehicles, Alaska railroad vehicles, automated guideway vehicles, automobiles, cable cars, ferryboats, inclined plane vehicles, monorail vehicles, taxicabs, and trolleybuses. Also includes jitney and público vehicles other than busses or vans.
5 Source: FTA, Fiscal Year Trends Report on the Use of Section 5310 Elderly and Persons with Disabilities Program Funds, 2002.
|
|
|
What are the characteristics of the rural service vehicles and the special service vehicles listed in Exhibit 2-17?
Rural service vehicles are vehicles used for regular service that are owned by operators receiving funding from FTA as directed by Title 49—United States Code, Section 5311. These funds are for the provision of transit services in areas with populations of less than 50,000, and these transit operators do not currently report to the NTD.
Special service vehicles are vehicles that are used to provide service to the elderly and disabled, and receive funding from FTA as directed by Title 49—United States Code, Section 5310. Special service vehicle funding is directed toward private nonprofit organizations, although in certain cases specified by law, a public agency may be approved as a grantee. Special service vehicles are not included in the demand response mode (as defined in the first Q&A box in this section); recipients of funding for special service vehicles do not report to the NTD. In 2002 (the most recent year available) there were 16,219 special service vehicles in service purchased with FTA funds in both urban and rural areas.
There may be a few rare cases where a single agency receives both rural service vehicle funding and special service vehicle funding, resulting in a few cases of double-counting of vehicles. Additionally, both rural service and special service vehicles include vehicles in American Samoa, Guam, the Northern Marianas, and the Virgin Islands, which do not have urbanized area transit agencies that report to the NTD.
|
The Nation's transit system continues to grow. In 2004, urban transit systems, excluding special service providers, operated 120,659 vehicles compared with 114,564 vehicles in 2002, an increase of 5.3 percent. The Nation's transit fleet is primarily composed of buses, which in 2004 accounted for 57 percent of all regular service urban transit vehicles. Seventy-one percent of the buses were found in urbanized areas with more than 1 million people. Sixteen percent of regular urban transit vehicles were rail vehicles, of which 99 percent were found in urbanized areas with more than 1 million people.
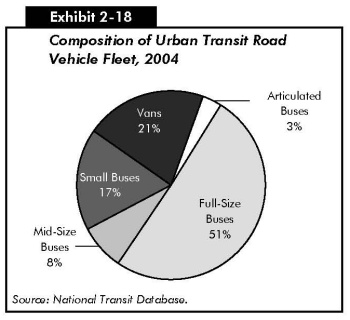
Exhibit 2-18 shows the composition of the Nation's urban transit road vehicle fleet in 2004. The most common type of vehicle is the full-size bus, comprising 51 percent of the fleet, followed by vans and small buses, comprising 21 percent and 17 percent of the fleet, respectively. Articulated buses account for about 3 percent of the total fleet. Overall, the Nation's urban transit road vehicle fleet has grown by 32 percent, which is just over 22,000 vehicles, since 1995. The largest component of growth in the Nation's urban transit road vehicle fleet between 1995 and 2004 has come from small-size buses, which have more than doubled in number since 1995. The number of full-size buses, by contrast, has remained nearly constant during that same time. For more information on the composition of the Nation's urban transit road vehicle fleet, please see Chapter 3.
The Nation's urban transit rail fleet consists primarily of heavy rail vehicles, light rail vehicles, self-propelled commuter rail vehicles, commuter rail locomotives, and commuter rail passenger coaches. In 2004, heavy rail vehicles accounted for 57 percent of the Nation's urban transit rail fleet, commuter rail vehicles for 34 percent, and light rail vehicles for 9 percent.
Track, Stations, and Maintenance Facilities
In 2004, there were 793 maintenance facilities for all transit modes in urban areas, compared with 769 in 2002. The number of light rail maintenance facilities increased from 32 in 2002 to 38 in 2004 and the number of heavy rail increased from 53 to 55. Over this same period, the number of bus maintenance facilities was unchanged at 516, while the number of demand response vehicle maintenance facilities increased from 91 to 103 [Exhibit 2-19].
| Areas Over 1 Million in Population |
Areas Under 1 Million in Population | Total | |
|---|---|---|---|
| Maintenance Facilities1 | |||
| Heavy Rail | 55 | 0 | 55 |
| Commuter Rail | 61 | 0 | 61 |
| Light Rail | 32 | 6 | 38 |
| Other Rail 2 | 3 | 4 | 7 |
| Motorbus | 281 | 235 | 516 |
| Demand Response | 32 | 72 | 103 |
| Ferryboat | 6 | 0 | 6 |
| Other Nonrail3 | 0 | 6 | 6 |
| Total Urban Maintenance Facilities | 470 | 323 | 793 |
| Rural Transit4 | 510 | 510 | |
| Total Maintenance Facilities | 470 | 833 | 1,303 |
2 Alaska railroad, automated guideway, cable car, inclined plane, and monorail.
3 Aerial tramway, jitney, and público.
4 Vehicles owned by operators receiving funding from FTA as directed by 49 USC Section 5311. These funds are for transit services in areas with populations of less than 50,000. (Section 5311 Status of Rural Public Transportation 2000, Community Transportation Association of America, April 2001.)
In 2004, transit providers operated 10,892 miles of track and served 2,961 stations, compared with 10,722 miles of track and 2,862 stations in 2002. The bulk of the increase in these transit track and station assets was for light rail service. Light rail track increased from 1,114 miles in 2002 to 1,321 miles in 2004, and the light rail stations increased from 640 to 723. The Nation's urban transit rail system infrastructure, however, continues to be dominated by commuter rail. In 2004, commuter rail systems accounted for 67 percent of transit track miles (7,284 miles) and 39 percent of transit rail stations (1,153). This reflects the longer distances generally covered by commuter rail. In 2004, heavy rail accounted for 20 percent (2,210 miles) of track miles and 35 percent of stations (1,023). Heavy rail typically operates in more densely developed areas than commuter rail, and thus has a higher ratio of stations to track miles [Exhibit 2-20].
| Urbanized Areas Over 1 Million in Population | Urbanized Areas Under 1 Million in Population | Total | |
|---|---|---|---|
| Track Mileage | |||
| Heavy Rail | 2,210 | 0 | 2,210 |
| Commuter Rail | 7,088 | 196 | 7,284 |
| Light Rail | 1,250 | 71 | 1,321 |
| Other Rail and Tramway * | 24 | 53 | 77 |
| Total Urbanized Area Track Mileage | 10,572 | 320 | 10,892 |
| Stations | |||
| Heavy Rail | 1,023 | 0 | 1,023 |
| Commuter Rail | 1,135 | 18 | 1,153 |
| Light Rail | 673 | 50 | 723 |
| Other Rail and Tramway * | 40 | 22 | 62 |
| Total Urbanized Area Transit Rail Stations | 2,871 | 90 | 2,961 |
System Coverage: Urban Directional Route Miles
The extent of the coverage of the Nation's transit system is measured in directional route miles, or simply "route miles." Route miles measure the distance covered by a transit route; transit routes that use the same road or track are counted twice. Route miles are not collected for demand response and vanpool modes, since these transit modes do not travel along specific predetermined routes. Route miles are also not collected for jitney services, since these transit modes often have highly variable route structures.
In the United States in 2004, 216,620 urban route miles were provided by nonrail and 9,782 urban route miles were provided by rail modes [Exhibit 2-21]. Bus modes, which cover a wider area than rail modes, accounted for 96 percent of urban route miles. Rail modes cover smaller areas, typically providing higher-frequency service on the same route and producing fewer directional route miles.
| Average Annual Rate of Change | ||||||||
|---|---|---|---|---|---|---|---|---|
| 1995 | 1997 | 1999 | 2000 | 2002 | 2004 | 2004 / 1995 | 2004 / 2002 | |
| Rail | 8,211 | 8,602 | 9,170 | 9,222 | 9,484 | 9,782 | 2.0% | 1.6% |
| Heavy Rail | 1,458 | 1,527 | 1,540 | 1,558 | 1,572 | 1,597 | 1.0% | 0.8% |
| Commuter Rail | 6,162 | 6,393 | 6,802 | 6,802 | 6,831 | 6,875 | 1.2% | 0.3% |
| Light Rail | 568 | 659 | 802 | 834 | 960 | 1,187 | 8.5% | 11.2% |
| Other Rail 1 | 24 | 24 | 27 | 29 | 122 | 123 | NA | 0.3% |
| Nonrail 2 | 187,757 | 185,164 | 195,985 | 196,858 | 225,820 | 216,620 | 1.6% | -2.1% |
| Motorbus | 186,856 | 184,248 | 195,022 | 195,884 | 224,838 | 215,571 | 1.6% | -2.1% |
| Ferryboat | 490 | 496 | 533 | 505 | 513 | 623 | 2.7% | 10.2% |
| Trolleybus | 412 | 420 | 430 | 469 | 468 | 425 | 0.4% | -4.7% |
| Total | 195,968 | 193,766 | 205,154 | 206,080 | 235,303 | 226,402 | 1.6% | -1.9% |
| Percent Nonrail | 95.8% | 95.6% | 95.5% | 95.5% | 96.0% | 95.7% | ||
2 Includes aerial tramway in 2004, with 1.2 directional route miles. Excludes demand response, jitney, público, and vanpool.
Total route miles increased at an average annual rate of 1.6 percent between 1995 and 2004, but decreased at an average annual rate of 1.9 percent between 2002 and 2004. This decline resulted from a drop in motorbus directional route miles, which account for the vast majority of total route miles. Reported motorbus miles reached a peak of 224,838 in 2002, declining to 215,571 in 2004. Rail route miles increased at an average annual rate of 2.0 between 1995 and 2004, and at a 1.6 percent average annual rate from 2002 to 2004. Light rail route miles have grown the most rapidly, reflecting new systems and extensions to existing systems that have become operational. Light rail route miles increased at an average annual rate of 8.5 percent between 1995 and 2004, accelerating to 11.2 percent from 2002 to 2004.
System Capacity
Transit system capacity, particularly in cross-modal comparisons, is typically measured by capacity-equivalent vehicle revenue miles (capacity-equivalent VRMs). Capacity-equivalent VRMs measure the distance traveled by transit vehicles in revenue service, adjusted by the passenger-carrying capacity of each transit vehicle type, with the average carrying capacity of motorbus vehicles representing the baseline.
Exhibit 2-22 provides VRMs, unadjusted by passenger-carrying capacity. These numbers are of interest because they show the actual number of miles traveled by each mode in revenue service. The shares of unadjusted VRMs provided by bus services and rail services were constant between 1995 and 2004. Nonrail modes accounted for 73 percent and rail modes accounted for 27 percent of unadjusted VRMs in 2004. As subsequent paragraphs will show, however, the share of VRMs on rail modes, adjusted for capacity, is considerably higher than the share when unadjusted for capacity.
| (Millions) | Average Annual Rate of Change | |||||||
|---|---|---|---|---|---|---|---|---|
| 1995 | 1997 | 1999 | 2000 | 2002 | 2004 | 2004 / 1995 | 2004 / 2002 | |
| Rail | 775 | 811 | 854 | 880 | 925 | 962 | 2.4% | 2.0% |
| Heavy Rail | 522 | 540 | 561 | 578 | 603 | 625 | 2.0% | 1.7% |
| Commuter Rail | 218 | 230 | 243 | 248 | 259 | 269 | 2.4% | 1.8% |
| Light Rail | 34 | 40 | 47 | 51 | 60 | 67 | 7.8% | 5.4% |
| Other Rail 1 | 2 | 2 | 2 | 2 | 3 | 2 | NA | -9.6% |
| Nonrail | 1,957 | 2,042 | 2,257 | 2,322 | 2,502 | 2,586 | 3.1% | 1.7% |
| Motorbus | 1,591 | 1,606 | 1,719 | 1,764 | 1,864 | 1,885 | 1.9% | 0.6% |
| Demand Response | 297 | 350 | 418 | 452 | 525 | 561 | 7.3% | 3.4% |
| Vanpool | 22 | 40 | 60 | 62 | 71 | 78 | 15.0% | 5.3% |
| Ferryboat | 2 | 2 | 2 | 2 | 3 | 3 | 4.9% | 5.4% |
| Trolleybus | 13 | 13 | 14 | 14 | 13 | 13 | -0.1% | -1.1% |
| Other Nonrail2 | 31 | 31 | 44 | 28 | 26 | 46 | 4.2% | 32.1% |
| Total | 2,732 | 2,853 | 3,111 | 3,202 | 3,427 | 3,548 | 2.9% | 1.8% |
| Percent Rail | 28.4% | 28.4% | 27.4% | 27.5% | 27.0% | 27.1% | ||
The 2004 capacity-equivalent factors for each mode are shown in Exhibit 2-23. Unadjusted VRMs for each mode are multiplied by a capacity-equivalent factor in order to calculate capacity-equivalent VRMs. These factors are equal to the average full-seating and full-standing capacities of vehicles in active service for each transit mode divided by the full-seating and full-standing capacities of all motorbus vehicles in active service. For vehicles that prohibit standing, as is the case of some commuter rail systems, standing capacity is assumed to be 0. The capacity-equivalent factors used in this report differ slightly from those in the 2004 C&P report. In this report, capacity-equivalent VRMs have been calculated by using a unique capacity-equivalent factor for each year based on the full-seating and full-standing capacities reported for that year to the NTD. The 2004 C&'P report used capacity-equivalent factors based on full-seating and full-standing capacities for an average of the last 3 years of the data used in that report.
| Base = Average Motorbus Vehicle Capacity | |||
|---|---|---|---|
| Automated Guideway | 1.4 | Jitney | 0.6 |
| Alaska Railroad | 0.3 | Light Rail | 2.7 |
| Cable Car | 0.8 | Motorbus | 1.0 |
| Commuter Rail | 2.5 | Monorail | 1.8 |
| Demand Response | 0.2 | Público | 0.3 |
| Ferryboat | 10.8 | Trolleybus | 1.5 |
| Heavy Rail | 2.5 | Aerial Tramway | 2.3 |
| Inclined Plane | 0.8 | Vanpool | 0.2 |
Since 1995, the capacity-equivalent factors of the major rail modes have increased significantly, largely as a result of increased standing capacity. Exhibit 2-24 shows the percentage change in seating, standing, and total capacity for the four largest transit modes since 1995. The average seating capacity for motorbus has declined in part through the addition of many more small buses to the motorbus fleet. At the same time, the capacity of rail mode vehicles has increased through the purchase of larger vehicles, and the removal of seats from existing vehicles for the expansion of standing capacity.
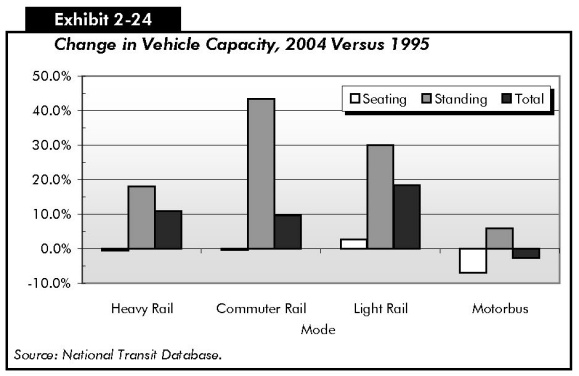
Total capacity-equivalent VRMs, are shown in Exhibit 2-25. Nonrail modes accounted for only 46 percent of capacity-equivalent VRMs, while rail modes accounted for 54 percent of capacity-equivalent VRMs. For all modes, capacity-equivalent VRMs increased at an average annual rate of 3.1 percent between 1995 and 2004, and 1.9 percent between 2002 and 2004. Rail capacity-equivalent VRMs increased at an average annual rate of 3.9 percent between 1995 and 2004 and 3.0 percent between 2002 and 2004. Among the rail modes, light rail capacity-equivalent VRMs have grown the most rapidly, increasing from 75 million capacity-equivalent VRMs in 1995 to 179 million capacity-equivalent VRMs in 2004, an average annual increase of 10.2 percent.
| (Millions) | Average Annual Rate of Change | |||||||
|---|---|---|---|---|---|---|---|---|
| 1995 | 1997 | 1999 | 2000 | 2002 | 2004 | 2004 / 1995 | 2004 / 2002 | |
| Rail | 1,706 | 1,801 | 1,936 | 2,046 | 2,274 | 2,413 | 3.9% | 3.0% |
| Heavy Rail | 1,135 | 1,183 | 1,247 | 1,321 | 1,469 | 1,546 | 3.5% | 2.6% |
| Commuter Rail | 493 | 522 | 572 | 595 | 652 | 685 | 3.7% | 2.5% |
| Light Rail | 75 | 92 | 114 | 127 | 150 | 179 | 10.2% | 9.4% |
| Other Rail1 | 3 | 4 | 4 | 3 | 3 | 3 | -2.6% | -12.7% |
| Nonrail | 1,689 | 1,720 | 1,862 | 1,908 | 2,037 | 2,064 | 2.3% | 0.7% |
| Motorbus | 1,591 | 1,606 | 1,719 | 1,764 | 1,864 | 1,885 | 1.9% | 0.6% |
| Demand Response | 46 | 56 | 72 | 76 | 100 | 101 | 9.1% | 0.5% |
| Vanpool | 4 | 8 | 11 | 11 | 15 | 15 | 14.4% | 1.5% |
| Ferryboat | 23 | 24 | 30 | 30 | 32 | 32 | 3.9% | 0.1% |
| Trolleybus | 17 | 19 | 19 | 20 | 20 | 20 | 1.7% | 0.6% |
| Other Nonrail2 | 8 | 8 | 11 | 7 | 7 | 12 | 4.6% | 31.3% |
| Total | 3,395 | 3,521 | 3,799 | 3,954 | 4,311 | 4,478 | 3.1% | 1.9% |
| Percent Rail | 50.3% | 51.1% | 51.0% | 51.7% | 52.8% | 53.9% | ||
2 Aerial tramway, jitney, and público; 99% or more of the "other nonrail" capacity-equivalent VRMs for each year are on público. Jitney was not reported in 2000. Aerial tramway was reported to the NTD for the first time in 2003 and 2004.
Capacity-equivalent VRMs for nonrail modes increased at an average annual rate of 2.3 percent between 1995 and 2004 and an average annual rate of 0.7 percent between 2002 and 2004. The most rapid expansion in capacity-equivalent VRMs has been for vanpools, growing from 4 million in 1995 to 15 million in 2004, at an average annual rate of 14 percent, for total growth of 235 percent.
|
|
|
What is vanpool service, and when is vanpool service considered to be transit?
A vanpool is considered to be part of the Nation's transit system if the vanpool is either run by or under contract to a transit agency.
Under a transit vanpool, the transit agency provides or leases a vehicle to a group of commuters, which due to certain tax benefits, is usually a van. One or more members of this group of commuters is trained and certified as a "primary driver" for the pool, and he or she then operates the van in regular service for the group of commuters between their homes and places of employment. Primary drivers typically pay a reduced fare or lease payment, or often pay nothing. Primary drivers also usually have limited use of the vehicle for personal trips.
|
The ADA spurred a rapid expansion of demand response capacity-equivalent VRMs, which increased at an average annual rate of 9 percent from 1995 to 2004, but slowed to an average increase of 0.5 percent from 2002 to 2004.
Ridership
There are two primary measures of transit ridership-unlinked passenger trips and passenger miles traveled (PMT). Passenger miles traveled are calculated on the basis of unlinked passenger trips and estimates of average trip length based on surveys. Either measure provides an appropriate time series since average trip lengths, according to mode, have not changed substantially over time. Cross-modal comparisons, however, may differ substantially depending on which measure is used.
|
|
|
What factors affect transit ridership?
Transit ridership is comprised of two segments, "transit-dependent riders" and "choice riders."
"Transit-dependent riders" are those riders without ready access to a personal vehicle. Many of these riders live in low-income households and cannot afford the expense of private vehicle ownership. Others chose to forego the costs of private vehicle ownership, as the local transit system provides sufficient mobility to workplaces, shopping centers, places of worship, and other activity centers. Transit-oriented development is a key factor in boosting transit-dependent ridership.
"Choice riders" are those who have access to a private vehicle, but choose to use transit based on the quality of transit service and the cost savings of using transit for the trip instead of a private vehicle. The quality of transit service depends upon numerous factors, including the frequency, reliability, and overall speed of service. Also important is whether the vehicles and transit stops are comfortable, clean, safe, and secure. Additionally, the ease of access to the route network and the clarity of the route network and schedule are important quality factors.
Transit ridership increases when transit provides a savings compared to a private vehicle in money, time, or both. Transit ridership will typically decrease after a fare increase, while transit ridership will often increase after an increase in gasoline prices or parking costs. Likewise, increasing congestion on roads and highways can boost transit ridership, particularly on modes with exclusive guideways, while adding stops in the middle of transit routes can cause ridership to decrease at outlying route points as the overall speed of service decreases.
A statistical analysis by FTA found a positive relationship between changes in employment in an area and transit use in the area. As approximately 50 percent of all transit trips are used to get to and from work, reduced unemployment in an area may boost transit ridership as more people in the area make daily trips to work. Additionally, total employment in an area typically rises concomitant with population growth, and increasing population in an area increases the overall market size available to transit. Research on the factors that affect transit ridership is ongoing; additional linkages are under examination, such as the connection between household income and transit ridership.
|
Exhibit 2-26 and Exhibit 2-27 show the distribution of unlinked passenger trips and PMT by mode. In 2004, there were 8.9 billion unlinked trips and 46.5 billion PMT. Fifty-six percent of unlinked trips were on motorbuses, 31 percent were on heavy rail, 5 percent were on commuter rail, and 4 percent each were on light rail and other. By comparison, 41 percent of PMT in 2004 were on motorbus, 31 percent were on heavy rail, 21 percent were on commuter rail, 3 percent were on light rail, and 4 percent were on other.
Exhibit 2-28 provides total PMT for selected years between 1995 and 2004. PMT increased at an average annual rate of 2.3 percent between 1995 and 2004, growing from 38 billion miles in 1995 to 46.5 billion miles in 2004. This rate of growth has slowed in recent years, averaging 0.7 percent between 2002 and 2004. PMT on all rail modes combined increased at an average annual rate of 3.0 percent between 1995 and 2004, twice the 1.5 percent average annual growth rate on all nonrail modes. As a result of this divergence, the share of PMT served by rail modes increased from 52 percent in 1995 to 55 percent in 2004.
The fastest growth in PMT has been on modes with low levels of ridership in 1995 and which have experienced rapid growth in capacity since then. PMT on vanpools grew the most rapidly between 1995 and 2004, at an average annual rate of 10.6 percent, as transit agencies expanded their offerings of this service to commuters. PMT on light rail also grew briskly, at an average annual rate of 7.0 percent between 1995 and 2004, as new light rail systems and extensions were opened. This rate slowed slightly to an average annual rate of 4.9 percent between 2002 and 2004, but remained well above the rate for other rail modes. PMT on demand response systems has also grown rapidly, increasing at an average annual rate of 6.6 percent between 1995 and 2004.
| (Millions) | Average Annual Rate of Change | |||||||
|---|---|---|---|---|---|---|---|---|
| 1995 | 1997 | 1999 | 2000 | 2002 | 2004 | 2004 / 1995 | 2004 / 2002 | |
| Rail | 19,682 | 21,138 | 22,875 | 24,603 | 24,616 | 25,668 | 3.0% | 2.1% |
| Heavy Rail | 10,559 | 12,056 | 12,902 | 13,844 | 13,663 | 14,354 | 3.5% | 2.5% |
| Commuter Rail | 8,244 | 8,037 | 8,764 | 9,400 | 9,500 | 9,715 | 1.8% | 1.1% |
| Light Rail | 859 | 1,024 | 1,190 | 1,340 | 1,432 | 1,576 | 7.0% | 4.9% |
| Other Rail1 | 21 | 21 | 19 | 20 | 22 | 22 | 0.7% | 0.6% |
| Nonrail | 18,288 | 19,042 | 20,404 | 20,498 | 21,328 | 20,878 | 1.5% | -1.1% |
| Motorbus | 17,024 | 17,509 | 18,684 | 18,807 | 19,527 | 18,921 | 1.2% | -1.6% |
| Demand Response | 397 | 531 | 559 | 588 | 651 | 704 | 6.6% | 4.0% |
| Vanpool | 185 | 310 | 413 | 407 | 455 | 459 | 10.6% | 0.4% |
| Ferryboat | 243 | 254 | 295 | 298 | 301 | 357 | 4.4% | 8.8% |
| Trolleybus | 187 | 189 | 186 | 192 | 188 | 173 | -0.9% | -4.0% |
| Other Nonrail 2 | 252 | 249 | 267 | 205 | 206 | 265 | 0.5% | 13.4% |
| Total | 37,971 | 40,180 | 43,279 | 45,101 | 45,944 | 46,546 | 2.3% | 0.7% |
| Percent Rail | 51.8% | 52.6% | 52.9% | 54.6% | 53.6% | 55.1% | ||
2 Aerial tramway, jitney, and público. 99% or more of the PMT for each year are on público. Jitney was not reported in 2000. Aerial tramway was reported to the NTD for the first time in 2003 and 2004.
Rural Transit Systems (Section 5311 Providers)
Rural operators are defined as those providing service outside urbanized areas or to areas with populations of less than 50,000. The information on rural systems presented here is taken from Status of Rural Public Transportation 2000, prepared for FTA and released in April 2001, which is the most recent data available on rural transit. This section has not been updated since the last edition of this report.
The Status of Rural Public Transportation 2000 report was based on a 1997 comprehensive listing of U.S. rural transit operators, compiled by the Institute for Economic and Social Measurement from State Departments of Transportation, and on surveys conducted by the Community Transportation Association of America (CTAA) for FTA in 1999 and 2000. A total of 108 rural transit operators responded to the 1999 survey, and a total of 50 operators responded to the 2000 survey. Although survey respondents provided information covering different 12 month periods, with commencement dates ranging from June 1997 to June 1999, the data sets were combined for purposes of analysis.
|
|
|
How are transit route miles and ridership in rural areas classified when they are associated with an agency that also operates in an urbanized area?
Transit agencies that operate in both urbanized and rural areas report data to the NTD for both areas combined. These combined data are included in NTD statistics for urbanized areas.
|
In 2000, there were 1,215 rural transit operators. While the number of rural transit providers had remained relatively constant since 1994, the year of the previous survey, fleet sizes expanded dramatically between 1994 and the most recent surveys undertaken in 1999 and 2000. The 150 providers that responded to a question on fleet size had an average fleet size of 17.5 vehicles, compared with an average fleet size of 11 vehicles in 1994, an increase of almost 50 percent. Correspondingly, the median fleet size in the most recent survey increased to 9 vehicles, compared with a median size of 6 vehicles in 1994. Total rural fleet size was estimated to have increased from 12,223 vehicles in 1994 to 19,185 vehicles in the most recent study.
The majority of rural transit operators' vehicles are vans (8 to 15 passengers) and small buses (16 to 24 passengers). According to the most recent survey, vans accounted for 54 percent of the rural fleet and small buses for 23 percent. Small vehicles (fewer than 8 passengers) accounted for 10 percent, medium buses (25 to 35 passengers) for 9 percent, and large buses (more than 35 passengers) for 4 percent.
Rural systems provide both traditional fixed-route and demand response services. About half of all rural transit providers offer various forms of route-deviation services. About 5 percent of rural systems also coordinate van and carpooling programs. Sixty percent of the rural fleet in the most recent survey was lift or ramp-equipped, compared with 40 percent in 1994.
Transit System Characteristics for Americans with Disabilities and the Elderly
The ADA is intended to ensure that persons with disabilities have access to the same facilities and services as other Americans, including transit vehicles and facilities. This equality of access is brought about through the upgrading of transit vehicles and facilities on regular routes, through the provision of demand response transit service for those individuals who are still unable to use regular transit service, and through special service vehicles operated by private entities and some public organizations, often with the assistance of FTA funding.
Since in the passage of the ADA in 1990, transit operators have been working to upgrade their regular vehicle fleets and improve their demand response services in order to meet the ADA's requirement to provide persons with disabilities a level of service comparable to the level provided to nondisabled persons using fixed-route systems. Department of Transportation (DOT) regulations provide minimum guidelines and accessibility standards for buses; vans; and heavy, light, and commuter rail vehicles. For example, commuter rail transportation systems are required to have at least one accessible car per train and all new cars must be accessible. The ADA deems it discriminatory for a public entity providing a fixed-route transit service to provide disabled individuals with services that are inferior to those provided to nondisabled individuals.
The percentage of transit vehicles that are ADA-compliant is increasing as old vehicles are retired and new vehicles are purchased with ADA compliance in mind. In 2004, 79 percent of all the transit vehicles reported to the NTD were ADA-compliant. This percentage is the same as in 2002, and is above the 73 percent reported for 2000. The percentage of vehicles compliant with the ADA for each mode is shown in Exhibit 2-29.
| Active Vehicles | ADA- Compliant Vehicles | ADA as a Percentage of Active Vehicles | |
|---|---|---|---|
| Rail Modes | |||
| Heavy Rail | 10,965 | 10,418 | 95% |
| Commuter Rail | 6,545 | 2,974 | 45% |
| Light Rail | 1,671 | 1,260 | 75% |
| Alaska Railroad | 97 | 30 | 31% |
| Automated Guideway | 51 | 51 | 100% |
| Cable Car | 40 | - | 0% |
| Inclined Plane | 8 | 6 | 75% |
| Monorail | 8 | 8 | 100% |
| Total Rail | 19,385 | 14,747 | 76% |
| Nonrail Modes | |||
| Motorbus | 62,416 | 61,222 | 98% |
| Demand Response | 27,919 | 18,409 | 66% |
| Vanpool | 5,549 | 222 | 4% |
| Ferryboat | 120 | 102 | 85% |
| Trolleybus | 617 | 544 | 88% |
| Tramway | 2 | 1 | 50% |
| Jitney | 10 | 8 | 80% |
| Público | 4,641 | - | 0% |
| Total Nonrail | 101,274 | 80,508 | 79% |
| All Modes | |||
| Total | 120,659 | 95,255 | 79% |
In addition to the services provided by urban transit operators, about 4,836 private and nonprofit agencies received FTA Section 5310 funding for the provision of "special" transit services (i.e., demand response) to persons with disabilities and the elderly. A recent survey by the University of Montana found that in 2002 there were 4,836 private and nonprofit agencies that received FTA Section 5310 funding, compared with 3,673 agencies reported by a Community Transportation Association of America (CTAA) survey in 1993. These providers include religious organizations, senior citizen centers, rehabilitation centers, the American Red Cross, nursing homes, community action centers, sheltered workshops, and coordinated human services transportation providers.
In 2002, the most recent year for which data are available, these providers were estimated to be using 37,720 special service vehicles. Approximately 62 percent of these special service providers were in rural areas, and 38 percent were in urbanized areas. Data collected by FTA show that approximately 76 percent of the vehicles purchased in FY 2002 were wheelchair accessible, about the same as in the previous few years.
In 2004, 70 percent of total transit stations were ADA-compliant. The NTD began collecting data on the ADA compliance of transit stations in 2002, and it has taken some time to ensure that this information is correctly reported. Therefore, data on total station compliance provided in previous reports may not be directly comparable to data provided in this report, due to improvements in reporting quality. The ADA requires that new transit facilities and alterations to existing facilities be accessible to the disabled [Exhibit 2-30].
| Total Stations | ADA- Compliant Stations | Percentage of Stations ADA Compliant | |
|---|---|---|---|
| Rail Modes | |||
| Heavy Rail | 1,023 | 428 | 42% |
| Commuter Rail | 1,153 | 666 | 58% |
| Light Rail | 723 | 589 | 81% |
| Alaska Railroad | 10 | 10 | 100% |
| Automated Guideway | 42 | 41 | 98% |
| Inclined Plane | 8 | 7 | 88% |
| Monorail | 2 | 2 | 100% |
| Total Rail | 2,961 | 1,743 | 59% |
| Nonrail Modes | |||
| Motorbus | 1,180 | 1,158 | 98% |
| Ferryboat | 70 | 65 | 93% |
| Trolleybus | 10 | 10 | 100% |
| Aerial Tramway | 2 | 1 | 50% |
| Total Nonrail | 1,262 | 1,234 | 98% |
| All Modes | |||
| Total | 4,223 | 2,977 | 70% |
Under the ADA, FTA was given responsibility for identifying "key rail stations" and facilitating the accessibility of these stations to disabled persons by July 26, 1993. Key rail stations are identified on the basis of the following criteria:
- The number of passengers boarding at the key station exceeds the average number of passengers boarding on the rail system as a whole by at least 15 percent.
- The station is a major point where passengers shift to other transit modes.
- The station is at the end of a rail line, unless it is close to another accessible station.
- The station serves a "major" center of activities, including employment or government centers, institutions of higher education, and major health facilities.
Although ADA legislation required all key stations to be accessible by July 26, 1993, the DOT ADA regulation in Title 49—Code of Federal Regulations (CFR), Part 37.47(c)(2), permitted the FTA Administrator to grant extensions up to July 26, 2020, for stations requiring extraordinarily expensive structural modifications to bring them into compliance. In 2004, there were 687 key rail stations, of which 69 were under FTA-approved time extensions. The total number of key rail stations has changed slightly over the years as certain stations have merged or closed and as other key rail stations have opened.
Of the 618 identified key rail stations not under an FTA-approved time extension, 291 stations, or 47 percent, were ADA-compliant in 2004. As recently as 2000, only 52 key rail stations (about 8 percent) were ADA-compliant. In the 2002 edition of this report, 423 key rail stations were reported as being compliant, based upon self-certification of ADA compliance by the transit agencies themselves. The decrease in reported ADA compliance from 2002 to 2004 is a result of FTA efforts to verify the ADA compliance of these stations and, in some cases, to require additional modifications to the station in order to meet the requirements of the ADA.