- Summary
- Highways and Bridges
- Transit
- Highway and Bridge Finance
- Revenue Sources
- Historical Revenue Trends
- Highway Expenditures
- Types of Highway Expenditures
- Historical Expenditure and Funding Trends
- Constant Dollar Expenditures
- Constant Dollar Expenditures per VMT
- Highway Capital Outlay Expenditures
- Capital Outlay by Improvement Type
- Constant Dollar Expenditures by Improvement Type
- Transit Finance
- Transit Funding
- Level and Composition of Transit Funding
- Federal Funding
- State and Local Funding
- Level and Composition of System-Generated Funds
- Trends in Public Funding
- Funding in Current and Constant Dollars
- Capital Funding and Expenditures
- Operating Expenditures
- Operating Expenditures by Transit Mode
- Operating Expenditures by Type of Cost
- Operating Expenditures per Vehicle Revenue Mile
- Operating Expenditures per Passenger Mile
- Farebox Recovery Ratios
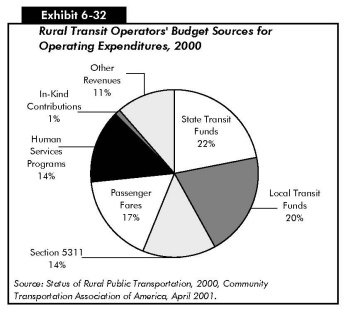
- Rural Transit
Summary
Exhibit 6-1 compares the key highway and transit statistics discussed in this chapter with the values shown in the last report. The first data column contains the values reported in the 2004 C&P report, which were based on 2002 data. Where the 2002 data have been revised, updated values are shown in the second column. The third column contains comparable values, based on 2004 data.
| 2002 Data | |||
|---|---|---|---|
| Statistic | 2004 C&P Report | Revised | 2004 Data |
| Total Funding for Highways (all govts.) | $134.8 bil | $145.3 bil | |
| Total Funding for Transit | $36.5 bil | $39.5 bil | |
| Total Public Funding for Transit | $26.6 bil | $28.4 bil | |
| Percent of Public Funding for Transit Funded by Federal Government | 23.7% | 24.3% | |
| Total Highway Expenditures (all govts.) | $135.9 bil | $147.5 bil | |
| Percent of Total Highway Expenditures Funded by Federal Government | 24.1% | 22.6% | |
| Total Highway Capital Outlay (all govts.) | $68.2 bil | $70.3 bil | |
| Percent of Total Highway Capital Outlay Funded by Federal Government | 46.1% | 43.8% | |
| Percent of Total Highway Capital Outlay Used for System Rehabilitation | 52.6% | 51.8% | |
| Total Transit Capital Outlay | $12.3 bil | $12.6 bil | |
| Percent of Total Transit Capital Outlay Funded by Federal Government | 40.6% | 39.0% | |
| Percent of Total Transit Capital Outlay Used for Rail | 71.0% | 70.0% | |
| Total Highway-User Revenues (motor-fuel and vehicle taxes and tolls) | $100.5 bil | $100.5 bil | $106.8 bil |
| Highway-User Revenues Used for Roads | $79.6 bil | $83.0 bil | |
| Total Transit Fares and Other System-Generated Revenue | $9.9 bil | $9.1 bil | |
Note that this chapter focuses on traditional revenue sources that supply most of the funding to support highways and bridges, other sources are playing an increasingly critical role in highway finance. The Innovative Finance section included in Chapter 6 of the 2004 C&P report has been expanded and moved to a stand-alone chapter. See Chapter 13 for information on public-private partnerships, as well as various Federal credit assistance programs.
Highways and Bridges
All levels of government generated $145.3 billion in 2004 to be used for highways and bridges. In addition to this total, $2.2 billion was drawn from reserves, so cash outlays for highways and bridges in 2004 totaled $147.5 billion, an increase of 8.5 percent compared to 2002. Highway expenditures grew more quickly than inflation over this period, rising 3.6 percent in constant dollar terms (based on the FHWA Construction Bid Price Index for highway capital outlay and the Consumer Price Index [CPI] for all other types of highway expenditures). Since 2002, highway capital expenditures by all levels of government grew 3.1 percent to $70.3 billion in 2004. The Federal government contributed $30.8 billion (43.8 percent) of total highway capital expenditures.
In 2004, 51.8 percent of highway capital outlay was used for system rehabilitation, down from 52.6 percent in 2002. Highway user revenues (the total amount generated from motor-fuel taxes, motor-vehicle taxes and fees, and tolls imposed at the Federal, State, and local level) rose from $100.5 billion in 2002 to $106.8 billion in 2004. Of this total, $83.0 billion (77.7 percent) was used for highway programs.
|
|
|
How was the $30.8 billion figure for Federal contributions to total highway capital expenditures derived, and why does this figure differ from amounts that appear in other documents (e.g., the President's Budget)?
The Federal expenditures shown in this report are intended to reflect the highway-related activities of all Federal agencies, rather than just those of the traditional transportation agencies such as FHWA. The figures shown in this report tie back to Tables HF 10 and HF-10A in Highway Statistics, which in turn are linked to Tables FA-5 and FA-5R, which list highway expenditures on an agency-by-agency basis at the Federal level. These data represent cash outlays, rather than obligations (which are more relevant in terms of the annual Federal budget) or authorizations (which are more relevant in terms of multiyear authorization bills). Since the financial data reported by State and local governments are compiled on a cash basis, this report uses the same basis for Federal expenditures to ensure consistency.
The Federal figures reported in Table FA-5 rely on data from a mix of Federal, State, and local sources. In some cases, this table captures Federal funding for highways that are not otherwise tracked at the Federal level. For example, under current law, 25 percent of the receipts derived from Federal timber sales are to be paid to States for public roads and schools in the counties where forests are situated. At the time these payments are made, it is unknown what portion will ultimately be used for roads as opposed to schools. However, once States have expended these funds, they are able to report to the FHWA what portion was used for roads, so that this information may be included in Table FA-5.
Note that the Federal highway funding figures in this report exclude any amounts funded from the Highway Account of the Federal HTF that were used for transit purposes as identified in Table HF-10. Such amounts would appear as Federal funding for transit in this report.
The $30.8 billion figure cited for the Federal contribution to total capital expenditures represents total Federal expenditures for highway purposes of $33.1 billion, less direct Federal expenditures for noncapital purposes such as maintenance on Federally owned roads, administrative costs, and research.
|
Transit
In 2004, $39.5 billion was available from all sources to finance transit investment and operations compared with $36.5 billion in 2002. Transit funding comes from two major sources: public funds allocated by Federal, State, and local governments; and system-generated revenues earned for the provision of transit services. In 2004 Federal funding was $7.0 billion (18 percent of total transit funds), State funding was $7.8 billion (20 percent of total transit funds, local funding was $13.7 billion (35 percent of total transit funds), and system-generated revenues were $11.1 billion (28 percent of total transit funds). Between 2002 and 2004 total Federal funding increased by 10.5 percent, total State and local funding increased by 6.5 percent, and total system-generated revenues by 12.1 percent.
Funding for capital investments by transit operators in the United States comes principally from public sources. Capital investments include the design and construction of new transit systems and extensions to current systems (also know as "New Starts") and the modernization of existing fixed assets. In 2004, total public transit agency expenditures for capital investment were $12.6 billion in current dollars (compared with $12.3 billion in current dollars in 2002) and accounted for 32 percent of total available funds. Federals funds were $4.9 billion (compared with $5.0 billion in 2002), State funds were $1.8 billion (compared with $1.4 billion in 2002), and local funds were $5.9 billion (the same as in 2002). The share of capital funds from Federal sources fell from 40.6 percent in 2002 to 39.0 percent in 2004.
Transit operating expenditures include wages, salaries, fuel, spare parts, preventive maintenance, support services, and leases used in providing transit service. In 2004, $26.9 billion was available for operating expenses (compared with $24.4 billion in 2002) and accounted for 68 percent of total available funds. Of this amount, $2.0 billion was provided by the Federal government (compared with $1.3 billion in 2002), 6.0 billion was provided by State governments (compared with $6.1 billion in 2002), $7.9 billion by local governments (compared with $6.9 billion in 2002), and $10.9 billion by system-generated revenues (compared with $9.9 billion in 2002). In 2004, transit operators' actual operating expenditures were $25.4 billion compared with $22.9 billion in 2002, a total increase of 11 percent.
The Federal share of funds for operating expenses increased from 5.4 percent in 2002 to 7.5 percent in 2004. Transit agencies in 56 urbanized areas that were slated to lose their eligibility to use Federal formula funding to finance transit operations starting in FY 2002 (as a result of being reclassified as urbanized areas with populations over 200,000) were allowed to continue to as a result of the Transit Operating Flexibility Act passed in September 2002. Under SAFETEA-LU, these transit agencies may continue to use formula funds for operating expenses in FY 2005 at 100 percent of their FY 2002 apportionment, in FY 2006 at 50 percent of their FY 2002 apportionment, and in FY 2007 at 25 percent of their FY 2002 apportionment.
Highway and Bridge Finance
This section presents information on the revenue sources that support public investment in highways and bridges and on the various types of investments that are being made by all levels of government. This is followed by a discussion of the current and historic roles of Federal, State, and local governments in highway funding. The section concludes with a more detailed analysis of capital expenditures.
While this chapter focuses on the traditional revenue sources that supply most of the funding to support highways and bridges, other sources are playing an increasingly critical role in highway finance. See Chapter 13 for a discussion of public private partnerships, as well as various Federal credit assistance programs.
Note that private sector investment in highways would generally show up in the "miscellaneous income" category in the tables in this section, to the extent such investment is captured in State and local accounting systems.
Revenue Sources
As shown in Exhibit 6-2, $145.3 billion was generated by all levels of government in 2004, to be used for highways and bridges. Actual cash expenditures in 2004 for highways and bridges were higher, totaling $147.5 billion; the difference of $2.2 billion drawn from reserves by various governmental units. The $2.2 billion shown as drawn from reserves in the Federal column indicates that the cash balance of the Highway Account of the Federal Highway Trust Fund (HTF) declined by that amount during 2004. The combined amount placed in reserves by States was less than $50 million, as was the estimated combined amount drawn from reserves by local governments. Both amounts round to the $0.0 billion shown in the State and local columns.
| Federal | State | Local | Total | Percent | |
|---|---|---|---|---|---|
| User Charges | |||||
| Motor-fuel Taxes | 25.5 | 29.2 | 1.1 | 55.7 | 38.30% |
| Motor-vehicle Taxes and Fees | 3.1 | 16.8 | 0.9 | 20.8 | 14.30% |
| Tolls | 0 | 5.6 | 0.9 | 6.6 | 4.50% |
| Subtotal | 28.6 | 51.6 | 2.9 | 83 | 57.10% |
| Other | |||||
| Property Taxes and Assessments | 0 | 0 | 7.5 | 7.5 | 5.10% |
| General Fund Appropriations | 2 | 4.8 | 16.8 | 23.6 | 16.20% |
| Other Taxes and Fees | 0.3 | 3.5 | 4.1 | 7.9 | 5.50% |
| Investment Income and Other Receipts | 0 | 2.6 | 4.9 | 7.6 | 5.20% |
| Bond Issue Proceeds | 0 | 10.4 | 5.4 | 15.8 | 10.90% |
| Subtotal | 2.4 | 21.3 | 38.7 | 62.3 | 42.90% |
| Total Revenues | 30.9 | 72.9 | 41.5 | 145.3 | 100.00% |
| Funds Drawn from or (Placed in) Reserves | 2.2 | 0 | 0 | 2.2 | 1.50% |
| Total Expenditures Funded During 2004 | 33.1 | 72.8 | 41.6 | 147.5 | 101.50% |
Highway-user charges, including motor-fuel taxes, motor-vehicle taxes and fees, and tolls, were the source of 57.1 percent of the $145.3 billion of total revenues for highways and bridges in 2004. The remaining 42.9 percent of revenues came from a number of sources, including local property taxes and assessments, other dedicated taxes, general funds, bond issues, investment income, and other miscellaneous sources. Development fees and special district assessments are included under "Investment Income and Other Receipts" in Exhibit 6-2.
|
|
|
Were all revenues generated by motor-fuel taxes, motor-vehicle taxes and fees, and tolls in 2004 used for highways?
No. The $83.0 billion identified as highway-user charges in Exhibit 6-2 represents only 78.4 percent of total highway-user revenue, defined as all revenue generated by motor-fuel taxes, motor-vehicle taxes, and tolls. Exhibit 6-3 shows that combined highway-user revenue collected in 2004 by all levels of government totaled $105.8 billion.
In 2004, $10.7 billion of highway-user revenue was used for transit, and $13.1 billion was used for other purposes, such as ports, schools, collection costs, and general government activities. The $0.3 billion shown as Federal highway-user revenue used for other purposes reflects the difference between total collections in 2004 and the amounts deposited into the HTF during FY 2004. Much of this difference is attributable to the proceeds of 0.1 cent of the motor-fuel tax being deposited into the Leaking Underground Storage Tank trust fund.
The $5.9 billion shown as Federal highway-user revenue used for transit includes $4.8 billion deposited into the Transit Account of the HTF, as well as $1.1 billion that was deposited in the Highway Account of the HTF that States elected to use for transit purposes. Flexible funding provisions that allow States to reprogram certain highway funds for transit purposes are discussed in the "Transit Finance" section of this chapter.
|
| Portion used for: | Federal | State | Local | Total |
|---|---|---|---|---|
| Highways | 28.6 | 51.6 | 2.9 | 83.0 |
| Transit | 5.9 | 3.7 | 1.1 | 10.7 |
| Other | 0.3 | 11.6 | 0.1 | 12.1 |
| Total Collected | 34.8 | 66.9 | 4.1 | 105.8 |
The degree to which highway programs are funded by highway-user charges differs widely among the different levels of government. At the Federal level, 92.4 percent of highway revenues came from motor-fuel and motor vehicle taxes in 2004. The remainder came from general fund appropriations, timber sales, lease of Federal lands, oil and mineral royalties, and motor carrier fines and penalties.
Highway-user charges also provided the largest share, 70.8 percent, of highway revenues at the State level in 2004. Bond issue proceeds were another significant source of funding, providing 14.3 percent of highway funds at the State level. The remaining 14.9 percent of State highway funding came from general fund appropriations, other State taxes and fees, investment income, and other miscellaneous revenue sources.
Many States do not permit local governments to impose motor-fuel and motor-vehicle taxes, or they cap them at relatively low levels. Therefore, at the local government level, only 6.9 percent of highway funding was provided by highway-user charges in 2004. Local general funds, property taxes, and other taxes and fees were the sources of 68.3 percent of local highway funding. Bond issue proceeds provided 13.0 percent of local highway funding, while investment income and miscellaneous receipts provided the remaining 11.9 percent.
Historical Revenue Trends
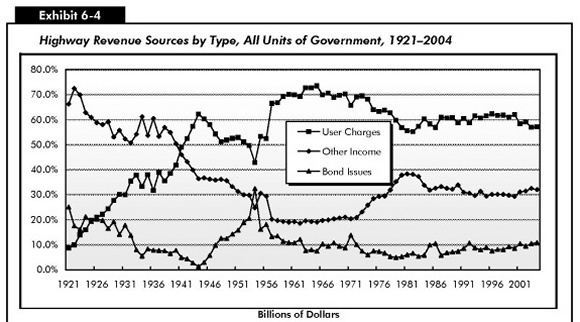
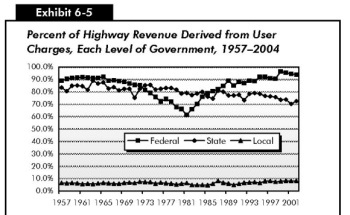
Exhibits 6-4 and 6-5 show how highway revenue sources have varied over time. Exhibit 6-4 identifies the different sources of highway revenue since 1921 for all levels of government combined. Exhibit 6-5 identifies the percentage of highway revenue derived from user charges by each level of government since 1957. Some of the variation in revenue sources shown in the graph portion of Exhibit 6-4 is caused by changes in the share of funding provided by each level of government over time; this topic will be discussed later in this chapter. In the early 1920s, when local government bore much of the responsibility for highway funding, property taxes were the primary source of revenues for highways. Property taxes have, however, become a much less significant source of revenue over time. In 1999, property taxes dropped to an all-time low of 4.8 percent of total highway revenue and remained at roughly that level through 2002; in 2003, property taxes began to climb slightly, reaching 5.1 percent of total highway revenues in 2004. The share of total highway revenues generated by bond proceeds has fluctuated over time, reaching a high of 32.4 percent in 1954. Since that time, combined highway and bridge programs have become less dependent on debt financing; this share has not exceeded 11 percent of revenues since 1971.
| Billions of Dollars | ||||||||
|---|---|---|---|---|---|---|---|---|
| Year | Fuel and Vehicle Taxes |
Tolls | Property Taxes | General Fund Approps. |
Other Taxes and Fees |
Investment Income and Other |
Issue Proceeds |
Total |
| 1921 | $0.1 | $0.0 | $0.7 | $0.1 | $0.0 | $0.1 | $0.4 | $1.4 |
| 1925 | 0.4 | 0.0 | 0.9 | 0.2 | 0.0 | 0.0 | 0.4 | 2.0 |
| 1929 | 0.7 | 0.0 | 1.2 | 0.2 | 0.0 | 0.0 | 0.5 | 2.7 |
| 1933 | 0.7 | 0.0 | 0.6 | 0.4 | 0.0 | 0.0 | 0.2 | 1.9 |
| 1937 | 1.0 | 0.0 | 0.4 | 1.0 | 0.0 | 0.0 | 0.2 | 2.7 |
| 1941 | 1.2 | 0.1 | 0.4 | 0.8 | 0.0 | 0.0 | 0.1 | 2.6 |
| 1945 | 1.1 | 0.1 | 0.3 | 0.4 | 0.0 | 0.0 | 0.1 | 1.9 |
| 1949 | 2.1 | 0.1 | 0.4 | 1.0 | 0.0 | 0.1 | 0.5 | 4.3 |
| 1953 | 3.1 | 0.2 | 0.6 | 1.2 | 0.0 | 0.2 | 1.3 | 6.5 |
| 1957 | 5.6 | 0.4 | 0.8 | 0.7 | 0.0 | 0.2 | 1.2 | 9.0 |
| 1961 | 7.7 | 0.5 | 0.9 | 1.0 | 0.1 | 0.3 | 1.3 | 11.8 |
| 1965 | 9.8 | 0.7 | 1.1 | 1.1 | 0.2 | 0.4 | 1.1 | 14.3 |
| 1969 | 13.0 | 0.9 | 1.3 | 1.9 | 0.3 | 0.6 | 1.9 | 19.9 |
| 1973 | 17.0 | 1.2 | 1.5 | 3.0 | 0.4 | 1.1 | 2.0 | 26.2 |
| 1977 | 19.6 | 1.4 | 1.8 | 5.4 | 0.8 | 1.8 | 2.2 | 33.0 |
| 1981 | 21.8 | 1.8 | 2.5 | 8.8 | 1.4 | 3.7 | 2.6 | 42.5 |
| 1985 | 33.6 | 2.2 | 3.5 | 9.9 | 1.9 | 4.3 | 6.1 | 61.4 |
| 1989 | 41.4 | 2.9 | 4.3 | 10.8 | 2.9 | 5.5 | 5.2 | 72.8 |
| 1993 | 50.8 | 3.6 | 4.7 | 10.6 | 4.0 | 6.8 | 7.8 | 88.4 |
| 1995 | 55.4 | 3.9 | 4.9 | 13.2 | 3.7 | 6.6 | 8.6 | 96.3 |
| 1997 | 61.6 | 4.7 | 5.3 | 15.1 | 5.0 | 7.0 | 8.8 | 107.4 |
| 1998 | 64.3 | 4.7 | 5.8 | 14.5 | 5.1 | 8.2 | 9.0 | 111.6 |
| 1999 | 69.1 | 5.1 | 5.8 | 17.2 | 6.4 | 6.8 | 11.3 | 121.7 |
| 2000 | 75.6 | 5.7 | 6.1 | 19.3 | 5.7 | 7.3 | 11.3 | 131.1 |
| 2001 | 71.8 | 5.9 | 6.3 | 19.1 | 8.0 | 8.0 | 14.0 | 133.1 |
| 2002 | 73.1 | 6.6 | 6.5 | 20.3 | 7.5 | 8.1 | 12.7 | 134.8 |
| 2003 | 73.3 | 5.9 | 7.2 | 21.8 | 8.8 | 7.5 | 14.7 | 139.2 |
| 2004 | 76.4 | 6.6 | 7.5 | 23.6 | 7.9 | 7.6 | 15.8 | 145.3 |
Since the passage of the Federal-Aid Highway Act of 1956 and the establishment of the Federal HTF, motor-fuel and motor-vehicle tax receipts have consistently provided a majority of the combined revenues raised for highway and bridge programs by all levels of government.
After peaking at an all-time high of 73.5 percent of highway revenues in 1965, the share represented by highway-user charges dropped to 55.2 percent in 1982. As shown in Exhibit 6-4, until 2000, the percentage had rebounded and stabilized in a range of about 60 to 62 percent. Since 2001, it has been slightly below 60 percent, ranging from 57 to 59 percent.
A corresponding pattern can be observed in the percentage of Federal highway revenue derived from highway-user charges as shown by the Federal line in Exhibit 6-5. During the early years of the HTF, over 90 percent of highway revenues at the Federal level came from fuel and vehicle taxes. From the late 1960s to early 1980s, this percentage declined, to a low of 61.6 percent in 1981. During this period, Federal motor-fuel taxes did not increase, and a growing percentage of Federal highway funding came from other sources. In 1981, general fund revenues of $2.6 billion provided 25.1 percent of total Federal highway funding. Since 1981, Federal motor-fuel taxes have increased significantly, and Federal general fund revenues used for highways have declined. As a result, the portion of Federal highway revenue derived from highway-user charges increased, reaching an all-time high of 96.4 percent in 1999. Since then, however, the share of Federal funding generated by highway-user charges have begun to decrease, dropping to 92.4 percent in 2004.
| Year | Federal | State | Local | Total |
|---|---|---|---|---|
| 1957 | 89.0% | 83.5% | 6.5% | 66.5% |
| 1961 | 92.1% | 84.7% | 5.7% | 69.9% |
| 1965 | 92.4% | 87.7% | 6.5% | 73.5% |
| 1969 | 88.1% | 82.5% | 6.5% | 69.8% |
| 1973 | 81.6% | 85.3% | 7.3% | 69.5% |
| 1977 | 74.3% | 83.2% | 6.4% | 63.8% |
| 1981 | 61.5% | 79.1% | 6.4% | 55.6% |
| 1985 | 78.8% | 76.2% | 4.7% | 58.3% |
| 1989 | 89.0% | 77.2% | 6.1% | 60.7% |
| 1993 | 89.0% | 78.5% | 6.9% | 61.6% |
| 1995 | 92.1% | 78.5% | 6.6% | 61.6% |
| 1997 | 91.0% | 76.3% | 8.1% | 61.7% |
| 1998 | 90.7% | 75.9% | 7.5% | 61.8% |
| 1999 | 96.4% | 73.6% | 7.9% | 61.0% |
| 2000 | 95.5% | 73.9% | 8.3% | 62.0% |
| 2001 | 94.6% | 70.3% | 8.1% | 58.4% |
| 2002 | 93.9% | 72.6% | 8.2% | 59.1% |
| 2003 | 92.8% | 70.0% | 7.0% | 56.9% |
| 2004 | 92.4% | 70.8% | 6.9% | 57.1% |
Exhibit 6-5 shows that the share of State government highway funding contributed by highway-user charges has generally declined over time. From 1997 to 2004, the percentage dropped from 76.3 percent to 70.8 percent. Over the same period, States grew more reliant on debt financing, as bond proceeds grew from 8.6 percent to 14.3 percent of State government highway funding.
Highway-user charges have never been as significant a source of highway revenue at the local government level as at the Federal or State levels, for the reasons outlined earlier. In recent years, the share of local government highway funding derived from highway-user charges has been slightly higher than it was historically, exceeding 8 percent each year from 2000 to 2002, before dropping to 7 percent in each of 2003 and 2004.
|
|
|
Why did the percentage of Federal revenue for highways derived from the highway-user charges increase sharply between 1998 and 1999?
In 1998, 4.8 percent of total Federal revenues for highways came from interest income credited to the Highway Account of the HTF based on its invested balance. Due to a legislative change, starting in FY 1999, the HTF no longer earns interest on its balances. With this revenue source eliminated, the Federal highway program now relies even more heavily on motor-fuel and motor-vehicle taxes for funding.
|
Highway Expenditures
Exhibit 6-2 indicates that total expenditures for highways in 2004 equaled $147.5 billion and identifies the portion of this total funded by each level of government. Exhibit 6-6 classifies this total by type of expenditure and by the level of government. The "Federal," "State," and "Local" columns in this table indicate which level of government made the direct expenditures, while "Funded by…" in the column "Current Expenditures" indicates the level of government that provided the funding for those expenditures. (Note that all amounts cited as "expenditures," "spending," or "outlays" in this report represent cash expenditures rather than authorizations or obligations.)
| Federal | State | Local | Total | Percent | |
|---|---|---|---|---|---|
| Capital Outlay | $1.2 | $50.9 | $18.2 | $70.3 | 47.6% |
| Funded by Federal Government** | 1.2 | 28.4 | 1.2 | 30.8 | 20.9% |
| Funded by State or Local Govt's* | 0.0 | 22.5 | 17.0 | 39.5 | 26.8% |
| Noncapital Expenditures | |||||
| Maintenance | 0.2 | 9.8 | 17.4 | 27.3 | 18.5% |
| Highway and Traffic Services | 0.0 | 4.7 | 4.3 | 9.0 | 6.1% |
| Administration | 2.1 | 6.6 | 4.1 | 12.7 | 8.6% |
| Highway Patrol and Safety | 0.0 | 7.4 | 6.9 | 14.3 | 9.7% |
| Interest on Debt | 0.0 | 4.0 | 1.9 | 5.8 | 3.9% |
| Subtotal | $2.3 | $32.5 | $34.4 | $69.2 | 46.9% |
| Total, Current Expenditures | $3.5 | $83.4 | $52.6 | $139.5 | 94.6% |
| Bond Retirement | $0.0 | $4.7 | $3.3 | $8.0 | 5.4% |
| Total All Expenditures | $3.5 | $88.0 | $56.0 | $147.5 | 100.0% |
| Funded by Federal Government* | 3.5 | 28.4 | 1.2 | 33.1 | 22.4% |
| Funded by State Governments* | 0.0 | 57.9 | 15.0 | 72.9 | 49.4% |
| Funded by Local Governments* | 0.0 | 1.7 | 39.8 | 41.5 | 28.1% |
While the Federal government funded $33.1 billion (22.4 percent) of total highway expenditures of $147.5 billion in 2004, the majority of the Federal government's contribution to highways consists of grants to State and local governments. Direct Federal spending on capital outlay, maintenance, administration, and research amounted to only $3.5 billion (2.4 percent). The remaining $29.6 billion was in the form of transfers to State and local governments.
State governments combined $28.4 billion of Federal funds with $57.9 billion of State funds and $1.7 billion of local funds to make direct expenditures of $88.0 billion (59.7 percent). Local governments combined $1.2 billion of Federal funds with $15.0 billion of State funds and $39.8 billion of local funds to make direct expenditures of $56.0 billion (38.0 percent).
Types of Highway Expenditures
Current highway expenditures can be divided into two broad categories: non-capital and capital. Non-capital highway expenditures include maintenance of highways, highway and traffic services, administration, highway law enforcement, highway safety, and interest on debt. Highway capital outlay consists of those expenditures associated with highway improvements, including land acquisition and other right-of-way costs; preliminary and construction engineering; new construction, reconstruction, resurfacing, rehabilitation, and restoration costs of roadways, bridges, and other structures; and installation of traffic service facilities such as guardrails, fencing, signs, and signals. Bond retirement is not part of current expenditures, but it is included in the figures cited for total highway expenditures in this report.
|
|
|
What basis is used for distinguishing between capital expenditures and maintenance expenditures?
The classification of the revenue and expenditure items in this report is based on definitions contained in A Guide to Reporting Highway Statistics, the instructional manual for States providing financial data for the Highway Statistics publication. This manual indicates that the classification of highway construction and maintenance expenditures should be based on criteria provided in the American Association of State Highway and Transportation Officials publication, AASHTO Maintenance Manual—1987.
Other definitions of maintenance are used by different organizations. Some resurfacing, restoration, and rehabilitation projects that meet this report's definition of capital outlay might be classified as maintenance activities in internal State or local accounting systems.
|
As shown in Exhibit 6-6, all levels of government spent $70.3 billion on capital outlay in 2004, or 47.6 percent of total highway expenditures. Highway capital outlay expenditures are discussed in more detail later in this chapter.
|
|
|
How are "maintenance" and "highway and traffic services" defined in this report?
Maintenance in this report includes routine and regular expenditures required to keep the highway surface, shoulders, roadsides, structures, and traffic control devices in usable condition. This includes spot patching and crack sealing of roadways and bridge decks and maintaining and repairing highway utilities and safety devices such as route markers, signs, guardrails, fence, signals, and highway lighting.
Highway and traffic services include activities designed to improve the operation and appearance of the roadway. This includes items such as the operation of traffic control systems, snow and ice removal, highway beautification, litter pickup, mowing, toll collection, and air quality monitoring.
|
Current non-capital expenditures consumed $69.2 billion (46.9 percent), while the remaining $8.0 billion (5.4 percent) went for bond redemption. Most Federal funding for highways goes for capital items. Non-capital expenditures are funded primarily by State and local governments. In 2004, spending by local governments on non-capital expenditures exceeded spending by State governments on non-capital expenditures, with local governments spending $34.4 billion and State governments spending $32.5 billion. The majority of maintenance expenditures occurred at the local government level, or $17.4 billion (63.5 percent) of the $27.3 billion total.
Historical Expenditure and Funding Trends
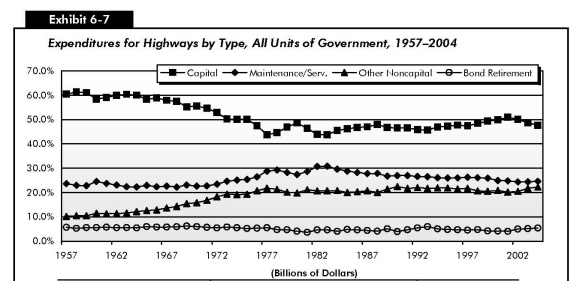
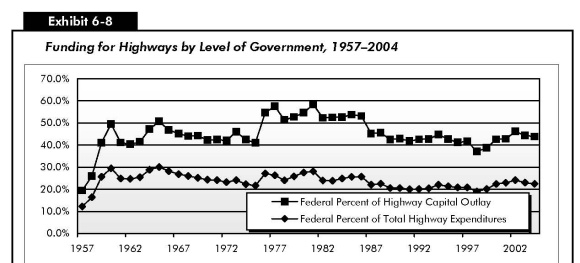
Exhibits 6-7 and 6-8 provide historical perspective for the 2004 values shown in Exhibit 6-6. Exhibit 6-7 shows how the composition of highway expenditures by all levels of government combined has changed over time. Exhibit 6-8 shows the amounts provided by each level of government to finance those expenditures and the share of funding provided by the Federal government for total highway expenditures and for highway capital outlay.
The increased Federal funding for highways available under the Transportation Equity Act for the 21st Century (TEA-21) contributed to a 44.7 percent increase (from $102.0 billion to $147.5 billion) in total highway spending by all levels of government between 1997 and 2004. Capital outlay by all levels of government increased by 45.2 percent from $48.4 billion to $70.3 billion over the same period.
| Other Noncapital | ||||||||
|---|---|---|---|---|---|---|---|---|
| Year | Capital Outlay | Maintenance and Service | Administration | Highway Patrol & Safety | Interest On Debt | Other Non-Capital | Debt Retirement | Total |
| 1957 | $5.6 | $2.2 | $0.4 | $0.3 | $0.3 | $0.9 | $0.5 | $9.3 |
| 1961 | $6.8 | $2.7 | $0.5 | $0.3 | $0.4 | $1.3 | $0.7 | $11.5 |
| 1965 | $8.4 | $3.3 | $0.8 | $0.5 | $0.5 | $1.8 | $0.9 | $14.3 |
| 1969 | $10.4 | $4.3 | $1.1 | $1.1 | $0.7 | $2.9 | $1.2 | $18.8 |
| 1973 | $12.2 | $5.9 | $1.7 | $1.9 | $1.0 | $4.7 | $1.4 | $24.2 |
| 1977 | $13.1 | $8.6 | $2.4 | $2.8 | $1.3 | $6.5 | $1.6 | $29.8 |
| 1981 | $19.7 | $12.2 | $3.4 | $3.9 | $1.7 | $9.0 | $1.6 | $42.4 |
| 1985 | $26.6 | $16.6 | $4.2 | $5.2 | $2.1 | $11.5 | $2.8 | $57.5 |
| 1989 | $33.1 | $19.0 | $5.7 | $6.6 | $2.8 | $15.2 | $3.6 | $70.9 |
| 1993 | $39.5 | $22.9 | $7.9 | $7.2 | $3.7 | $18.8 | $5.2 | $86.4 |
| 1995 | $44.2 | $24.3 | $8.4 | $8.2 | $3.8 | $20.4 | $4.5 | $93.5 |
| 1997 | $48.4 | $26.8 | $8.3 | $9.8 | $4.2 | $22.2 | $4.6 | $102.0 |
| 1998 | $52.3 | $28.2 | $8.5 | $9.4 | $4.4 | $22.3 | $5.1 | $108.0 |
| 1999 | $57.2 | $30.0 | $9.0 | $10.4 | $4.4 | $23.7 | $4.9 | $115.9 |
| 2000 | $61.3 | $30.6 | $10.0 | $11.0 | $4.6 | $25.6 | $5.1 | $122.7 |
| 2001 | $66.7 | $32.4 | $10.2 | $11.4 | $4.8 | $26.4 | $5.3 | $130.8 |
| 2002 | $68.2 | $33.2 | $10.7 | $11.7 | $5.4 | $27.8 | $6.8 | $135.9 |
| 2003 | $70.0 | $35.0 | $12.0 | $13.5 | $5.7 | $31.2 | $7.4 | $143.6 |
| 2004 | $70.3 | $36.3 | $12.7 | $14.3 | $5.8 | $32.9 | $8.0 | $147.5 |
The percentage of total highway expenditures that went for capital outlay peaked at 61.3 percent in 1958. Subsequently, capital outlay's share of total spending gradually declined to a low of 43.8 percent in 1983. As shown in Exhibit 6-7, this share climbed up in 2001 and 2002, exceeding 50 percent for the first time since 1975. Since then, this share has fallen below 50 percent to 47.6 percent in 2004.
Exhibit 6-8 shows that the portion of total highway funding provided by the Federal government rose from 20.8 to 22.4 percent from 1997 to 2004. The Federal share of capital funding also increased significantly (from 41.6 to 43.8 percent) over this same period. Federal cash expenditures for capital purposes increased 52.9 percent from 1997 to 2004, while State and local capital investment increased by 39.9 percent. Federal support for highways increased dramatically following the passage of the Federal-Aid Highway Act of 1956 and the establishment of the HTF. The Federal share of total funding peaked in 1965 at 30.1 percent. Since that time, the Federal percentage of total funding has gradually declined, but remained above 20.0 percent until 1998, when it dropped to 19.0 percent. Because TEA-21 was not enacted until late in Federal FY 1998, the increased funding under the legislation did not immediately translate into increased cash outlays during that year. Because the Federal-aid highway program is a multiple-year reimbursable program, the impact of increases in obligation levels phases in gradually over a number of years. The Federal percentage of total funding rose steadily from 1998 until 2002 when it reached 24.1 percent, as the increased obligation authority provided under TEA-21 began to translate into higher cash outlays, but has subsequently been declining.
| Funding for Total Highway Expenditures | Funding for Capital Outlay | |||||||
|---|---|---|---|---|---|---|---|---|
| Year | Federal | Billions of Dollars State |
Billions of Dollars Local |
Total | Percent Federal | Billions of Dollars Federal |
Billions of Dollars Total |
Percent Federal |
| 1957 | $1.1 | $6.1 | $2.0 | $9.3 | 12.2% | $1.1 | $5.6 | 19.4% |
| 1961 | $2.9 | $6.2 | $2.4 | $11.5 | 24.8% | $2.8 | $6.8 | 41.1% |
| 1965 | $4.3 | $7.3 | $2.7 | $14.3 | 30.1% | $4.2 | $8.4 | 50.7% |
| 1969 | $4.7 | $10.4 | $3.7 | $18.8 | 25.1% | $4.6 | $10.4 | 44.2% |
| 1973 | $5.8 | $13.8 | $4.6 | $24.2 | 24.1% | $5.6 | $12.2 | 46.0% |
| 1977 | $7.8 | $15.1 | $6.9 | $29.8 | 26.3% | $7.5 | $13.1 | 57.6% |
| 1981 | $11.9 | $20.1 | $10.4 | $42.4 | 28.1% | $11.5 | $19.7 | 58.4% |
| 1985 | $14.7 | $27.9 | $14.9 | $57.5 | 25.7% | $14.3 | $26.6 | 53.8% |
| 1989 | $14.5 | $36.4 | $19.9 | $70.9 | 20.5% | $14.1 | $33.1 | 42.5% |
| 1993 | $17.6 | $46.5 | $22.3 | $86.4 | 20.4% | $16.9 | $39.5 | 42.7% |
| 1995 | $19.9 | $48.8 | $24.7 | $93.5 | 21.3% | $18.9 | $44.2 | 42.6% |
| 1997 | $21.2 | $54.2 | $26.6 | $102.0 | 20.8% | $20.1 | $48.4 | 41.6% |
| 1998 | $20.5 | $59.7 | $27.8 | $108.0 | 19.0% | $19.4 | $52.3 | 37.1% |
| 1999 | $23.3 | $61.0 | $31.7 | $116.0 | 20.1% | $22.1 | $57.2 | 38.7% |
| 2000 | $27.5 | $62.7 | $32.6 | $122.7 | 22.4% | $26.1 | $61.3 | 42.6% |
| 2001 | $30.0 | $66.3 | $34.5 | $130.8 | 23.0% | $28.5 | $66.7 | 42.8% |
| 2002 | $32.8 | $69.0 | $34.1 | $135.9 | 24.1% | $31.5 | $68.2 | 46.1% |
| 2003 | $33.0 | $71.9 | $38.7 | $143.6 | 23.0% | $31.1 | $70.0 | 44.4% |
| 2004 | $33.1 | $72.8 | $41.6 | $147.5 | 22.4% | $30.8 | $70.3 | 43.8% |
The Federally funded portion of capital outlay by all levels of government rose above 40 percent in 1959, peaking at 58.4 percent in 1981. From 1987 through 1997, the Federal share remained in a range of 41 to 46 percent. The Federal percentage of capital outlay dropped below this range in 1998, falling to 37.1 percent, but returned to it in 2000 and has remained in it since. After rising to 46.1 percent in 2002, it has fallen to 43.8 percent in 2004.
|
|
|
Do the relative Federal, State, and local shares of funding described in this chapter equate to a comparable relative degree of influence?
No. As discussed earlier, significant intergovernmental transfers of funds occur from the Federal government to State and local governments, from State governments to local governments, and from local governments to State governments. Depending on the specific grant program involved, State and local recipients of transfer payments from other governments have a varying degree of autonomy and discretion in how they use the funds. The implication of this is that the relative degree of influence that each level of government has on what individual projects are funded and what types of highway expenditures are made is not necessarily consistent with the share of highway funding that each level of government provides.
|
Spending by all levels of government on maintenance and traffic services increased by 35.7 percent from 1997 to 2004, but declined as a percentage of total highway spending, since other types of expenditures grew even faster. As shown in Exhibit 6-7, maintenance and traffic services' share of total highway spending dropped to 24.6 percent. Spending on other non-capital expenditures, including highway law enforcement and safety, administration and research, and interest payments, also grew slightly faster than overall highway spending from 1997 to 2004, increasing from 21.8 percent of total spending to 22.3 percent.
The 2004 edition of this report noted that expenditures for highway law enforcement and safety grew more slowly than other spending categories from 1997 to 2002. This trend has not been maintained in subsequent years, as spending growth in this category reached 46.7 percent from 1997 to 2004. Expenditures for administration and research and for debt service grew slightly slower than overall highway spending over the same period. Debt retirement expenditures were the fastest-growing category of expenses between 1997 and 2004.
Constant Dollar Expenditures
Highway expenditures grew more quickly than inflation between 1997 and 2004. As noted earlier, total highway expenditures increased 44.7 percent from $102.0 billion to $147.5 billion between 1997 and 2004, which equates to an average annual growth rate of 5.4 percent. Over the same period, it is estimated that highway construction costs increased at an annual rate of 3.4 percent, and other costs rose at an annual rate of 3.3 percent. In constant dollar terms, total highway expenditures grew by 22.7 percent between 1997 and 2004.
|
|
|
What indices are used to convert current dollars to constant dollars in this report?
For capital outlay expenditures, the FHWA Construction Bid Price Index is used. For all other types of highway expenditures, the CPI was used.
|
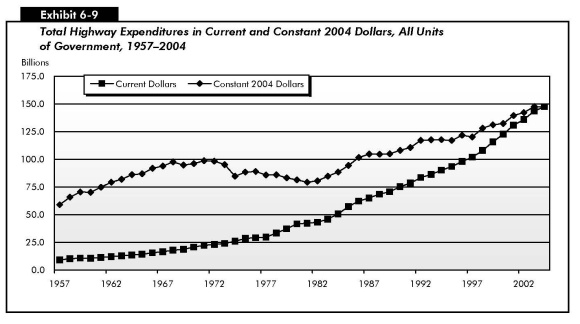
Exhibit 6-9 shows that highway expenditures have grown in current dollar terms in each of the years from 1957 through 2004. In constant dollar terms, total highway expenditures by all levels of government reached a plateau in 1971. From 1972 to 1981, highway spending did not keep pace with inflation. Since 1981, constant dollar highway spending has increased; and by 1986, it had moved back above the 1971 level. Constant dollar spending reached an all-time high in 2003.
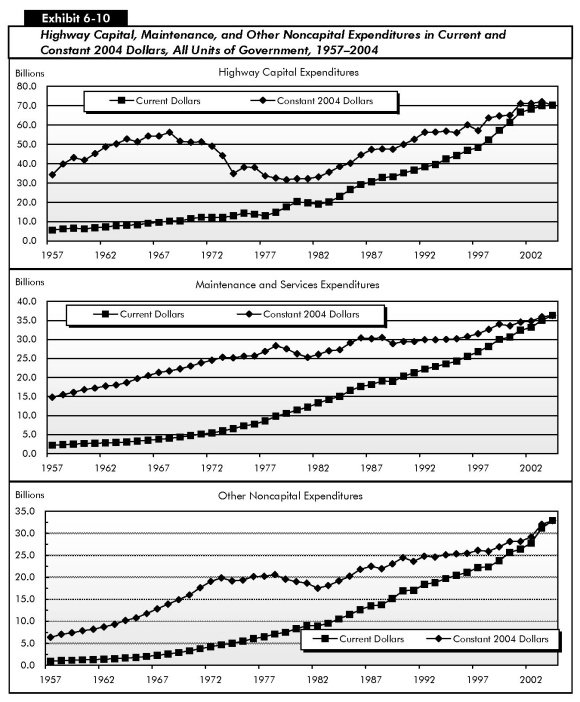
Much of the increase in constant dollar spending since 1981 has been driven by highway capital outlay expenditures, which have grown more quickly than maintenance and other non-capital expenditures in both current and constant dollar terms. Over this 23-year period, highway capital outlay grew at an average annual rate of 5.7 percent from $19.0 billion to $70.3 billion; in constant dollar terms, this equates to a 117.6 percent increase. Over this same period, maintenance and traffic services grew by 43.7 percent in constant dollar terms, and other non-capital expenditures grew by 76.1 percent in constant dollars. Highway construction costs grew more slowly than the CPI during this period, so the purchasing power of funds used for capital outlay expenditures has not eroded as quickly. Highway construction costs grew at an average annual rate of 2.2 percent since 1981, compared with an average annual increase in the CPI of 3.2 percent. Exhibit 6-10 compares current dollar and constant dollar spending for capital outlay, maintenance and traffic services, and other non-capital expenditures (including highway law enforcement and safety, administration and research, and interest payments)
Looking at the more recent period between 1997 and 2004, highway capital outlay expenditures grew 22.9 percent in constant dollar terms. Federal spending, which accounted for nearly half (43.8 percent) of all highway capital outlay expenditures in 2004, increased 29.4 percent in constant dollars, while State and local capital investment increased by 18.3 percent in constant dollars. During this same period, maintenance and traffic services grew by 15.3 percent in constant dollar terms, and other noncapital expenditures grew by 25.9 percent in constant dollars.
Constant Dollar Expenditures per VMT
While not all types of highway expenditures would necessarily be expected to grow in proportion to vehicle miles traveled (VMT), increases in VMT do increase the wear and tear on existing roads, leading to higher capital and maintenance costs. The addition of new lanes and roads to accommodate additional traffic results in one-time capital costs, as well as recurring costs for rehabilitation and maintenance. Traffic supervision and safety costs are also related in part to traffic volume. As the highway system has grown and become more complex, the cost of administering the system has grown as well.
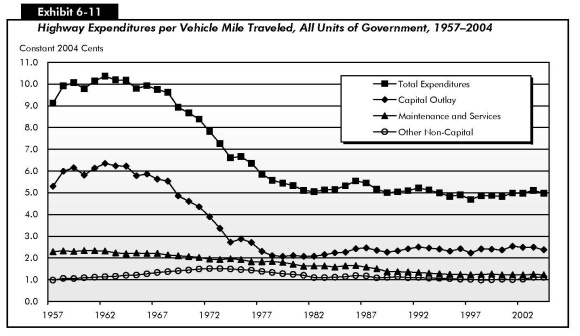
In current dollar terms, total expenditures per VMT have grown steadily over time. Between 1997 and 2004, expenditures per VMT rose from 4.0 cents to 5.0 cents. Expenditures per VMT in constant dollars also rose during this period, increasing 6.1 percent. During the 1960s and 1970s, total expenditures per VMT declined steadily in constant dollar terms, but the rate of decline slowed during the 1980s and early 1990s.
Capital outlay per VMT increased 6.3 percent between 1997 and 2004 in constant dollar terms. As shown in Exhibit 6-11, capital spending in 2001 was the highest since 1976. Spending on maintenance and traffic services declined 0.3 percent over this same period on a constant cents per VMT basis, but constant spending per VMT on other non-capital items rose 8.9 percent.
Highway Capital Outlay Expenditures
State governments directly spent $50.9 billion on highway capital outlay in 2004. As discussed earlier in the chapter, and as shown in Exhibit 6-6, this figure includes the $28.4 billion received in grants from the Federal government for highways.
Exhibit 6-12 shows how States applied this $50.9 billion to different functional systems and also includes an estimate of how the total $70.3 billion spent by all levels of government was applied. State government capital outlay is concentrated on the higher-order functional systems; local governments apply the larger part of their capital expenditures to lower-order systems.
Total highway capital expenditures by all levels of government amounted to $8,427 per lane-mile in 2004, or 2.4 cents per VMT. Capital outlay per lane-mile was highest for the higher-order functional systems and was higher on urban roads than rural roads. Capital outlay per VMT ranged from 3.4 cents on rural other principal arterials to 1.6 cents on urban minor arterials. On a cents-per-VMT basis, capital outlay for rural roads is about 12 percent higher than for urban roads.
| Capital Outlay, All Jurisdictions | ||||
|---|---|---|---|---|
| Functional Class | Direct State Capital Outlay ($Billions) | Total ($Billions) | Per Lane Mile (Dollars) | Per VMT (Cents) |
| Rural Arterials and Collectors | ||||
| Interstate | $4.5 | $4.5 | $35,082 | 1.7 |
| Other Principal Arterial | 8.0 | 8.1 | 32,662 | 3.4 |
| Minor Arterial | 4.0 | 4.7 | 16,517 | 2.8 |
| Major Collector | 2.8 | 4.2 | 4,942 | 2.1 |
| Minor Collector | 0.5 | 1.5 | 2,737 | 2.4 |
| Subtotal | $19.9 | $22.9 | $11,243 | 2.4 |
| Urban Arterials and Collectors | ||||
| Interstate | 11.0 | 11.0 | 133,237 | 2.4 |
| Other Freeway & Expressway | 5.8 | 6.1 | 127,962 | 2.9 |
| Other Principal Arterial | 7.9 | 9.9 | 47,094 | 2.2 |
| Minor Arterial | 3.2 | 5.9 | 23,891 | 1.6 |
| Collector | 1.1 | 3.3 | 15,138 | 2.0 |
| Subtotal | $28.9 | $36.2 | $44,937 | 2.2 |
| Subtotal, Rural and Urban | $48.8 | $59.2 | $20,782 | 2.3 |
| Rural and Urban Local | $2.1 | $11.1 | $2,023 | 2.8 |
| Total, All Systems | $50.9 | $70.3 | $8,427 | 2.4 |
| Funded by Federal Government* | $28.4 | $30.8 | $3,692 | 1.0 |
Capital Outlay by Improvement Type
States provide the FHWA with detailed data on what they spend on arterials and collectors, classifying expenditures on each functional system into 17 improvement types. For this report, these improvement types have been allocated among three groups: System Rehabilitation, System Expansion, and System Enhancement. Note that the term "System Rehabilitation" replaces the term "System Preservation" used in previous C&P reports.
|
|
|
Why has the term "system preservation" been replaced by "system rehabilitation" in this edition of the C&P report?
Over time, the term "preservation" has been adopted within the asset management community to mean "a strategy of improvements on existing roads and bridges, intended to extend service life of the existing pavement and bridge infrastructure without increasing its structural capacity." That definition would include some items classified as maintenance expenditures in this report, but would not include heavy rehabilitation or reconstruction.
To avoid confusion, this edition of the report has dropped the general term "preservation" in favor of "rehabilitation," which is more widely understood to refer only to capital expenditures, rather than maintenance expenditures.
|
Exhibit 6-13 shows the distribution of the $48.8 billion in State expenditures among these three categories. Detailed data on Federal government and local expenditures are unavailable, so the combined $59.2 billion of capital outlay on arterials and collectors by all levels of government was classified based on the State expenditure patterns. Similarly, little information is available on the types of improvements being made by all levels of government on local functional system roads. To develop an estimate for the improvement type breakdown for the $70.3 billion invested on all systems in 2004, it was assumed that expenditure patterns were roughly equivalent to those observed for arterials and collectors.
In 2004, about $36.4 billion was spent on system rehabilitation (51.8 percent of total capital outlay). As defined in this report, system rehabilitation activities include capital improvements on existing roads and bridges that are designed to preserve the existing pavement and bridge infrastructure, but does not include routine maintenance.
| System Expansion | |||||
|---|---|---|---|---|---|
| System Rehabilitation | New Roads & Bridges | Existing Roads | System Enhancement | Total | |
| Direct State Expenditures on Arterials and Collectors |
|||||
| Right-of Way | $2.2 | $1.9 | $4.0 | ||
| Engineering | $3.3 | 1.3 | 1.1 | $0.6 | 6.3 |
| New Construction | 6.8 | 6.8 | |||
| Relocation | 1.3 | 1.3 | |||
| Reconstruction-Added Capacity | 1.4 | 3.3 | 4.8 | ||
| Reconstruction-No Added Capacity | 3.6 | 3.6 | |||
| Major Widening | 2.3 | 2.3 | |||
| Minor Widening | 0.5 | 0.5 | |||
| Restoration & Rehabilitation | 7.3 | 7.3 | |||
| Resurfacing | 0.3 | 0.3 | |||
| New Bridge | 1.2 | 1.2 | |||
| Bridge Replacement | 3.0 | 3.0 | |||
| Major Bridge Rehabilitation | 1.9 | 1.9 | |||
| Minor Bridge Work | 2.0 | 2.0 | |||
| Safety | 1.4 | 1.4 | |||
| Traffic Management/Engineering | 0.9 | 0.9 | |||
| Environmental and Other | 1.3 | 1.3 | |||
| Total, State Arterials & Collectors | $23.1 | $11.6 | $9.9 | $4.1 | $48.8 |
| Total, Arterials and Collectors, All Jurisdictions (estimated)* |
|||||
| Highways and Other | 20.6 | 11.8 | 11.8 | 5.2 | 49.4 |
| Bridge | 8.3 | 1.4 | 9.7 | ||
| Total, Arterials and Collectors | $28.9 | $13.2 | $11.8 | $5.2 | $59.2 |
| Total Capital Outlay on all Systems (estimated)* |
|||||
| Highways and Other | 26.0 | 13.1 | 12.8 | 6.4 | 58.3 |
| Bridges | 10.5 | 1.6 | 12.0 | ||
| Total, All Systems | $36.4 | $14.7 | $12.8 | $6.4 | $70.3 |
| Percent of Total | 51.8% | 20.9% | 18.3% | 9.0% | 100.0% |
About $14.7 billion (20.9 percent of total capital outlay) was spent on the construction of new roads and bridges in 2004. An additional $12.8 billion (18.3 percent) is estimated to have been used to add lanes to existing roads. Another $6.4 billion (9.0 percent) was spent on system enhancement, including safety enhancements, traffic operations improvements, and environmental enhancements.
Exhibit 6-14 depicts the change, over time, in the share of capital outlay devoted to these major categories. The overall share of highway capital improvements going toward system rehabilitation increased significantly from 1997 to 2002, reaching 52.6 percent. From 2002 to 2004, the rehabilitation share decreased slightly, to 51.8 percent. The share devoted to system enhancements decreased between 1997 and 2000, but has significantly increased since then to 9.0 percent in 2004.
|
|
|
How are "system rehabilitation," "system expansion," and "system enhancement" defined in this report?
System rehabilitation consists of capital improvements on existing roads and bridges, intended to preserve the existing pavement and bridge infrastructure. This includes reconstruction, resurfacing, pavement restoration or rehabilitation, widening of narrow lanes or shoulders, bridge replacement, and bridge rehabilitation. Also included is the portion of widening projects estimated to be related to reconstructing or improving the existing lanes. System rehabilitation does not include routine maintenance costs.
Note that system rehabilitation as defined in this report does not include routine maintenance. As shown in Exhibit 6-6, an additional $27.3 billion was spent by all levels of government in 2004 on routine maintenance.
System expansion includes the construction of new roads and new bridges, as well as those costs associated with adding lanes to existing roads. This includes all "New Construction," "New Bridge," "Major Widening," and most of the costs associated with "Reconstruction-Added Capacity," except for the portion of these expenditures estimated to be related to improving the existing lanes of a facility. As used in this report, "System Expansion" is the functional equivalent to "Capacity Expansion" used in some previous editions of the C&P report. The term was modified because some system rehabilitation and system enhancement improvements may result in added capacity without the addition of new lanes.
System Enhancement includes safety enhancements, traffic operations improvements such as the installation of intelligent transportation systems, and environmental enhancements.
|
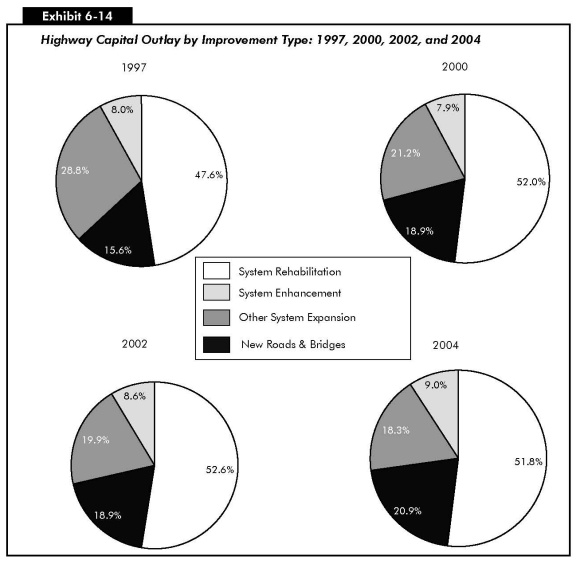
Expenditures for new roads and bridges relative to other improvement expenditures increased from 15.6 percent in 1997 to 18.9 percent 2000, and remained steady at that level in 2002. In 2004, expenditures for new roads and bridges relative to other improvement expenditures reached 20.9 percent. Other system expansion decreased significantly, however (18.3 percent in 2004 versus 19.9 percent in 2002, and down from 28.8 percent in 1997). As a result, overall outlays for system expansion continued to decrease proportionally, compared with rehabilitation and enhancements.
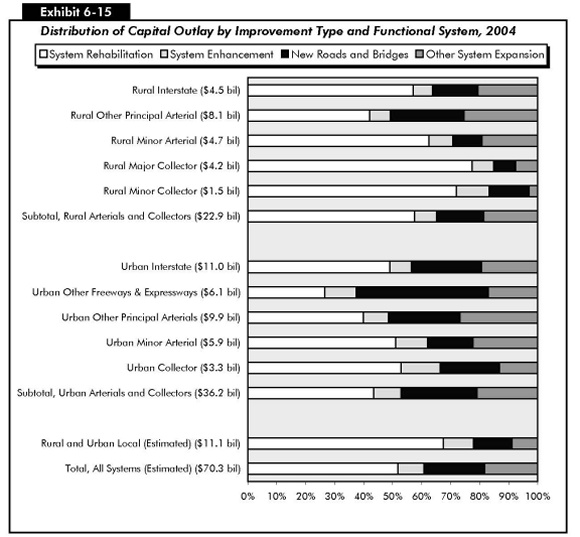
Exhibit 6-15 shows significant variations in the types of capital expenditures made by States on different functional systems. The portion of capital outlay devoted to system rehabilitation ranges from 39.9 percent on urban other principal arterials to 77.4 percent on rural major collectors. Overall, system rehabilitation's share on arterials and collectors in rural areas (57.5 percent) was greater than in urban areas (43.5 percent).
System expansion expenditures also vary significantly by functional class. The portion of capital used for construction of new roads and bridges is highest on urban other freeways and expressways, at 45.5 percent, while urban other principal arterials have the largest share going to other system expansion improvements (26.9 percent). Urban other freeways and expressways have over 62.5 percent of capital investment devoted to system expansion. Total system expansion shares are lower on collectors (22.2 percent) than on Interstates (41.4 percent) and other arterials (47.9 percent).
Constant Dollar Expenditures by Improvement Type
As indicated earlier, highway capital outlay expenditures grew 22.9 percent in constant dollar terms during the period from 1997 to 2004. Spending on system enhancements grew more quickly than spending on other components of highway capital outlay, increasing 38.9 percent in constant dollar terms from 1997 to 2004. System rehabilitation (also known as system preservation in previous reports) increased 33.9 percent in constant dollar terms, while investment in system expansion (the construction of new roads and bridges and widening of existing roadways) grew more slowly, rising 8.3 percent in constant dollar terms.
Transit Finance
Transit Funding
In 2004, $39.5 billion was available from all sources to finance transit investment and operations (compared with $36.5 billion in 2002). Transit funding comes from two major sources: public funds allocated by Federal, State, and local governments; and system-generated revenues earned for the provision of transit services. Federal funding for transit includes fuel taxes dedicated to transit from the Mass Transit Account (MTA) of the Highway Trust Fund (HTF), as well as undedicated taxes allocated from Federal general fund appropriations. State and local governments also provide funding for transit from their general fund appropriations, as well as from fuel, income, sales, property, and other unspecified taxes, specific percentages of which may be dedicated to transit [Exhibit 6-16]. These percentages vary considerably among taxing jurisdictions and by type of tax. Other public funds from sources such as toll revenues and general transportation funds may also be used to fund transit. System-generated revenues are composed principally of passenger fares; although additional revenues are also earned by transit systems from advertising and concessions, park-and-ride lots, investment income, and rental of excess property and equipment. More than two-thirds of the increase in transit funding between 2002 and 2004 comes from increases in local funding and system-generated revenues.
| Federal | State | Local | Total | Percent | |
|---|---|---|---|---|---|
| Public Funds | $6,954 | $7,792 | $13,659 | $28,406 | 71.9% |
| General Fund | 1,391 | 2,043 | 2,692 | $6,126 | 15.5% |
| Fuel Tax | 5,564 | 505 | 148 | $6,216 | 15.7% |
| Income Tax | 187 | 98 | $285 | 0.7% | |
| Sales Tax | 2,106 | 4,765 | $6,871 | 17.4% | |
| Property Tax | 63 | 490 | $553 | 1.4% | |
| Other Dedicated Taxes | 1,044 | 784 | $1,828 | 4.6% | |
| Other Public Funds | 1,844 | 4,682 | $6,526 | 16.5% | |
| System-Generated Revenue | 11,093 | 28.1% | |||
| Passenger Fares | 9,114 | 23.1% | |||
| Other Revenue | 1,979 | 5.0% | |||
| Total All Sources | $39,499 | 100.0% |
Level and Composition of Transit Funding
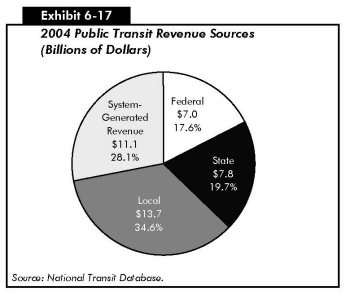
Exhibit 6-17 breaks down the sources of total transit funding. In 2004, public funds of $28.4 billion were available for transit and accounted for 72 percent of total transit funding. Of this amount, Federal funding was $7.0 billion, accounting for 25 percent of total public funding and for 18 percent of all available funding from both public and nonpublic sources. State funding was $7.8 billion, accounting for 27 percent of total public funds and 20 percent of funding from all sources. Local jurisdictions provided the bulk of transit funds, $13.7 billion in 2004, or 48 percent of total public funds and 35 percent of all funding. System-generated revenues were $11.1 billion, 28 percent of all funding.
|
|
|
What type of dedicated funding does mass transit receive from Federal highway-user fees?
Prior to FY 1983, all Federal funding for transit was from general revenue sources. In 1983 the Mass Transit Account was established within the Highway Trust Fund, funded by 1.0 cent of the Federal motor-fuel tax. In 1990, the portion of the Federal fuel tax dedicated to the Mass Transit Account was increased to 1.5 cents, in 1995 to 2.0 cents, in 1997 to 2.85 cents, and in 1998 to 2.86 cents (retroactive to October 1, 1997) with the passage of the Transportation Equity Act for the 21st Century (TEA-21). Since 1997, 2.86 cents of Federal highway-user fees on gasohol, diesel and kerosene fuel, and other special fuels, including benzol, benzene, and naphtha, have also been dedicated to the Mass Transit Account. (Since 1997, the total Federal fuel tax for a gallon of gasoline has been 18.4, cents and the total tax for a gallon of diesel has been 24.4 cents.)
Since 1997, the Mass Transit Account has also received 2.13 cents of the user fee on liquefied petroleum gas (LPG) and 1.86 cents of the user fee on liquefied natural gas (LNG). (The total Federal fuel tax for a gallon of LPG has been 11.9 cents, and the total tax for a gallon of LNG has been 48.54 cents.) The Mass Transit Account does not receive any of the nonfuel revenues (such as heavy vehicle use taxes) that accrue to the Highway Trust Fund.
Since the passage of the Safe, Accountable, Flexible and Efficient Transportation Equity Act: A Legacy for Users (SAFETEA-LU) only the Formula and Bus Grants Program is funded from the Mass Transit Account. Prior to SAFETEA-LU, the Mass Transit Account was used to fund other FTA programs.
|
Federal Funding
Federal funding for transit comes from two sources, the general revenues of the U.S. government and revenues credited to the Mass Transit Account of HTF generated from fuel taxes. The Mass Transit Account, a transit trust fund for capital projects in transit, is the largest source of Federal funding for transit. Eighty-two percent of the transit funds authorized for transit by SAFETEA-LU ($37.2 billion) will be derived from the Mass Transit Account. Funding from the Mass Transit Account in nominal dollars increased from $0.5 billion in 1983 to $4.9 billion in 2004.
|
|
|
What comprises a general fund?
A general fund is made up of all appropriation, expenditure, and receipt transactions, except for those required, generally by statute, to be accounted for in a separate fund.
|
Since 1973, Federal surface transportation authorization statutes have contained flexible funding provisions that enable transfers from certain highway funds to transit programs and vice versa. In 1973, Congress began to allow local areas to exchange interstate transfer highway trust funds for transit funding from general revenues. Federal-aid highway dollars could be converted to transit grant purposes, with a higher local share. Flexible funding was implemented under the Intermodal Surface Transportation Efficiency Act of 1991 (ISTEA) and continued by TEA-21. Transfers are subject to State and regional/local discretion, and priorities are established through Statewide transportation planning processes. All States and territories within the United States participate in the flexible funding program, except Kansas, North Dakota, South Dakota, and Wyoming. The amount of flexible funding transferred from highways to transit fluctuates from year to year. In 2004, $1,475.4 million in flexible funds were available to transit for obligation, of which $980.0 million was transferred to FTA in FY 2004 and $494.5 million was the unobligated carryover from prior years' transfers. In 2002, $1.1 billion was "flexed" from highways to transit, and $1.6 billion in 2000. Since the program's beginning in FY 1992, through FY 2004, a total of $10.9 billion has been transferred from highways to transit.
Of the $980.0 million flexed by 43 states during FY2004, $975.4 million was obligated; $842.9 million was obligated to the Urbanized Area Formula program, $99.7 million to the Elderly and Persons with Disabilities Program, and $32.7 million to the Non-Urbanized Area Formula Program.
No flexible funds may be transferred directly to the Section 5309 Program; however, flexible funds that have been transferred to the 5307 Program may be used with Section 5309 funds to finance capital investment projects.
The flexible program also allows funds from the FTA Urbanized Area Formula Program to be transferred to FHWA. In 2004, a total of $1.7 million was transferred. During the 11 years of the flexible fund program, from FY 1992 to FY 2004, $43.6 million has been transferred to FHWA. This amount is less than one-half of one percent of total flexible funding.
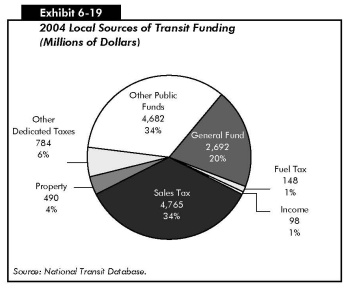
State and Local Funding
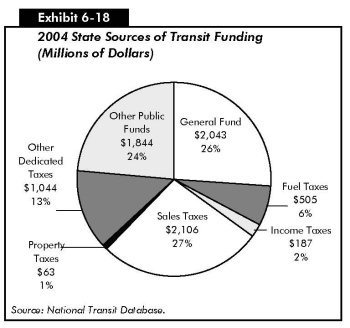
General funds and other dedicated public funds are important sources of funding for transit at both the State and local levels [Exhibits 6-18 and 6-19]. In 2004, 26 percent of State funds and 20 percent of local funds came from general revenues. Allocations from other public funds accounted for 24 percent of total State and 34 percent of total local funding for transit. Dedicated sales taxes are a major source of funding for transit at both the State and local level. In 2004, they accounted for 27 percent of total State and 34 percent of total local funding for transit. Dedicated income and property taxes provide more modest levels of funding at both the State and local levels. Dedicated income taxes are a more important source of transit funds at the State level, whereas dedicated property taxes are more important at the local level.
|
|
|
What are other public funds?
Other public funds are those funds that are not dedicated to transit at their source or are not included in the budgeting process of general revenue funds. These funds include vehicle licensing and registration fees, communications access fees, surcharges and taxes, lottery and casino, and the proceeds from property and asset sales.
|
Level and Composition of System-Generated Funds
In 2004, system-generated funds were $11.1 billion and provided 28 percent of total transit funding. Passenger fares contributed $9.1 billion, accounting for 82 percent of system-generated funds and 23 percent of total transit funds. These passenger fare figures do not include payments by State entities to transit systems to offset reduced transit fares for certain segments of the population, such as students and the elderly. These payments are included in the other revenue category.
Trends in Public Funding
Prior to 1962, there was no Federal funding for transit. State and local funding was limited, equal to 12 percent of total public funding for transit in 2004 in real terms. Public funding for transit grew rapidly in the 1970s. Federal funding increased at an average annual rate of 38.9 percent, and State and local funding increased at an average annual rate of 11.9 percent throughout the decade. Federal funding grew much more slowly during the 1980s, increasing at an average annual rate of 0.4 percent, while funding at the State and local levels continued to grow steadily at an average annual rate of 7.8 percent. During the 1990s, Federal funding for transit grew more rapidly than in the 1980s, increasing at an average annual rate of 4.3 percent. However, State and local government funding grew more slowly than in the preceding decade, increasing at an average annual rate of 4.8 percent. Public funding for transit increased even more rapidly between 2000 and 2004 than in the 1980s and 1990s, growing at an average annual rate of 8.0 percent; Federal funding increased at an average annual rate of 7.2 percent, and State and local funding grew at an average annual rate of 8.3 percent. The average annual increase in Federal funding between 2002 and 2004 was 5.1 percent and the average annual increase in State and local funding over this period was 3.2 percent [Exhibit 6-20].
| Federal | State and Local | Total | Federal Share | |
|---|---|---|---|---|
| Year | Millions of Current Dollars | Dollars | ||
| 1960 | $0 | $683 | $683 | 0.0% |
| 1970 | 124 | 1,499 | 1,623 | 7.6% |
| 1980 | 3,307 | 4,617 | 7,924 | 41.7% |
| 1990 | 3,458 | 9,823 | 13,281 | 26.0% |
| 1991 | 3,395 | 11,116 | 14,511 | 23.4% |
| 1992 | 3,448 | 11,195 | 14,643 | 23.5% |
| 1993 | 3,297 | 11,991 | 15,287 | 21.6% |
| 1994 | 3,380 | 12,522 | 15,902 | 21.3% |
| 1995 | 4,082 | 12,971 | 17,053 | 23.9% |
| 1996 | 4,060 | 12,643 | 16,703 | 24.3% |
| 1997 | 4,742 | 12,728 | 17,470 | 27.1% |
| 1998 | 4,421 | 13,200 | 17,620 | 25.1% |
| 1999 | 4,586 | 15,166 | 19,752 | 23.2% |
| 2000 | 5,259 | 15,739 | 20,999 | 25.0% |
| 2001 | 6,586 | 17,631 | 24,216 | 27.2% |
| 2002 | 6,296 | 20,294 | 26,590 | 23.7% |
| 2003 | 6,688 | 21,107 | 27,796 | 24.1% |
| 2004 | 6,954 | 21,452 | 28,406 | 24.5% |
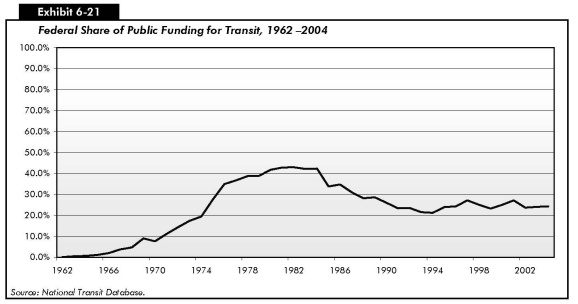
Federal funding for transit, as a percentage of total public funding for transit from Federal, State, and local sources combined, reached a peak of 43 percent in the early 1980s [Exhibit 6-21]. However, by 1990, the Federal government share had fallen to 26 percent as the result of the growth in State and local funding for transit vastly exceeding the growth of Federal funding during the 1980s. Since 1990, the Federal government has provided between 27 and 21 percent of total public funding for transit; in 2004, it provided 24.5 percent of these funds.
Funding in Current and Constant Dollars
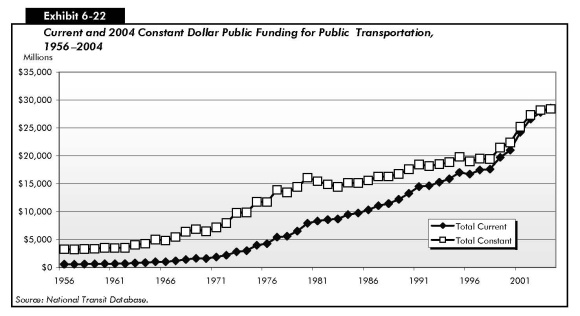
Total public funding for transit in current dollars reached its highest level of $28.4 billion in 2004, compared with $26.6 billion in 2002, a total increase of 7.5 percent. Federal funding in current dollars was 10.5 percent higher in 2004 than in 2002, increasing from $6.3 billion in 2002 to $7.0 billion in 2004; and State and local funding in current dollars was 6.5 percent higher, increasing from $20.3 billion in 2002 to $21.5 billion in 2004. Total public funding for transit in constant dollars increased by 3.4 percent between 2002 and 2004; funding in constant dollars from Federal sources increased by 6.3 percent over this period and from State and local sources by 2.5 percent [Exhibit 6-22].
Capital Funding and Expenditures
Funding for capital investments by transit operators in the United States comes primarily from public sources. Capital investment funds for transit are also generated through innovative finance programs, which are discussed in Chapter 13.
Capital investments include the design and construction of new transit systems, extensions of existing systems ("New Starts"), and the modernization of existing fixed assets. Fixed assets include fixed guideway systems (e.g., rail tracks), terminals, and stations, as well as maintenance and administrative facilities. Capital investment expenditures also include the acquisition, renovation, and repair of rolling stock (i.e., buses, railcars, and locomotives and service vehicles).
In 2004, total public transit agency expenditures for capital investment were $12.6 billion in current dollars and accounted for 32 percent of total available funds. Federals funds were $4.9 billion (39.0 percent of total transit agency capital expenditures), State funds were $1.8 billion (13.9 percent of total transit agency capital expenditures), and local funds were $5.9 billion (47.1 percent of total transit agency capital expenditures).
While the share of these funding sources was only very slightly different in 2004 than in 2002, it is notable that the 39 percent share of Federal funds for capital expenses in 2004 was well below the 47 percent in 1995, the 54 percent share in 1997, and the 1995 to 2004 average of 46 percent [Exhibit 6-23]. As will be discussed later in this chapter, this may be related to an increase in the Federal share of funds for operating expenses in 2004.
| Average Annual Growth | ||||||||||||
|---|---|---|---|---|---|---|---|---|---|---|---|---|
| 1995 | 1996 | 1997 | 1998 | 1999 | 2000 | 2001 | 2002 | 2003 | 2004 | 2004/1995 | 2004/2002 | |
| Federal | $3,314 | $3,506 | $4,138 | $3,680 | $3,726 | $4,275 | $5,468 | $4,994 | $5,092 | $4,930 | 4.5% | -0.6% |
| Share | 47.3% | 50.4% | 54.2% | 49.7% | 44.1% | 47.2% | 50.5% | 40.6% | 39.9% | 39.0% | ||
| State | $989 | $895 | $1,007 | $875 | $858 | $973 | $1,011 | $1,433 | $1,623 | $1,756 | 6.6% | 10.7% |
| Share | 14.1% | 12.9% | 13.2% | 11.8% | 10.2% | 10.7% | 9.3% | 11.6% | 12.7% | 13.9% | ||
| Local | $2,706 | $2,553 | $2,492 | $2,856 | $3,860 | $3,808 | $4,345 | $5,874 | $6,061 | $5,943 | 9.1% | 0.6% |
| Share | 38.6% | 36.7% | 32.6% | 38.5% | 45.7% | 42.0% | 40.1% | 47.8% | 47.4% | 47.1% | ||
| Total | $7,008 | $6,955 | $7,636 | $7,411 | $8,443 | $9,056 | $10,825 | $12,301 | $12,775 | $12,629 | 6.8% | 1.3% |
As shown in Exhibit 6-24, rail modes require a higher percentage of total capital investment than bus modes because of the higher cost of building fixed guideways and rail stations. In 2004, $8.8 billion, or 70 percent of total transit capital expenditures, was invested in rail modes of transportation, compared with $3.8 billion, or 30 percent of the total, which was invested in nonrail modes. This split was virtually the same in 2002.
| Guideway | Rolling Stock | Systems | Maintenance Facilities | Stations | Fare Revenue Collection Equipment | Administrative Buildings | Other Vehicles | Other Capital Expenditures1 | Total | Percent of Total | |
|---|---|---|---|---|---|---|---|---|---|---|---|
| Rail | 3,754 | 1,439 | 1,610 | 633 | 732 | 66 | 17 | 26 | 551 | 8,829 | 70% |
| Commuter Rail | 937 | 726 | 390 | 156 | 84 | 16 | 4 | 4 | 260 | 2,577 | 20% |
| Heavy Rail | 1398 | 330 | 978 | 350 | 496 | 39 | 12 | 18 | 175 | 3,796 | 30% |
| Light Rail | 1414 | 381 | 240 | 126 | 150 | 10 | 1 | 4 | 116 | 2,441 | 19% |
| Other Rail 2 | 5 | 3 | 2 | 1 | 3 | 0 | 0 | 0 | 1 | 15 | 0% |
| Nonrail | 283 | 1,922 | 451 | 484 | 237 | 65 | 113 | 27 | 217 | 3,800 | 30% |
| Motorbus | 211 | 1665 | 296 | 427 | 219 | 61 | 102 | 25 | 191 | 3,196 | 25% |
| Demand Response | 0 | 100 | 8 | 43 | 11 | 2 | 11 | 2 | 9 | 187 | 1% |
| Ferryboat | 0 | 94 | 145 | 2 | 0 | 1 | 0 | 0 | 15 | 257 | 2% |
| Trolleybus | 71 | 51 | 1 | 12 | 5 | 1 | 0 | 0 | 1 | 143 | 1% |
| Other Nonrail 3 | 0 | 13 | 1 | 0 | 1 | 0 | 0 | 0 | 1 | 16 | 0% |
| Total | 4,036 | 3,362 | 2,062 | 1,117 | 969 | 131 | 130 | 54 | 768 | 12,628 | 100% |
| Percent of Total | 32% | 27% | 16% | 9% | 8% | 1% | 1% | 0% | 6% | 100% |
Exhibit 6-24 shows the capital investment expenditures by asset type in 2004. The columns shown in the table are in descending order of the value of the amount invested with the exception of "other capital expenditures," which are provided at the end. Fluctuations in the levels of capital investment in different types of transit assets reflect normal rehabilitation and replacement cycles, in addition to new investment. Capital investment expenditures have only been reported to the NTD at the level of detail in Exhibit 6-24 since 2002.
Guideway investment was $4.0 billion in 2004; investment in systems in 2004 was $2.1 million. Guideway includes at-grade rail, elevated and subway structures, tunnels, bridges, track and power systems for all rail modes, and paved highway lanes dedicated to buses. A system is a group of devices or objects forming a network, especially for distributing something or serving a common purpose (e.g., telephone systems). [Note that these systems are different from the rail systems discussed in Chapters 3 and 7.]
Investment in rolling stock in 2004 was $3.4 billion, investment in stations was $1.0 billion, and investment in maintenance facilities was $1.1 billion. Rolling stock includes the bodies and chassis of transit vehicles and their attached fixtures and appliances, but does not include fare collection equipment and revenue vehicle movement control equipment such as radios. Stations include platforms, shelters, and parking and crime prevention and security equipment at stations. Facilities include the purchase, construction, and rehabilitation of maintenance facilities, including design and engineering, demolition, and land acquisition. Facilities also include investment in transit malls, transfer facilities, intermodal terminals, shelters, passenger stations, depots, terminals, high-occupancy vehicle facilities, transit ways, park-and-ride facilities, and a range of equipment—crime prevention and security equipment, service and support equipment, operational support equipment (e.g., computer hardware and software), line equipment and structures, signals and communication equipment, and power equipment and substations—is also included. [Note that the facilities include guideway and rail systems reported separately in Chapters 3 and 7.] In 2004, $768 million was invested in other capital.
Other vehicles and revenue collection equipment, which were included in other capital in 2002, were reported separately in 2004. Other capital, as defined in 2004, includes the construction of general administration facilities, furniture, equipment that is not an integral part of buildings and structures, data processing equipment (including computers and peripheral devices whose sole use is in data processing operations), revenue vehicle movement control equipment, and shelters located at on-street bus stops.
|
|
|
What are "New Starts"?
Projects involving the construction of new fixed guideway systems are known as "New Starts." Title 49 USC Section 5309 provides for the allocation of funds for the construction of new fixed guideway systems, fixed guideway modernization and expansion, and bus capital requirements. To receive FTA capital investment funds for a New Starts project, the proposed project must emerge from the metropolitan and/or Statewide planning process. A rigorous series of planning and project development requirements must be completed in order to qualify for this funding. Local officials are required to analyze the benefits, costs, and other impacts with alternative transportation strategies before deciding upon a locally preferred alternative. FTA evaluates proposed projects on the basis of financial criteria and project justification criteria (including cost-effectiveness) as prescribed by statute. Initial planning efforts are not funded through the Section 5309 program, but may be funded through Section 5303 Metropolitan Planning or Section 5307 Urbanized Area Formula Grants programs.
Under current law, Federal funding may account for up to 80 percent of a New Starts funding requirement. Generally, however, the Federal share of such projects now averages about 50 percent of the total project cost. SAFETEA-LU authorized $7.4 billion in Federal funding for New Starts from 2005 through 2009; TEA-21 authorized $6.1 billion in Federal funding for New Starts from 1998 to 2003; $2.8 billion dollars of New Starts funding was authorized for 2004.
|
Operating Expenditures
Transit operating expenditures include wages, salaries, fuel, spare parts, preventive maintenance, support services, and leases used in providing transit service. In 2004, $26.9 billion was available for operating expenses and accounted for 68 percent of total available funds. Of this amount, $2.0 billion was provided by the Federal government (7.5 percent of total transit agency operating expenditures), $6.0 billion was provided by State governments (22.5 percent of total transit agency operating expenditures), $7.9 billion by local governments (29.4 percent of total transit agency operating expenditures), and $10.9 billion by system-generated revenues (40.6 percent of total transit agency operating expenditures) [Exhibit 6-25]. The Federal share of operating expenditures of 7.5 percent was higher in 2004 than in any other year during the 1995 to 2004 period, up from a 5.4 percent share in 2002; the State share of operating expenditures of 22.5 percent in 2004 declined from 25.3 percent in 2002. The share of operating expenditures provided by local governments and system-generated revenues was virtually unchanged from 2002 to 2004.
| Average Annual | ||||||||||||
|---|---|---|---|---|---|---|---|---|---|---|---|---|
| 1995 | 1996 | 1997 | 1998 | 1999 | 2000 | 2001 | 2002 | 2003 | 2004 | 2004/1995 | 2004/2002 | |
| Federal | $768 | $554 | $604 | $741 | $860 | $984 | $1,117 | $1,302 | $1,596 | $2,024 | 11.4% | 24.7% |
| Share | 4.6% | 4.6% | 3.3% | 4.0% | 3.9% | 4.5% | 4.8% | 5.4% | 6.3% | 7.5% | ||
| State | $3,599 | $3,789 | $3,661 | $3,819 | $3,819 | $4,351 | $5,127 | $6,113 | $6,043 | $6,036 | 5.9% | -0.6% |
| Share | 21.8% | 21.8% | 20.0% | 20.5% | 17.4% | 20.1% | 21.8% | 25.3% | 23.8% | 22.5% | ||
| Local | $5,146 | $5,406 | $5,568 | $5,649 | $6,097 | $6,513 | $7,147 | $6,874 | $7,382 | $7,887 | 4.9% | 7.1% |
| Share | 31.1% | 31.1% | 30.4% | 30.3% | 27.8% | 30.0% | 30.4% | 28.4% | 29.1% | 29.4% | ||
| System-generated Revenues | $7,015 | $8,185 | $8,477 | $8,438 | $11,128 | $9,832 | $10,112 | $9,890 | $10,355 | $10,922 | 5.0% | 5.1% |
| Share | 42.4% | 42.4% | 46.3% | 45.2% | 50.8% | 45.3% | 43.0% | 40.9% | 40.8% | 40.6% | ||
| Total | $16,527 | $17,933 | $18,310 | $18,647 | $21,905 | $21,680 | $23,503 | $24,179 | $25,376 | $26,870 | 5.5% | 5.4% |
TEA-21 mandated that Federal funding to transit systems in urbanized areas with populations over 200,000 be used only for capital expenses and operating expenses for preventive maintenance, and not for other types of operating expenses. Formula grant funds to urbanized areas with populations of less than 200,000 were still allowed to be used for operating expenses. As a result of the 2000 census, 56 areas were reclassified as urbanized areas with populations of more than 200,000. (These reclassifications were announced by the Census Department in May 2002.) Transit agencies operating in these areas were slated to lose their eligibility to use Federal formula funding to finance transit operations starting in FY 2003. The Transit Operating Flexibility Act of 2002 amended Section 5307 of 49 USC to allow transit systems that were in these areas to continue to use their formula funds for operating expenses as well as for capital expenses in FY2003, despite their change in status. This change was extended by the Surface Transportation Extension Act of 2003. Under SAFETEA-LU these transit agencies may continue to use formula funds for operating expenses in FY 2005 at 100 percent of their FY 2002 apportionment, in FY 2006 at 50 percent of their FY 2002 apportionment, and in FY 2007 at 25 percent of their FY 2002 apportionment.
Operating Expenditures by Transit Mode
In 2004, transit operators' actual operating expenditures were $25.4 billion, compared with $22.9 billion in 2002 [Exhibit 6-26]. These expenditures increased at an average annual rate of 5.4 percent between 2002 and 2004, at about the same pace as the 4.9 percent average annual increase between 1995 and 2004. Demand response systems experienced the largest percentage increase in operating expenditures among the modes shown during the 2002 to 2004 period, rising at an average annual rate of 7.8 percent, which was below the 10.8 percent average annual increase between 1995 and 2004. The rapid increases in demand response operating expenditures reflect increased services to the elderly and persons with disabilities pursuant to the Americans with Disabilities Act of 1990 and new programs targeted toward the provision of services to these groups. Operating expenditures for heavy rail and commuter rail increased more rapidly between 2002 and 2004 (at average annual rates of 5.3 percent and 7.1 percent) than between 1995 and 2004 (at average annual rates of 3.3 percent and 5.0 percent). In contrast, the operating expenditures for light rail increased at an average annual rate of 3.0 between 2002 and 2004, much more slowly than the 9.2 percent average annual increase over the 1995 to 2004 period. Operating expenditures for buses increased at an average annual rate of 4.7 percent between 2002 and 2004, closely in line with the 1995 to 2004 average. Operating expenditures for the remaining modes combined as "Other" increased at an average annual rate of 7.1 percent between 2002 and 2004, relatively close to the 6.6 percent experienced, on average, over the 1995 to 2004 period.
| Year | Motorbus | Heavy Rail | Commuter Rail | Light Rail | Demand Response | Other | Total |
|---|---|---|---|---|---|---|---|
| 1995 | 9,247 | 3,523 | 2,211 | 375 | 757 | 415 | 16,528 |
| 1996 | 9,324 | 3,402 | 2,294 | 440 | 849 | 440 | 16,748 |
| 1997 | 9,777 | 3,474 | 2,278 | 471 | 1,009 | 454 | 17,462 |
| 1998 | 10,120 | 3,530 | 2,360 | 493 | 1,134 | 498 | 18,135 |
| 1999 | 10,841 | 3,693 | 2,574 | 536 | 1,275 | 540 | 19,460 |
| 2000 | 11,026 | 3,931 | 2,679 | 592 | 1,225 | 549 | 20,003 |
| 2001 | 11,814 | 4,180 | 2,854 | 676 | 1,410 | 595 | 21,529 |
| 2002 | 12,586 | 4,267 | 2,995 | 778 | 1,636 | 643 | 22,905 |
| 2003 | 13,316 | 4,446 | 3,173 | 754 | 1,779 | 718 | 24,185 |
| 2004 | 13,790 | 4,734 | 3,436 | 826 | 1,902 | 739 | 25,427 |
| Percent of Total | |||||||
| 1995 | 55.9% | 21.3% | 13.4% | 2.3% | 4.6% | 2.5% | 100.0% |
| 2004 | 54.2% | 18.6% | 13.5% | 3.2% | 7.5% | 2.9% | 100.0% |
| Average Annual Growth Rate |
|||||||
| 2004/2002 | 4.7% | 5.3% | 7.1% | 3.0% | 7.8% | 7.1% | 5.4% |
| 2004/1995 | 4.5% | 3.3% | 5.0% | 9.2% | 10.8% | 6.6% | 4.9% |
Buses accounted for the largest percentage of transit operating expenditures, $13.8 billion in 2004, or 54 percent of the operating expenditure total. Operating expenditures for heavy rail in 2004 were $4.7 billion, or 19 percent of the total; operating expenditures for commuter rail were $3.4 billion, or 14 percent of the total, and operating expenditures for demand response systems were $1.9 billion, or 7.5 percent of the total. Operating expenditures for light rail were $0.8 billion, and operating expenditures for the remaining modes $0.7 billion, each accounting for less than 3.0 percent of the total [Exhibit 6-26].
Operating Expenditures by Type of Cost
In 2004, $13.4 billion, or 53 percent of total transit operating expenditures, were for vehicle operations [Exhibit 6-27]. Expenditures on vehicle maintenance were $5.0 billion, or 20 percent of the total; expenditures on nonvehicle maintenance were $2.7 billion, or 11 percent of the total; and expenditures on general administration were $4.2 billion, or 17 percent of the total. The distribution of these expenses across cost categories is virtually the same as in 2002. Expenditures increased for vehicle operations at an average annual rate of 7 percent between 2002 and 2004, for vehicle maintenance at an average annual rate of 4 percent, for nonvehicle maintenance at an average annual rate of 6 percent, and for general administration at an average annual rate of 3 percent.
| Mode | Vehicle Operations | Vehicle Maintenance | Nonvehicle Maintenance | General Administration | Total | |||||
|---|---|---|---|---|---|---|---|---|---|---|
| Motorbus | $8,006 | 60% | $2,862 | 57% | $631 | 23% | $2,291 | 54% | $13,790 | 54% |
| Heavy Rail | 2015 | 15% | 813 | 16% | $1,224 | 45% | $683 | 16% | $4,734 | 19% |
| Commuter Rail | 1380 | 10% | 820 | 16% | $623 | 23% | $613 | 15% | $3,436 | 14% |
| Light Rail | 374 | 3% | 206 | 4% | $156 | 6% | $152 | 4% | $887 | 3% |
| Demand Response | 1264 | 9% | 234 | 5% | $40 | 1% | $364 | 9% | $1,902 | 7% |
| Other | 393 | 3% | 107 | 2% | $61 | 2% | $117 | 3% | $677 | 3% |
| Total | $13,431 | 100% | $5,042 | 100% | $2,735 | 100% | $4,219 | 100% | $25,427 | 100% |
| 53% | 20% | 11% | 17% | 100% | ||||||
Bus and rail operations have inherently different cost structures. While 67 percent of total operations expenditures for demand response transit (e.g., demand response operating expenses of $1,264 million as a percentage of demand response total operating expenses of $1,902 million) and 58 percent of total operations expenditures for buses were spent for actual operation of the vehicles, only 42 percent of rail operations expenditures were spent on the operation of rail vehicles. A significantly higher percentage of expenditures for rail modes of transportation are classified as nonvehicle maintenance for the repair and maintenance of fixed guideway systems.
Operating Expenditures per Vehicle Revenue Mile
Operating expenditures per vehicle revenue mile (VRM) is one measure of financial or cost efficiency. It shows the expense of operating a transit vehicle in revenue service. In 2004, operating expenditures per VRM for all transit modes combined was $6.42 [Exhibit 6-28]. The average annual increase in operating expenditures per VRM for all modes combined was higher between 2002 and 2004 (at an average annual rate of 3.5 percent) than between 1995 and 2004 (at an average annual rate of 1.9 percent.) Commuter rail experienced the most rapid average annual increase in operating expenditures per VRM between 2002 and 2004 at an average annual rate of 5.2 percent. Operating expenditures per VRM for demand response systems also increased briskly during this period at an average rate of 4.3 percent. In contrast, operating expenditures per VRM for light rail decreased at an average rate of 2.3 percent between 2002 and 2004, declining from a peak of $12.98 in 2002. Between 2002 and 2004, light rail operating expenses increased by 3.0 percent and light rail VRM increased by 5.4 percent. [Note that operating expenses per VRM for light rail increased very rapidly between 2000 and 2002.]
| Year | Motorbus | Heavy Rail | Commuter Rail | Light Rail | Demand Response | Other* | Total |
|---|---|---|---|---|---|---|---|
| 1995 | 5.81 | 6.52 | 10.15 | 11.07 | 2.55 | 5.86 | 6.05 |
| 1996 | 5.91 | 6.44 | 10.36 | 12.01 | 2.76 | 5.53 | 6.09 |
| 1997 | 6.09 | 6.44 | 9.92 | 11.84 | 2.88 | 5.13 | 6.12 |
| 1998 | 6.12 | 6.43 | 9.91 | 11.65 | 2.92 | 5.00 | 6.11 |
| 1999 | 6.31 | 6.58 | 10.58 | 11.37 | 3.05 | 4.42 | 6.25 |
| 2000 | 6.25 | 6.80 | 10.81 | 11.51 | 2.71 | 5.05 | 6.25 |
| 2001 | 6.49 | 7.07 | 11.28 | 12.72 | 2.88 | 5.41 | 6.49 |
| 2002 | 6.75 | 7.07 | 11.56 | 12.98 | 3.11 | 5.59 | 6.68 |
| 2003 | 7.33 | 7.27 | 12.11 | 12.25 | 3.27 | 6.37 | 6.96 |
| 2004 | 7.32 | 7.58 | 12.79 | 12.40 | 3.39 | 5.21 | 7.17 |
| Average(1995–2004) | $6.44 | $6.82 | $10.95 | $11.98 | $2.95 | $5.36 | $6.42 |
| Average Annual Rate of Change |
|||||||
| 2004/2002 | 4.1% | 3.5% | 5.2% | -2.3% | 4.3% | -3.5% | 3.5% |
| 2004/1995 | 2.6% | 1.7% | 2.6% | 1.3% | 3.2% | -1.3% | 1.9% |
Operating expenditures per capacity-equivalent VRM is a better measure of comparing cost efficiency among modes than operating expenditures per VRM because it adjusts for passenger-carrying capacities [Exhibit 6-29]. Rail systems are more cost efficient in providing service than nonrail systems, once investment in rail infrastructure has been completed. Based on operating costs alone, heavy rail is the most efficient at providing transit service, and demand response systems the least efficient. Operating expenses per capacity-equivalent VRM for all modes, except light rail, increased more rapidly between 2002 and 2004 than the average level of inflation in the economy as measured by the GDP deflator. Operating expenses per capacity-equivalent VRM for light rail decreased between 2002 and 2004 because operating expenses grew at 3.0 percent and capacity-equivalent VRM grew by 9.4 percent. [Note that annual changes in operating expense per capacity-equivalent VRM and unadjusted VRM for bus are the same. Annual changes in operating expense per capacity-equivalent VRM and unadjusted VRM are not the same for the remaining modes because VRMs in each year have been adjusted by the vehicle carrying capacity in that year. The 2004 report used constant carrying capacity adjustment factors across all years.]
| Year | Motorbus | Heavy Rail | Commuter Rail | Light Rail | Demand Response | Other* | Total |
|---|---|---|---|---|---|---|---|
| 1995 | 5.81 | 2.93 | 5.49 | 4.73 | 18.25 | 7.42 | 4.96 |
| 1996 | 5.91 | 2.90 | 5.61 | 5.13 | 19.76 | 7.43 | 5.00 |
| 1997 | 6.09 | 2.94 | 4.36 | 5.14 | 18.04 | 7.26 | 4.96 |
| 1998 | 6.12 | 2.93 | 4.23 | 4.98 | 17.80 | 7.61 | 4.98 |
| 1999 | 6.31 | 2.92 | 5.72 | 4.54 | 21.85 | 7.43 | 5.28 |
| 2000 | 6.25 | 2.94 | 5.29 | 4.55 | 16.60 | 7.71 | 5.15 |
| 2001 | 6.49 | 3.03 | 4.65 | 5.01 | 16.21 | 8.53 | 5.24 |
| 2002 | 6.75 | 2.91 | 4.59 | 5.20 | 16.31 | 8.43 | 5.31 |
| 2003 | 7.08 | 2.94 | 4.78 | 4.44 | 17.27 | 9.57 | 5.49 |
| 2004 | 7.32 | 3.06 | 5.02 | 4.61 | 18.79 | 9.10 | 5.68 |
| Average (1995–2002) | $6.22 | $2.94 | $4.99 | $4.91 | $18.10 | $7.73 | $5.11 |
| Average Annual Rate of Change |
|||||||
| 2004/2002 | 4.1% | 2.6% | 4.5% | -5.9% | 7.3% | 3.9% | 3.4% |
| 2004/1995 | 2.6% | 0.5% | -1.0% | -0.3% | 0.3% | 2.3% | 1.5% |
Operating Expenditures per Passenger Mile
Operating expenditures per passenger mile is an indicator of the cost effectiveness of providing a transit service [Exhibit 6-30]. It shows the relationship between service inputs as expressed by operating expenses and service consumption as expressed by passenger miles traveled. Operating expenditures per passenger mile for all transit modes combined increased at an average annual rate of 3.2 percent between 1995 and 2004 (from $0.41 to $0.55), approximately twice as fast as the 1.7 percent average annual increase in the GDP deflator. This indicates that, on average, the cost of providing transit services in terms of passenger miles provided was double the rate of inflation in the rest of the economy over the same time period. The increase in operating costs per passenger mile between 2002 and 2004 was particularly noticeable for bus, commuter rail, and demand response services. Operating expenditures per passenger mile for buses increased at an average annual rate of 6.4 percent over this time period because of a decline in passenger miles traveled coupled with increases in operating costs. Operating expenditures per passenger mile for commuter rail also increased at an average annual rate of 5.4 percent over this period as a result of an increase in operating costs well in excess of the increases in passenger miles. Operating expenditures per passenger mile for demand response systems, heavy rail, and light rail increased over the 2002 to 2004 period at average annual rates of 3.7 percent, 2.8 percent, and 1.5 percent.
| Year | Motorbus | Heavy Rail | Commuter Rail | Light Rail | Demand Response | Other* | Total |
|---|---|---|---|---|---|---|---|
| 1995 | 0.54 | 0.32 | 0.27 | 0.44 | 1.91 | 0.47 | 0.41 |
| 1996 | 0.55 | 0.30 | 0.27 | 0.46 | 2.17 | 0.46 | 0.43 |
| 1997 | 0.56 | 0.29 | 0.28 | 0.46 | 1.90 | 0.44 | 0.43 |
| 1998 | 0.57 | 0.29 | 0.27 | 0.44 | 2.21 | 0.45 | 0.44 |
| 1999 | 0.58 | 0.29 | 0.29 | 0.45 | 2.28 | 0.46 | 0.45 |
| 2000 | 0.59 | 0.28 | 0.29 | 0.44 | 2.09 | 0.49 | 0.44 |
| 2001 | 0.60 | 0.29 | 0.30 | 0.47 | 2.25 | 0.52 | 0.46 |
| 2002 | 0.64 | 0.31 | 0.32 | 0.54 | 2.51 | 0.55 | 0.50 |
| 2003 | 0.69 | 0.33 | 0.33 | 0.55 | 2.58 | 0.56 | 0.53 |
| 2004 | 0.73 | 0.33 | 0.35 | 0.56 | 2.70 | 0.53 | 0.55 |
| Average (1993–2004) | $0.61 | $0.30 | $0.30 | $0.48 | $2.26 | $0.49 | $0.46 |
| Average Annual Rate of Change |
|||||||
| 2004/2002 | 6.4% | 2.8% | 5.4% | 1.5% | 3.7% | -1.8% | 5.0% |
| 2004/1995 | 3.3% | 0.3% | 3.0% | 2.8% | 3.9% | 1.4% | 3.2% |
Farebox Recovery Ratios
The farebox recovery ratio is calculated as farebox revenues as a percentage of total transit operating costs. It measures users' contributions to the variable cost of providing transit services and is influenced by the number of riders, fare structure, and rider profile. Low regular fares, the high availability and use of discounted fares, and high transfer rates tend to result in lower farebox recovery ratios. Farebox recovery ratios for 2002 to 2004 are provided in Exhibit 6-31. The average farebox recovery ratio over this period for all transit modes combined was 35 percent; heavy rail had the highest average farebox recovery ratio (60 percent), followed by commuter rail (48 percent), light rail (28 percent), bus (27 percent), and demand response (10 percent). The farebox recovery ratios for the remaining "other" modes averaged 33 percent; of these modes, automated guideway had the lowest average recovery ratio (3 percent) and inclined plane the highest (123 percent). Farebox recovery ratios for total costs are not provided because capital investment costs are not spread evenly across years. Rail modes have farebox recovery ratios for total costs that are significantly lower than for operating costs alone because of these modes' high level of capital costs.
| Year | Motorbus | Heavy Rail | Commuter Rail | Light Rail | Demand Response | Other* | Total |
|---|---|---|---|---|---|---|---|
| 2002 | 28% | 58% | 48% | 29% | 11% | 30% | 35% |
| 2003 | 27% | 60% | 49% | 28% | 9% | 32% | 35% |
| 2004 | 27% | 61% | 47% | 26% | 9% | 36% | 35% |
| Average (2002–2004) | 27% | 60% | 48% | 28% | 10% | 33% | 35% |
Rural Transit
Since 1978, the Federal Government has contributed to the financing of transit in rural areas, i.e., areas with populations of less than 50,000. These rural areas are estimated to account for 36 percent of the U.S. population and 38 percent of the transit-dependent population.
Funding for rural transit is currently provided through 49 USC Section 5311, which, in 1994, replaced Section 18 of the Urban Mass Transit Act. Rural transit funding was increased substantially with passage of TEA-21. Federal funding for rural transit was $224 million in FY 2002 and $240 million in FY 2003, the end of the TEA-21 authorization period. States may transfer additional funds to rural transit from highway projects, transit projects, or formula transit funds for small, urbanized areas.
On average, 14 percent of rural transit authorities' operating budgets come from Section 5311 funds [Exhibit 6-32]. State and local governments cover, respectively, 22 and 20 percent of their rural transit operating budgets through a combination of dedicated State and local taxes, appropriations from State general revenues, and allocations from other city and county funds. In 2000, the last year for which information is available, total State and local contributions to rural transit operating budgets increased to a total of $431 million, up from $145 million in 1994. Human Services programs, including Medicaid, cover about 14 percent of rural operating budgets, and in-kind contributions and other revenues cover the remainder.