


Safety Performance: Highways
Considerable progress has been made in reducing the number of highway fatalities since 1966, when Federal legislation first addressed highway safety. Since that time, the highest number of traffic deaths was 54,589 in 1972, while the lowest was 39,250 in 1992. Highway fatalities decreased from 43,005 in 2002 to 42,636 in 2004.
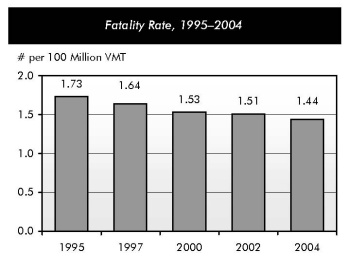
The fatality rate per 100 million VMT has declined over time, as the number of VMT has increased. In 1966, the fatality rate per 100 million VMT was 5.50; this figure had dropped to 1.73 in 1995, 1.51 in 2002, and 1.44 in 2004.
Fatality rates are generally lower in urban areas than rural areas, and on higher-ordered functional systems than lower-ordered functional systems. For example, in 2004, the fatality rate per 100 million VMT on urban Interstate highways was 0.55, while the fatality rate on rural roads functionally classified as local was 3.08.
Of the 42,636 total fatalities in 2004, a reported 25,676 involved a roadway departure, in which a vehicle had left its lane. This includes 10,553 that involved a vehicle rollover, a 10.8 percent increase since 1997. The number of rollover fatalities among sport utility vehicles (SUVs) rose by 96.1 percent over that same time period.
About 9,117 highway fatalities occurred at intersections in 2004, down slightly from the 9,148 reported in 1995. Pedestrian fatalities have shown a steady decrease over time, dropping from 6,256 in 1995 to 5,494 in 2004.
Approximately 6.2 million crashes were reported in 2004. Only 0.6 percent of these crashes were severe enough to result in a fatality; 69.3 percent of these crashes resulted in property damage only, while 30.1 percent resulted in injuries.
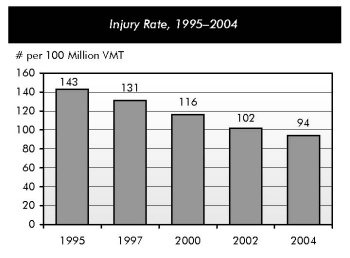
The number of traffic-related injuries has declined over time, from 3.4 million in 1988, the first year for which statistics are available, down to 2.9 million in 2002 and 2.8 million in 2004. There were approximately 169 injuries per 100 million VMT in 1988; this figure declined to 143 in 1995, 102 in 2002, and 94 in 2004.
Alcohol-impaired driving is a serious public safety problem in the United States. Alcohol was a contributing factor in an estimated 16,694 fatalities in 2004 (39 percent of the total) and 7 percent of all crashes.
Speeding is one of the most prevalent factors contributing to traffic crashes. The estimated annual economic costs of speed-related crashes exceeded $40.4 billion in 2004. Speeding was a contributing factor in an estimated 13,192 fatalities in 2004 (31 percent of the total).