Sensitivity Analysis: Highways and Bridges
The usefulness of any investment scenario analysis depends on the validity of the underlying assumptions used to develop the analysis. Since there may be a range of appropriate values for several of the model parameters used in these analyses, this report includes an analysis of the sensitivity of the baseline analyses presented in Chapter 7 to changes in these assumptions.
While previous editions of the C&&P report have examined the effects of a 25 percent constant dollar increase in highway construction costs, this alternative analysis has taken on additional significance due to recent spikes in the costs of various construction materials and petroleum products. Such an increase would lead to a comparable increase in the average annual Cost to Maintain highways and bridges; the Maximum Economic Investment level would rise by only 11.2 percent, as some potential improvements would no longer be cost-beneficial.
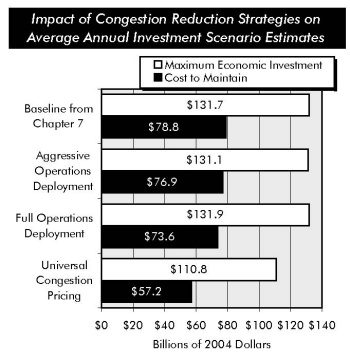
This edition of the report also includes theoretical scenarios involving alternative congestion reduction strategies. The baseline scenarios in Chapter 7 reflect the effects of selected operations strategies and intelligent transportation systems (ITS), assuming existing deployment trends continue. However, if the deployment rates were to accelerate significantly, the Cost to Maintain could decline by 2.4 percent. Assuming full immediate deployment in all applicable locations would bring down the Cost to Maintain by 6.6 percent. The Maximum Economic Investment level would not change significantly, as many of these operations deployments would complement, rather than substitute for, other cost-beneficial highway investments. However, under these alternative assumptions, projected future operational performance would be significantly improved; highway users would save an extra $10 billion annually by 2024 in terms of reduced delay and other costs assuming aggressive deployment rates; assuming full immediate deployment, these savings would rise to $27 billion per year by 2024.
The baseline scenarios in Chapter 7 also assume the continuation of existing financing structures, with their inherent economic inefficiencies. In an ideal (from an economic point of view) world, users of congested facilities would be levied charges precisely corresponding to the economic cost of the delay they impose on one another, thereby reducing peak traffic volumes and increasing net benefits to all users combined. A preliminary analysis of universal congestion pricing using the HERS model suggests that such a strategy could significantly reduce the level of future highway investment that would be required to maintain or improve highway operational performance.
Applying congestion tolls along the principles outlined above to all congested roads could reduce the Cost to Maintain by $21.6 billion per year (27.5 percent), leaving it well below the $70.3 billion level of capital spending in 2004. The Maximum Economic Investment level would be reduced by $20.9 billion (15.9 percent) even while generating a better level of system performance than the baseline scenario. Note that this analysis does not reflect the startup or administrative costs that would be associated with implementing a pricing strategy of this nature. This analysis will be refined in future editions of the C&P report, which might increase or decrease these estimated impacts.