

- Transit Investment Analysis Methodology
- Transit Economics Requirements Model
- TERM Database
- Asset Inventory Data Table
- Urban Area Demographics Data Table
- Agency-Mode Statistics Data Table
- Asset Types Data Table
- Benefit-Cost Parameters Data Table
- Mode Types Data Table
- Investment Policy Parameters
- Financial Parameters
- Investment Categories
- Asset Rehabilitation and Replacement Investments
- Asset Expansion Investments
- Benefit-Cost Calculations
- Benefit-Cost Calculations for Preservation and Expansion Investments
- TERM Database
- Transit Economics Requirements Model
Transit Investment Analysis Methodology
The Transit Economics Requirements Model (TERM), an analytical tool developed by the Federal Transit Administration (FTA), forecasts transit capital investment needs over a 20-year horizon. Using a broad array of transit-related data and research including data on transit capital assets, current service levels and performance, projections of future travel demand, and a set of transit asset specific condition decay relationships, the model generates the forecasts that appear in the biennial C&P report.
This appendix provides a brief technical overview of TERM and describes the various methodologies used to generate the estimates for the 2008 C&P Report.
Transit Economics Requirements Model
TERM forecasts the level of annual capital expenditures required to attain specific physical condition and performance targets within a 20-year period. These annual expenditure estimates cover the following types of investment needs: (1) asset preservation (rehabilitations and replacements); and (2) asset expansion to support projected ridership growth.
TERM Database
The capital needs forecasted by TERM rely on a broad range of input data and user-defined parameters. Gathered from local transit agencies and the National Transit Database (NTD), the input data are the foundation of the model’s investment needs analysis, and include information on the quantity and value of the Nation’s transit capital stock. The input data in TERM are used to draw an overall picture of the Nation’s transit landscape; the most salient data tables that form the backbone of the TERM database are described below.
Asset Inventory Data Table
The asset inventory data table documents the asset holdings of the Nation’s transit operators. Specifically, these records contain information on each asset’s type, transit mode, age, and expected replacement cost. As the FTA does not directly measure the condition of transit assets, asset condition data are not maintained in this table. Instead, TERM uses asset decay relationships to estimate the current and future physical condition as required for each model run. These condition forecasts are then used to determine when each type of asset identified in the asset inventory table is due for either rehabilitation or replacement. The decay relationships are statistical equations that relate asset condition to asset age, maintenance, and utilization. The decay relations and how TERM estimates asset conditions are further explained later in this appendix.
The asset inventory data are derived from a variety of sources including the NTD, responses by local transit agencies to the FTA data requests, and special FTA studies. The asset inventory data table is the primary data source for the information used in TERM’s forecast of preservation needs. Note that the FTA does not currently require agencies to report on all asset types (with the exception of data for revenue vehicles, these data are provided only when requested). Furthermore, the transit industry has no standards for collecting or recording such data. Because of this, TERM analyses must rely on asset inventory data in the format and level of detail as provided by those agencies that respond to the FTA’s asset data requests. Hence the accuracy and consistency of TERM’s estimates of asset needs would benefit from the availability of consistent and ongoing reporting of local agency asset holdings, including those assets types, ages, modes and replacement values.
Urban Area Demographics Data Table
This data table stores demographic information on close to 500 large-, medium-, and small-sized urbanized areas as well as for 10 regional groupings of rural operators. Fundamental demographic data, such as current and anticipated population, in addition to more transit-oriented information, such as current levels of vehicle miles traveled (VMT) and transit passenger miles, are used by TERM to predict future transit asset expansion needs.
Agency-Mode Statistics Data Table
The agency-mode statistics table contains operations and maintenance data on each of the individual modes operated by approximately 700 urbanized transit agencies and more than 1,000 rural operators. Specifically, the agency-mode data on annual ridership, passenger miles, operating and maintenance costs, mode speed, and average fare data are used by TERM to help assess current transit performance, future expansion needs, and the expected benefits from future capital investments in each agency-mode (both for preservation and expansion). All the data in this portion of the TERM database come from the most recently published NTD reporting year. Where reported separately, directly operated and contracted services are both merged into a single agency-mode within this table.
Asset Types Data Table
The asset types data table identifies approximately 500 different asset types utilized by the Nation’s public transit systems in support of transit service delivery (either directly or indirectly). Each record in this table documents each asset’s type, unit replacement costs, and the expected timing and cost of all life-cycle rehabilitation events. Some of the asset decay relationships used to estimate asset conditions are also included in this data table. The decay relationships—statistically estimated equations relating asset condition to asset age, maintenance, and utilization—are discussed more in the next section of this appendix.
Benefit-Cost Parameters Data Table
The benefit-cost parameters data table contains values used to evaluate the merit of different types of transit investments forecasted by TERM. Measures in the data table include transit rider values (e.g., value of time and links per trip), auto costs per VMT (e.g., congestion delay, emissions costs, and roadway wear), and auto user costs (e.g., automobile depreciation, insurance, fuel, maintenance, and daily parking costs).
Mode Types Data Table
The mode types data table provides generic data on all of the mode types used to support U.S. transit operations— including their average speed, average headway, and average fare—and estimates of transit riders’responsiveness to changes in fare levels. Similar data are included for non-transit modes, such as private automobile and taxi costs. The data in this table are used to support TERM’s benefit-cost analysis.
The input tables described above form the foundation of TERM, but are not the sole source of information used when modeling investment forecasts. In combination with the input data, which are static—meaning that the model user does not manipulate them from one model run to the next—TERM contains user-defined parameters to facilitate its capital expenditure forecasts.
Investment Policy Parameters
As part of its investment needs analysis, TERM predicts the current and expected future physical condition of U.S. transit assets over a 20-year horizon. These condition forecasts are then used to determine when each of the individual assets identified in the asset inventory table are due for either rehabilitation or replacement. The investment policy parameters data table allows the model user to set the physical condition ratings at which rehabilitation or replacement investments are scheduled to take place (though the actual timing of rehab and replacement events may be deferred if the analysis is budget constrained). Unique replacement condition thresholds may be chosen for the following asset categories: guideway elements, facilities, systems, stations, and vehicles. For the 2010 C&P Report, all of TERM’s replacement condition thresholds have been set to trigger asset replacement at condition 2.50 (under the Sustain Current Spending scenario, many of these replacements would be deferred due to insufficient funding capacity).
In addition to varying the replacement condition, users can also vary other key input assumptions intended to better reflect the circumstances under which existing assets are replaced and the varying cost impacts of those circumstances. For example, users can assume that existing assets are replaced under full service, partial service, or a service shut down. Users can also assume assets are replaced either by agency (force-account) or by contracted labor. Each of these affects the cost of asset replacement for rail assets.
Financial Parameters
TERM also includes two key financial parameters. First, the model allows the user to establish the rate of inflation used to escalate the cost of asset replacements for TERM’s needs forecasts. Note that this feature is not used for the C&P report, which reports all needs in current dollars. Second, users can adjust the discount rate used for TERM’s benefit-cost analysis.
Investment Categories
The data tables described above allow TERM to estimate different types of capital investments, including rehabilitation and replacement expenditures, expansion investments, and capital projects aimed at performance improvements. These three different investment categories are described below.
Asset Rehabilitation and Replacement Investments
TERM’s asset rehabilitation and replacement forecasts are designed to estimate annual funding needs for the ongoing rehabilitation and replacement of the Nation’s existing transit assets. Specifically, these needs include the normal replacement of assets reaching the end of their useful life, mid-life rehabilitations, and annual “capital expenditures” to cover the cost of smaller capital reinvestment amounts not included as part of asset replacement or rehabilitation activities.
To estimate continuing replacement and rehabilitation investments, TERM estimates the current and expected future physical condition of each transit asset identified in TERM’s asset inventory for each year of the 20-year forecast. These projected condition values are then used to determine when individual assets will require rehabilitation or replacement. TERM also maintains an output record of this condition forecast to assess the impacts of alternate levels of capital reinvestment on asset conditions (both for individual assets and in aggregate). In TERM, the physical conditions of all assets are measured using a numeric scale of 5 through 1; see Exhibit C-1 for a description of the scale.
| Rating | Condition | Description |
|---|---|---|
| Excellent | 4.8–5.0 | No visible defects, near new condition. |
| Good | 4.0–4.7 | Some slightly defective or deteriorated components. |
| Adequate | 3.0–3.9 | Moderately defective or deteriorated components. |
| Marginal | 2.0–2.9 | Defective or deteriorated components in need of replacement. |
| Poor | 1.0–1.9 | Seriously damaged components in need of immediate repair. |
TERM currently allows an asset to be rehabilitated up to five times throughout its life cycle before being replaced. During a life-cycle simulation, TERM records the cost and timing of each re-investment event as a model output and adds it to the tally of national investment needs (provided they pass a benefit-cost test, if applied).
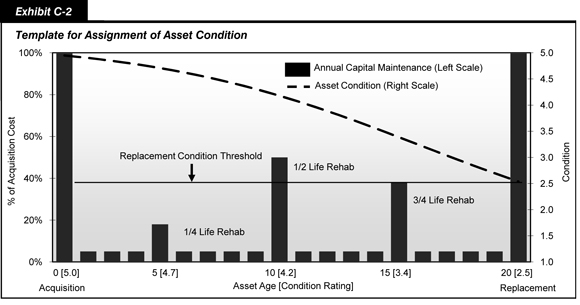
TERM’s process of estimating rehabilitation and replacement needs is represented conceptually for a generic asset in Exhibit C-2. In this theoretical example, asset age is shown on the horizontal axis, the cost of life-cycle capital investments is shown on the left-vertical axis (as a percent of acquisition cost), and asset conditions are shown on the right-vertical axis. At the acquisition date, each asset is assigned an initial condition rating of 5, or “excellent,” and the asset’s initial purchase cost is represented by the tall vertical bar at the left of the chart. Over time, the asset’s condition begins to decline in response to age and use, represented by the dotted line, requiring periodic lifecycle improvements including annual capital maintenance and periodic rehabilitation projects. Finally, the asset reaches the end of its useful life, defined in this example as a physical condition rating of 2.5, at which point the asset is retired and replaced.
Asset Expansion Investments
In addition to devoting capital to the preservation of existing assets, most transit agencies invest in expansion assets to support ongoing growth in transit ridership. To simulate these expansion needs, TERM continually invests in new transit fleet capacity as required to maintain at current levels the ratio of peak vehicles to transit passenger miles. The rate of expansion is projected individually for each of the Nation’s roughly 500 urbanized areas (e.g., based on the urbanized area’s specific growth rate projections or historic rates of transit passenger mile growth) while the expansion needs are determined at the individual agency-mode level. TERM will not invest in expansion assets for agency-modes with current ridership per peak vehicle levels that are well below the national average (these agency modes can become eligible for expansion during a 20-year model run if there is sufficient projected growth in ridership for them to rise above the expansion investment threshold).
In addition to forecasting fleet expansion requirements to support the projected ridership increases, the model also forecasts expansion investments in other assets needed to support that fleet expansion. This includes investment in maintenance facilities and, in the case of rail systems, additional guideway miles including guideway structure, trackwork, stations, train control, and traction power systems. Like other investments forecast by the model, TERM can subject all asset expansion investments to a benefit-cost analysis. Finally, as TERM adds the cost of newly acquired vehicles and supporting infrastructure to its tally of investment needs, it also ensures that the cost of rehabilitating and replacing the new assets is accounted for during the 20-year period of analysis.
The rate of growth in transit passenger miles underlying these asset expansion investments have typically been based on growth rate projections obtained from a sample from the Nation’s 20 to 30 largest Metropolitan Planning Organizations. For this edition of the C&P report, urbanized-area–specific historic growth rates have also been used. Note that if the actual growth rate that materializes in the future is less than the current projected rate of increase, then the level of expansion will be higher than that required to maintain current service and service quality will improve.
Benefit-Cost Calculations
Before being added to the final tally of the Nation’s public transit needs, investments forecasted by TERM may be required to pass a benefit-cost test. This benefit-cost test was applied across all investment scenarios for previous editions of the C&P report but was not utilized for the State of Good Repair benchmark of the current report.
When the benefit-cost test is applied, each investment must generate a stream of investment benefits that equals or exceeds the sum of discounted capital and operating costs (during the 20 years of the model run) to be included in the model’s tally of national transit needs. Conversely, investments with a benefit-cost ratio of less than 1.0 are not included in TERM’s tally of investment needs.
Benefit calculations utilized by TERM are limited to those that are readily quantifiable using publicly available data, such as those available in NTD. Benefits generally fall into two different categories: (1) benefits to transit riders and (2) benefits to society.
Most of the benefits from investment in public transit accrue to new and existing transit riders. Benefits for riders may include travel time savings, reduced costs associated with operating a motor vehicle, improved mobility, and improved quality of service. To quantify these benefits, TERM compares the sum of user costs for a trip when transit investments have been made with the sum of these costs for a trip when no transit investments have been made. In most instances, this means comparing riders’ costs on the selected transit mode with the riders’ costs on the mode that is the next-best alternative (TERM considers a range of potential alternatives).
Although consumers tend to be the primary beneficiaries of new transit investments, society as a whole often benefits as well, principally in the form of cost reductions. Cost savings to society include reductions in highway congestion, air and noise pollution, greenhous gases, energy consumption, and automobile accidents; these benefits result from a portion of potential highway users selecting transit as their preferred alternative. These types of cost reductions are calculated on a per-automobile-VMT basis using publicly available data.
Although TERM calculates the value of these types of benefits across investment types, the model uses somewhat different methodologies to evaluate the costs and benefits of different kinds of investments.
Benefit-Cost Calculations for Preservation and Expansion Investments
For this edition of the C&P report, all of TERM’s benefit-cost tests are performed in a multi-step sequence. In each step, the test is performed at the agency-mode level. First, the test evaluates the total discounted benefits and costs associated with continued reinvestment and expansion (both capital and operating) of each individual agency mode. This means that the effectiveness of all capital investments required to maintain that agency-mode’s ongoing operations, holding asset conditions and performance levels constant, are evaluated jointly rather than as individual investments. If the benefits exceed the capital expenditures (i.e., the benefit-cost ratio is greater than 1.0), then TERM includes all of the agency-mode’s preservation and expansion needs in the tally of national capital investment needs.
If, in contrast, the agency-mode fails this first step of TERM’s benefit-cost test, then TERM conducts a supplemental analysis to determine whether the agency-mode combination will pass the benefit-cost test if TERM’s proposed expansion investments are excluded from the analysis. If the agency-mode passes this lower-level test, then that agency-mode’s preservation needs (but not expansion needs) are included in the tally of 20-year national transit needs.
Finally, if an agency mode fails this second test, it is re-evaluated a third and final time using the “partial” benefit cost test. The partial test operates under the assumption that there are diminishing returns to transit investment such that (1) if less productive (i.e., lower benefit generating) assets are removed from benefit-cost consideration, then the overall benefit-cost ratio for the agency mode will improve; and (2) if a sufficient number of the lowest benefit-producing assets are removed, the overall benefit-cost ratio for the remaining assets will attain a passing value of 1.0. Within TERM, the proportion of assets allowed to pass the partial benefit-cost test is determined based on the benefit-cost ratio as determined in the prior step of the benefit-cost test. Specifically, most of the assets of agency-modes with a “total” benefit-cost ratio close to (but not over) 1.0 will be allowed to pass the partial benefit-cost test. In contrast, only a small proportion of agency-mode assets will pass the partial benefit-cost test if that agency-mode has a very low “total” benefit cost ratio (e.g., under 0.2).