


- Highway Safety
- Overall Fatalities and Injuries
- Fatalities by Functional Class
- Highway Fatalities by Major Crash Type or Contributing Factors
- Roadway Departures
- Intersections
- Pedestrians and Other Nonmotorists
- Alcohol
- Speeding
- Crashes and Fatalities by Vehicle Type
- Transit Safety
Highway Safety
This section describes the safety of the Nation's highway system. It looks at fatalities and injuries on highway functional systems, across vehicle types, and among different segments of the population. It also examines contributing factors to fatal crashes. Fatalities and injuries for bicyclists and pedestrians caused by collisions with vehicles are included in the statistics presented, along with those for vehicle occupants.
Three operating administrations within the U.S. Department of Transportation (DOT) have responsibility for addressing highway safety. The U.S. Federal Highway Administration (FHWA) focuses on infrastructure safety design and operations. The National Highway Traffic Safety Administration (NHTSA) has responsibility for overseeing vehicle safety standards and administering driver behavior programs. The Federal Motor Carrier Safety Administration (FMCSA) has the mission to reduce crashes, injuries, and fatalities involving large trucks and buses.
Statistics in this section are primarily drawn from the Fatality Analysis Reporting System (FARS). The FARS is maintained by NHTSA, which has a cooperative agreement with States to provide information on fatal crashes. Police crash reports, death certificates, and other documents provide data that are tabulated daily and included in the FARS. For consistency with other sections of this report, safety statistics in this section were compiled during the fall of 2009 and represent a “snapshot in time” during the preparation of this report, which is why they may not precisely correspond to other reports completed during the last year.
NHTSA publishes an annual Traffic Safety Facts report that comprehensively describes safety characteristics on the highway transportation network. FMCSA publishes similar reports on a regular basis, specific to truck- and bus-related crashes.
Overall Fatalities and Injuries
There were more than 5.8 million police-reported motor vehicle crashes in the United States in 2008. Fewer than 1 percent (0.6 percent or 34,017) of these crashes were severe enough to result in a fatality, while 28.1 percent (approximately 1.63 million) resulted in injuries and 71.4 percent (approximately 4.15 million) resulted in property damage only, as shown in Exhibit 5-1.
| Year | Crash Severity | Total Crashes | ||||||
|---|---|---|---|---|---|---|---|---|
| Fatal: Number | Fatal: Percent | Injury: Number | Injury: Percent | Property Damage Only: Number | Property Damage Only: Percent | Total Crashes: Number | Total Crashes: Percent | |
| 2000 | 37,526 | 0.6 | 2,070,000 | 32.4 | 4,286,000 | 67.0 | 6,394,000 | 100.0 |
| 2001 | 37,862 | 0.6 | 2,003,000 | 31.7 | 4,282,000 | 67.7 | 6,323,000 | 100.0 |
| 2002 | 38,491 | 0.6 | 1,929,000 | 30.5 | 4,348,000 | 68.8 | 4,349,000 | 100.0 |
| 2003 | 38,477 | 0.6 | 1,925,000 | 30.4 | 4,365,000 | 69.0 | 6,328,000 | 100.0 |
| 2004 | 38,444 | 0.6 | 1,862,000 | 30.1 | 4,281,000 | 69.3 | 6,181,000 | 100.0 |
| 2005 | 39,252 | 0.6 | 1,816,000 | 29.5 | 4,304,000 | 69.9 | 6,159,000 | 100.0 |
| 2006 | 38,588 | 0.6 | 1,746,000 | 29.2 | 4,189,000 | 70.1 | 5,973,000 | 100.0 |
| 2007 | 37,435 | 0.6 | 1,711,000 | 28.4 | 4,275,000 | 71.0 | 6,024,000 | 100.0 |
| 2008 | 34,017 | 0.6 | 1,630,000 | 28.1 | 4,146,000 | 71.4 | 5,811,000 | 100.0 |
Exhibit 5-2 describes the considerable improvement in highway safety since Federal legislation first addressed the issue in 1966. That year, the fatality rate was 5.50 fatalities per 100 million vehicle miles traveled (VMT). By 2008, the fatality rate had declined to 1.25 per 100 million VMT. This sharp decline in the fatality rate occurred even as the number of licensed drivers doubled over that same period.
| Year | Fatalities | Resident Population (Thousands) | Fatality Rate per 100,000 Population | Licensed Drivers (Thousands) | Fatality Rate per 100 Million VMT | Injured | Injury Rate per 100,000 Population | Injury Rate per 100 Million VMT |
|---|---|---|---|---|---|---|---|---|
| 1966 | 50,894 | 196,560 | 25.89 | 100,998 | 5.50 | |||
| 1968 | 52,725 | 200,706 | 26.27 | 105,410 | 5.20 | |||
| 1970 | 52,627 | 205,052 | 25.67 | 111,543 | 4.74 | |||
| 1972 | 54,589 | 209,896 | 26.01 | 118,414 | 4.30 | |||
| 1974 | 45,196 | 213,854 | 21.13 | 125,427 | 3.50 | |||
| 1976 | 45,523 | 218,035 | 20.88 | 134,036 | 3.25 | |||
| 1978 | 50,331 | 222,585 | 22.61 | 140,844 | 3.26 | |||
| 1980 | 51,091 | 227,225 | 22.48 | 145,295 | 3.35 | |||
| 1982 | 43,945 | 231,664 | 18.97 | 150,234 | 1.76 | |||
| 1984 | 44,257 | 235,825 | 18.77 | 155,424 | 2.57 | |||
| 1986 | 46,087 | 240,133 | 19.19 | 159,486 | 2.51 | |||
| 1988 | 47,087 | 244,499 | 19.26 | 162,854 | 2.32 | 3,416,000 | 1,397 | 169 |
| 1990 | 44,599 | 249,439 | 17.88 | 167,015 | 2.08 | 3,231,000 | 1,295 | 151 |
| 1992 | 39,250 | 254,995 | 15.39 | 173,125 | 1.75 | 3,070,000 | 1,204 | 137 |
| 1994 | 40,716 | 260,327 | 15.64 | 175,403 | 1.73 | 3,266,000 | 1,255 | 139 |
| 1996 | 42,065 | 265,229 | 15.86 | 179,539 | 1.69 | 3,483,000 | 1,313 | 140 |
| 1998 | 41,501 | 270,248 | 15.36 | 184,861 | 1.58 | 3,192,000 | 1,181 | 121 |
| 2000 | 41,945 | 282,192 | 14.86 | 190,625 | 1.53 | 3,189,000 | 1,130 | 116 |
| 2002 | 43,005 | 288,126 | 14.93 | 194,602 | 1.51 | 2,926,000 | 1,017 | 102 |
| 2004 | 42,836 | 293,638 | 14.59 | 198,889 | 1.44 | 2,788,000 | 952 | 94 |
| 2006 | 42,708 | 299,398 | 14.24 | 202,810 | 1.42 | 2,575,000 | 863 | 85 |
| 2008 | 37,261 | 304,060 | 12.25 | 208,321 | 1.25 | 2,346,000 | 771 | 80 |
While the overall number of fatalities dropped by more than 20 percent in 20 years (between 1988 and 2008), the overall number of traffic-related injuries also decreased by more than 31 percent during that same period (from 3,416,000 to 2,346,000). Injuries increased between 1992 and 1996, but have steadily declined since then. In 1988, the injury rate was 169 per 100 million VMT; by 2008, the number had dropped (by more than 52 percent) to 80 per 100 million VMT.
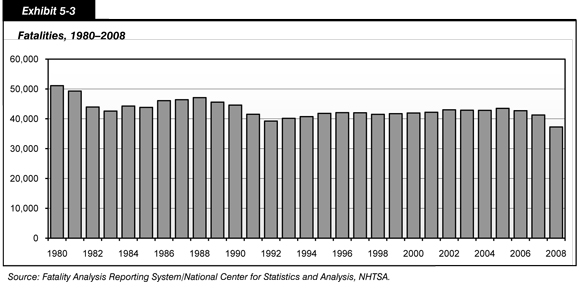
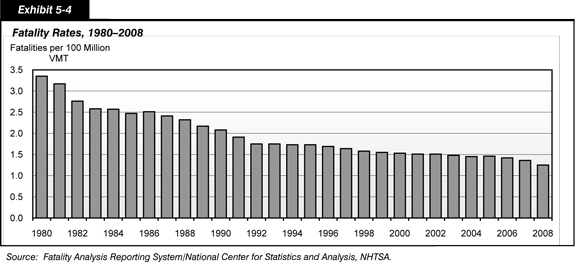
The overall number of traffic deaths also decreased between 1966 and 2008. In 1966, there were 50,894 traffic deaths. Fatalities reached their highest point in 1972 with 54,589 fatalities, then declined sharply following the implementation of a national speed limit, reaching a record low point of 39,250 fatalities in 1992. Between 1992 and 2006, there was more limited progress in reducing the number of fatalities. The number of fatalities generally increased year-to-year from 1992 to 2006, when 42,708 Americans lost their lives in crashes. However, in 2008, there was a record low number of fatalities (37,261), the lowest number since 1966. Exhibit 5-3 and Exhibit 5-4 compare the number of fatalities with fatality rates between 1980 and 2008.
| What information is available for highway fatalities in 2009? | |
|
In 2009, highway deaths fell to 33,808 for the year, a 9.7 percent decrease from 2008, and the lowest number since 1950. The record-breaking decline in traffic fatalities occurred even while estimated VMT in 2009 increased by 0.2 percent over 2008 levels. For the first time in 11 years, motorcycle fatalities also declined by 24 percent, with a reduction of 850 deaths from the previous year.
In addition, 2009 saw the lowest fatality and injury rates ever recorded with 1.13 deaths per 100 million VMT traveled in 2009, compared with 1.26 deaths for 2008.
Additional information on the 2009 data can be found in the latest version of the Traffic Safety Facts, which can be viewed at http://www-nrd.nhtsa.dot.gov/Pubs/811363.pdf. The information provided throughout this chapter as well as the information used to compile the NHTSA Traffic Safety Facts draws primarily from the Fatality Analysis Reporting System (FARS). The FARS contains data on the fatal traffic crashes submitted by the 50 States, the District of Columbia, and Puerto Rico.
|
|
Fatalities by Functional Class
Exhibit 5-5 and Exhibit 5-6 show the number of fatalities and fatality rates by rural and urban functional system between 2000 and 2008. These exhibits show the distinction between fatalities and fatality rates.
| Functional System | 2000 | 2002 | 2004 | 2006 | 2008 | Percent Change 2008/2000 |
|---|---|---|---|---|---|---|
| Rural Areas (under 5,000 in population) | ||||||
| Interstate | 3,254 | 3,298 | 3,227 | 2,887 | 2,416 | -25.8% |
| Other Principal Arterial | 4,917 | 4,894 | 5,167 | 4,554 | 4,358 | -11.4% |
| Minor Arterial | 4,090 | 4,467 | 5,043 | 4,346 | 3,515 | -14.1% |
| Major Collector | 5,501 | 6,014 | 5,568 | 5,675 | 5,068 | -7.9% |
| Minor Collector | 1,808 | 2,003 | 1,787 | 1,650 | 1,423 | -21.3% |
| Local | 4,414 | 5,059 | 4,162 | 4,294 | 4,027 | -8.8% |
| Unknown Rural | 854 | 161 | 225 | 240 | 98 | -88.5% |
| Subtotal Rural | 24,838 | 25,896 | 25,179 | 23,646 | 20,905 | -15.8% |
| Urban Areas (5,000 or more in population) | ||||||
| Interstate | 2,419 | 2,482 | 2,602 | 2,663 | 2,259 | -6.6% |
| Other Freeway and Expressway | 1,364 | 1,506 | 1,673 | 1,690 | 1,505 | 10.3% |
| Other Principal Arterial | 4,948 | 5,124 | 4,847 | 5,447 | 4,446 | -10.1% |
| Minor Arterial | 3,211 | 3,218 | 3,573 | 3,807 | 3,105 | -3.3% |
| Collector | 1,001 | 1,151 | 1,385 | 1,513 | 1,239 | 23.8% |
| Local | 2,912 | 3,497 | 3,290 | 3,622 | 3,402 | 16.8% |
| Unknown Urban | 258 | 35 | 211 | 49 | 27 | -89.5% |
| Subtotal Urban | 16,113 | 17,013 | 17,581 | 18,791 | 15,983 | -0.8% |
| Unknown Rural or Urban | 994 | 96 | 76 | 271 | 373 | -62.5% |
| Total Highway Fatalities | 41,945 | 43,005 | 42,836 | 42,708 | 37,261 | -11.2% |
As shown in Exhibit 5-5, the absolute number of fatalities grew slightly between 2000 and 2006 and then declined to 37,261 deaths in 2008. During this period (from 2000 to 2008), the number of fatalities on urban roads decreased from 16,113 to 15,983 (a reduction of almost 1 percent). At the same time, the number of fatalities on rural roads decreased from 24,838 to 20,905 (a reduction of almost 16 percent). In 2008, fatalities from urban crashes accounted for 43 percent of all fatalities, while those resulting from rural crashes accounted for 56 percent.1 The fatality rate, however, decreased on both urban and rural roads since 2000, due in part to a combination of safety countermeasures and programs introduced by DOT and State partners, as well as a decrease in VMT between 2007 and 2008.
| What steps are being taken to improve safety on the Nation's rural roads? | |
|
Rural road safety is a particular concern, as the majority of highway fatalities take place on rural roads. FHWA works closely with highway safety partners at the National, State, and local levels to highlight available options to help reduce highway fatalities and injuries on the nation's rural roads. There are a variety of initiatives currently underway to address issues relating to rural road safety. These include assistance to rural road owners, partners and stakeholders through forums, workshops, a web-based clearinghouse, publishing guidelines and peer-to-peer technical support.
|
|
|
High Risk Rural Roads (HRRR) Program SAFETEA-LU created HRRR to help improve rural road safety by funding rural construction and operational improvement projects, such as adding or expanding shoulders, straightening dangerous curves, and improving hazardous intersections. FHWA developed additional information on the program which can be found in the Guide for High Risk Rural Road Program Implementation, available at http://safety.fhwa.dot.gov/local_rural/training/fhwasa10012/fhwasa10012.pdf. |
|
Rural Safety Innovation Program FHWA launched this program in 2008 to improve rural road safety. Twenty-one rural safety projects were selected in 14 States, 3 counties, and 2 parishes to receive a total of $14.7 million. Nine projects focused on application of low-cost safety countermeasures and 12 focused on applying an Intelligent Transportation System to improve rural safety. As projects are completed and evaluated, good practices will be shared with the rural road safety community. |
Exhibit 5-6 shows the fatality rates for every urban and rural functional system between 2000 and 2008. Urban Interstate highways were the safest functional system, with a fatality rate of 0.47 per 100 million VMT in 2008. Among urban roads, Interstate highways and other principal arterials recorded the sharpest declines in fatality rates over this 8-year period, as each experienced an overall reduction of approximately 23 percent.
| Functional System | 2000 | 2002 | 2004 | 2006 | 2008 | Percent Change 2008/2000 |
|---|---|---|---|---|---|---|
| Rural Areas (under 5,000 in population) | ||||||
| Interstate | 1.21 | 1.18 | 1.21 | 1.12 | 0.99 | -18.2% |
| Other Principal Arterial | 1.98 | 1.90 | 2.14 | 1.96 | 1.96 | -1.0% |
| Minor Arterial | 2.38 | 2.53 | 2.99 | 2.67 | 2.31 | -2.9% |
| Major Collector | 2.63 | 2.82 | 2.77 | 2.94 | 2.72 | 3.4% |
| Minor Collector | 3.12 | 3.26 | 2.97 | 2.84 | 2.59 | -17.0% |
| Local | 3.45 | 3.63 | 3.14 | 3.22 | 3.06 | -11.3% |
| Subtotal Rural | 2.34 | 2.30 | 2.36 | 2.29 | 2.13 | -9.0% |
| Urban Areas (5,000 or more in population) | ||||||
| Interstate | 0.61 | 0.61 | 0.57 | 0.56 | 0.47 | -23.0% |
| Other Freeway and Expressway | 0.77 | 0.79 | 0.80 | 0.78 | 0.68 | -11.7% |
| Other Principal Arterial | 1.24 | 1.25 | 1.08 | 1.17 | 0.96 | -22.6% |
| Minor Arterial | 0.99 | 0.95 | 0.99 | 1.01 | 0.82 | -17.2% |
| Collector | 0.74 | 0.81 | 0.85 | 0.87 | 0.71 | -4.1% |
| Local | 1.24 | 1.46 | 1.29 | 1.36 | 1.26 | 1.6% |
| Subtotal Urban | 0.99 | 0.99 | 0.93 | 0.96 | 0.81 | -18.2% |
| Total Highway Fatality Rate | 1.53 | 1.51 | 1.45 | 1.42 | 1.25 | -18.3% |
The overall fatality rate decreased by 9 percent on rural roads between 2000 and 2008. Among rural roads, Interstate highways and minor collectors recorded the sharpest declines in fatality rates over this period. The fatality rate for rural minor collectors in 2008 was 17 percent lower than in 2000. Likewise, the fatality rate for rural Interstates dropped by 18 percent over the same period. Despite the overall decrease in fatality rate on both urban and rural functional systems, rural roads are far more dangerous than their urban counterparts. A number of factors collectively result in this rural road safety challenge, such as greater curvature and obstacles close to the roadway, designs that contribute to roadway departure, and higher levels of speeding on nonseparated roadways.
|
Rural Highway Knowledge Resource Program Initiated in 2009, this $1.2-million program addresses the issue of local and rural safety through outreach and the demonstration and evaluation of innovative solutions. Outreach is aimed at actively engaging public decision makers through workshops and forums, providing easy-to-understand technical information and guidance, improving the Rural Highway Safety Clearinghouse, and providing peer-to-peer technical support. |
|
Rural Safety Clearinghouse and Center of Excellence for Rural Safety Established in June 2008, this web-based clearinghouse at http://www.ruralhighwaysafety.org links to a growing collection of rural road safety documents and resources. Another rural safety website is the Center for Excellence in Rural Safety at http://www.ruralsafety.umn.edu. The University of Minnesota developed the site through sponsorship by the FHWA and funding by SAFETEA-LU Section 5309. |
|
Emergency Response Time in Rural Areas The 2008 NHTSA Traffic Safety Facts: Rural/Urban Comparison publication indicates: “In 2008, 24,175 drivers were killed in fatal crashes. Of those, 64 percent of rural and 51 percent of urban drivers died at the scene. Data also shows that 39 percent of all drivers killed were transported to the hospital and 6 percent of these drivers died en route. Unfortunately, rural drivers represented 52 percent of drivers who died en route to the hospital versus 48 percent of urban drivers.” Timely emergency response and treatment can be challenging in rural areas, which has an impact on fatality rates. The December 2006 NHTSA publication, Traffic Crashes Take Their Toll on America's Rural Roads, indicates that it takes emergency personnel an average of 19 minutes to arrive at a crash scene in a rural area, compared with 7 minutes in an urban area. The total time from occurrence of a crash to arrival at the hospital averages 53 minutes in rural areas in contrast to 36 minutes in urban areas. The time to get a crash victim emergency care and transported to a hospital is critical as many medical experts consider the first 60 minutes after the occurrence of a trauma the “golden hour” and the most critical time period for saving lives. |
Highway Fatalities by Major Crash Type or Contributing Factors
The total economic cost of crashes was estimated at $230.6 billion in 2000. Motor vehicle crashes cost society an estimated $7,300 per second. When a crash occurs, it is generally the result of numerous contributing factors. Driver, roadway, and vehicle factors all have an impact on the safety of the Nation's highway system. The FHWA is focused on reducing four types of roadway-related crashes: roadway departures and intersection incidents, pedestrian, and speeding-related crashes. Exhibit 5-7 shows data for these crash types between 2000 and 2008. These categories are not mutually exclusive; the fatalities shown in Exhibit 5-7 can involve a combination of factors—intersection- and pedestrian-related, for example—so that some fatalities appear in more than one category.
| 2000 | 2002 | 2004 | 2006 | 2008 | Percent Change 2008/2000 | |
|---|---|---|---|---|---|---|
| Roadway Departures1, 2 | 23,046 | 25,415 | 22,340 | 22,665 | 19,794 | -14.1% |
| Intersection-Related1 | 8,689 | 9,273 | 9,176 | 8,850 | 7,772 | -10.6% |
| Pedestrian-Related1 | 4,763 | 4,851 | 4,675 | 4,795 | 4,378 | -8.1% |
| Speeding-Related1 | 12,552 | 13,799 | 13,291 | 13,609 | 11,674 | -7.0% |
2 Definition for roadway departure crashes was modified beginning in 2004.
Roadway Departures
In 2008, there were 19,794 fatalities related to a vehicle leaving the roadway and crashing. In some cases, the vehicle crossed the centerline and struck another vehicle, hitting it head-on or sideswiping it. In other cases, the vehicle left the roadway and struck one or more man-made or natural objects, such as utility poles, embankments, guardrails, trees, or parked vehicles.
Roadway departures occur because of human factors, roadway design factors, and environmental factors. Human factors include driving while intoxicated, driver distraction, driver fatigue, and driver drowsiness. It is widely recognized that drunk drivers can create hazardous driving conditions, but a drowsy driver can be as dangerous as a drunk driver.
| What's happening regarding distracted driving prevention at USDOT? | |
|
The USDOT is leading an effort to share knowledge and promote a greater understanding of the issue pertaining to distracted driving.
In September 2010, the Department convened the second National Distracted Driving Summit. The Summit brought together leading transportation officials, safety experts, researchers, industry representatives, and victims of distraction-related crashes to take stock of progress made, reassess the challenges still faced, and determine steps that should be taken moving forward in national anti-distracted driving efforts.
USDOT has also called on State and local governments to help to reduce fatalities and crashes by making distracted driving part of their state highway plans.
Public service announcements have been aired across the Nation to educate drivers and remind them to keep their focus on the roads. In addition, USDOT has launched a website, www.distraction.gov, where the public can locate information and resources on the issue.
|
|
Some roadway departures can be attributed to drivers being distracted while attempting to operate mobile devices in their vehicles, causing them to drift out of the lane and off the road. Research shows that using a cell phone while driving can pose a serious cognitive distraction that degrades driver performance. Distracted driving can be caused by anything that makes drivers take their eyes off the road or hands off the steering wheel, or that interrupts concentration. In 2008, a total of 5,870 fatalities and 515,000 injuries involved distracted driving. This accounts for 16 percent of total fatalities in 2008. Even the use of hands-free devices can impair drivers' reaction times. The available research indicates that operating either a hands-free or hand-held cell phone can present cognitive distraction significant enough to degrade a driver's performance, potentially causing a driver to miss key visual and audio cues needed to avoid a crash.
The majority of roadway departure crashes happen at night. About two-thirds of roadway departure fatalities occur on rural roads. Rural highways are often not as well-lit as urban roadways and are often designed with narrow travel lanes, sharp roadway curvatures, or unimproved shoulders. Environmental factors including inclement weather such as fog, snow, smoke, or dust storms can also decrease the visibility of pavement markings or roadway curvature. In 2008, about 17 percent of all crashes were attributed at least in part to weather conditions. Of the 19,794 total roadway departure fatalities that occurred in 2008, more than 45 percent involved the rollover of a passenger vehicle.
As shown in Exhibit 5-8, the total number of fatalities in rollover crashes has decreased, from 9,962 in 2000 to 9,007 in 2008 (a decrease of about 10 percent), with the number of fatalities varying by vehicle type. While the number of fatalities in rollovers among cars decreased, from 4,549 in 2000 to 3,640 in 2008 (a 20 percent decrease), the number of fatalities in rollovers among light (sport) utility trucks grew from 2,064 in 2000 to 2,414 in 2008 (an increase of 17 percent) at the same time the fatality rate from rollovers in light utility trucks decreased from 9.61 to 5.96 while the number of these vehicles almost doubled. The number of fatalities in rollovers among pickup trucks for the same period decreased by more than 5 percent (from 2,558 in 2000 to 2,424 in 2008). Among vans, fatalities related to rollover crashes decreased by 33 percent (from 770 in 2000 to 515 in 2008).
| Fatalities | Registered Passenger Vehicles | Fatality Rate per 100,000 Registered Vehicles | |
|---|---|---|---|
| 2000 | |||
| Passenger Cars | 4,549 | 133,621,420 | 3.40 |
| Light Pickup Trucks | 2,558 | 38,216,835 | 6.69 |
| Light Utility Trucks | 2,064 | 21,466,592 | 9.61 |
| Vans | 770 | 17,250,102 | 4.46 |
| Other Light Trucks | 21 | 863,298 | 2.43 |
| Total | 9,962 | 211,418,247 | 4.71 |
| 2008 | |||
| Passenger Cars | 3,640 | 137,079,843 | 2.66 |
| Light Pickup Trucks | 2,424 | 40,158,416 | 6.04 |
| Light Utility Trucks | 2,414 | 40,519,012 | 5.96 |
| Vans | 515 | 18,445,139 | 2.79 |
| Other Light Trucks | 14 | 447,765 | 3.13 |
| Total | 9,007 | 236,650,175 | 3.81 |
| Percent Change | -9.6% | 11.9% |
In 2008 fatal crashes in which a rollover occurred, the occupant fatality rate for light pickup trucks was six per 100,000 registered vehicles. Likewise, the rate per 100,000 registered vehicles was almost six for light utility trucks, three for other light trucks, and almost three for vans. Passenger cars had the lowest fatality rate for rollover crashes, when compared with other vehicle types.
Intersections
Of the 37,261 fatalities that occurred in 2008, about 21 percent—7,772—occurred at intersections, of which at least 39.2 percent were at rural intersections and at least 60.8 percent urban, as shown in Exhibit 5-9.
| Fatalities: Count | Fatalities: Percent of Total | |
|---|---|---|
| Rural Areas (under 5,000 in population) | ||
| Principal Arterials | 851 | 11.1% |
| Minor Arterials | 630 | 8.2% |
| Collectors (Major and Minor) | 915 | 11.9% |
| Locals | 612 | 8.0% |
| Subtotal Rural Areas | 3,008 | 39.2% |
| Urban Areas (5,000 or more in population) | ||
| Principal Arterials | 2,088 | 27.2% |
| Minor Arterials | 1,136 | 14.8% |
| Collectors (Major and Minor) | 405 | 5.3% |
| Locals | 1,031 | 13.4% |
| Subtotal Urban Areas | 4,660 | 60.8% |
| Total Highway Fatalities* | 7,668 | 100.0% |
Intersection-related crashes accounted for nearly 40 percent of all police-reported crashes and approximately 47 percent of all people injured in 2008. Older drivers and pedestrians are particularly at risk at intersections; 40 percent of the traffic fatalities among drivers aged 80 or older and more than one-third of the pedestrian deaths among people aged 70 or older were intersection-related.
There are more than 3 million intersections in the United States, including both signalized and nonsignalized (e.g., those controlled by stop or yield signs); and many factors may contribute to unsafe conditions at these areas. Road designs may be inadequate for current traffic levels or traffic signals may not be optimally programmed. Approximately one-third of signalized intersection fatalities involve red-light running.
|
Intersection Safety – Law Enforcement Education and law enforcement are important components of intersection safety. Automated enforcement at red lights is increasingly being used in States and cities to supplement limited police manpower. It is believed that red-light cameras are presently being used in more than 400 communities in the United States. |
| How are Federal, State, and local transportation agencies working to improve intersection safety? | |
|
Engineering improvements can greatly enhance safety at intersections. At stop-controlled intersections, adding advance warning signs on each approach, doubling up advance warning and stop signs, and making the signs larger have all been shown to assist motorists in recognizing that there is an intersection ahead. Adding flashing beacons to the signs further enhances recognition of an intersection and the driver's action that is required. Providing turn lanes may be warranted on the major road at stop-controlled intersections.
|
|
|
Intersection Safety—Roundabouts Increased usage of modern roundabouts, which offer substantial safety and operational benefits over traditional intersections, are being promoted as a proven safety countermeasure. The AASHTO Highway Safety Manual includes Crash Modification Factors that show the overall safety effectiveness of roundabouts at over 40 percent fewer crashes and nearly 80 percent fewer injuries and fatalities as compared with stop- and signal-controlled intersections. It is estimated that there are currently between 1,500 and 2,000 roundabouts in the United States, with the number increasing steadily. More information on roundabouts can be found in the comprehensive national reference, Roundabouts: An Informational Guide, Second Edition, located at (http://onlinepubs.trb.org/onlinepubs/nchrp/nchrp_rpt_672.pdf). |
Pedestrians and Other Nonmotorists
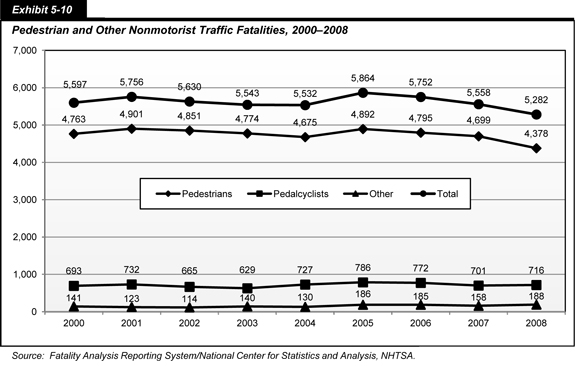
Exhibit 5-10 displays nonmotorist traffic fatalities that occurred between 2000 and 2008. For the purposes of this report, the term “nonmotorist” refers to pedestrians, pedalcyclists (such as bicyclists), and other nonmotorists (such as skateboarders and roller skaters).
The number of nonmotorist fatalities decreased from 5,597 in 2000 to 5,282 in 2008, a 5.6 percent decrease in 8 years. While the number of pedestrians killed by motor vehicle crashes has decreased by 8 percent over this period, the number of pedalcyclists and other nonmotorists killed has increased by 3 percent and 33 percent, respectively. Still, in 2008, 82.8 percent of all nonmotorist fatalities were pedestrians. About 13.5 percent were pedalcyclists, and the remaining 3.5 percent were other nonmotorists. More than 13 percent of the nonmotorist crash fatalities were alcohol-related in 2008, where a driver or motorcycle operator had a blood alcohol concentration (BAC) of 0.08 gram per deciliter (g/dL) or greater.
The number of nonmotorists injured in crashes in 2008 was 130,000. This constitutes almost 6 percent of total crash-related injuries. Pedestrians represented 53 percent (69,000) of these injuries, while pedalcyclists represented 40 percent (52,000). Of the total injuries sustained by nonmotorists, 16 percent were incapacitating injuries (21,000), usually defined as inability to walk, drive, or continue other normal activities.
Alcohol
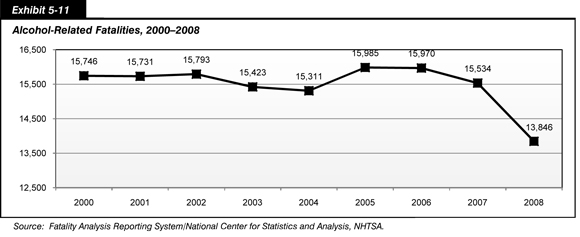
Alcohol-related driving is a serious public safety problem in the United States. In 2008, 13,846 Americans were killed in alcohol-related crashes on the Nation's highways. The NHTSA estimates that alcohol was involved in 41 percent of fatal crashes in 2008.
Exhibit 5-11 shows the number of fatalities attributable to alcohol between 2000 and 2008. Trends remained somewhat consistent in the number of alcohol-related fatalities during the period between 2000 and 2007; the number of alcohol-related fatalities declined by 10.9 percent from 2007 to 2008.
In 2008, there were 13,846 fatalities in which either the driver or motorcycle operator had a BAC of 0.01 g/dL or greater. Of all fatalities attributable to alcohol in 2008, 27 percent occurred between the hours of midnight and 3 a.m.; alcohol-related fatalities represent 64 percent of all fatalities that occurred during those hours. Of the fatalities from crashes that involved a driver with a BAC of 0.08 g/dL (alcohol-impaired) or higher, 43 percent (3,432) involved a driver between the ages of 21 and 34 years old. The age group of drivers 20 and younger made up 9 percent of the total. Underage drinking and driving continues to be a major problem, despite years of education and law enforcement programs.
|
Impaired Driving The U.S. DOT works to discourage impaired driving through a three-pronged strategy: high-visibility law enforcement and education, enhanced prosecution and adjudication, and medical screening and brief intervention for alcohol abuse problems. Special emphasis is placed on reaching high-risk populations, including those under age 21, those 21–34, repeat offenders, and high-BAC (blood alcohol concentration) offenders. |
Speeding
Speeding is one of the most prevalent factors contributing to traffic crashes. The economic cost to society of speeding-related crashes is estimated by NHTSA to be $40.4 billion per year. In 2008, speeding was a contributing factor in 31 percent of all fatal crashes; 11,674 lives were lost in speeding-related crashes. In 2008, 35 percent of all motorcycle riders involved in fatal crashes were speeding, compared with 23 percent for passenger car drivers, 19 percent for light-truck drivers, and 8 percent for large-truck drivers.
In 2000, the cost of speeding-related crashes was estimated to be $76,865 per minute or $1,281 per second. Speeding reduces a driver's ability to steer safely around curves or objects in the roadway, extends the distance necessary to stop a vehicle, and increases the distance a vehicle travels while the driver reacts to a dangerous situation.
For drivers involved in fatal crashes, young males are the most likely to be speeding. The relative proportion of speeding-related crashes to all crashes decreases with increasing driver age. In 2008, 37 percent of male drivers in the 15- to 24-year-old age groups who were involved in fatal crashes were reported to be speeding at the time of the crash.
As shown by cases for which blood alcohol data are available, alcohol involvement is prevalent for drivers involved in speeding-related crashes. In 2008, 41 percent of drivers with a BAC of 0.08 g/dL or higher involved in fatal crashes were speeding, compared with only 15 percent of drivers with a BAC of 0.00 g/dL involved in fatal crashes. In 2008, 27 percent of the speeding drivers under age 21 who were involved in fatal crashes also had a BAC of 0.08 g/dL or higher. In contrast, only 12 percent of the nonspeeding drivers under age 21 involved in fatal crashes in 2008 had a BAC of 0.08 g/dL or higher.
Many speeding-related crashes are coupled with poor weather conditions. Speeding was a factor in 54 percent of the fatal crashes that occurred when there was snow or slush on the road and in 59 percent of those that occurred on icy roads. Speeding was a factor in 35 percent of those that occurred on wet roads.
Nearly one-half of all fatal crashes in 2008 occurred on roads with posted speed limits of 55 miles per hour or more, as compared with 23 percent of injury crashes and 23 percent of property-damage-only crashes. Although much of the public concern about speed-related crashes focuses on high-speed roadways, speeding is a safety concern on all roads. In 2008, about 22 percent (10,812) of drivers involved in fatal crashes were cited for driving too fast for conditions or in excess of posted speed limits—the second-highest driver factor cited for all fatal crashes.
While speeding has often been seen as a prevalent occurrence on major highways, 88 percent of speeding-related fatalities occurred on roads that were not Interstate System highways in 2008.
Crashes and Fatalities by Vehicle Type
Exhibit 5-12 shows the breakdown of occupant fatalities by vehicle type from 2000 to 2008. The number of occupant fatalities that involved passenger cars decreased from 20,699 in 2000 to 14,587 in 2008 (a decrease of 30 percent).
The number of occupant fatalities in light trucks decreased from 11,528 in 2000 to 10,764 in 2008 (a decrease of 6.6 percent). There were approximately 768,000 light-truck occupants injured in 2008, down from 886,566 in 2000.
The number of occupant fatalities in large trucks decreased by 10 percent, from 754 in 2000 to 677 in 2008. While occupants of large trucks represent less than 2 percent of all highway fatalities, total fatalities from crashes that involve large trucks (including both the occupants of large trucks and others killed in crashes involving large trucks) account for more than 11 percent of all highway fatalities. The number of all other vehicle occupants killed in crashes involving a large truck decreased by 24 percent, from 4,114 in 2000 to 3,139 in 2008. Approximately 90,000 people were injured in crashes involving large trucks in 2008.
| Type of Vehicle | 2000 | 2002 | 2004 | 2006 | 2008 | Percent Change 2008/2000 |
|---|---|---|---|---|---|---|
| Motorists | ||||||
| Passenger Cars | 20,699 | 20,569 | 19,192 | 17,800 | 14,587 | -29.5% |
| Light Trucks | 11,528 | 12,273 | 12,674 | 12,722 | 10,764 | -6.6% |
| Large Trucks | 754 | 689 | 766 | 805 | 677 | -10.2% |
| Motorcycles | 2,897 | 3,270 | 4,028 | 4,810 | 5,290 | 82.6% |
| Buses | 22 | 45 | 42 | 27 | 67 | 204.5% |
| Other and Unknown Vehicles | 448 | 529 | 602 | 738 | 594 | 32.6% |
| Nonmotorists | ||||||
| Pedestrians | 4,763 | 4,851 | 4,675 | 4,784 | 4,378 | -8.1% |
| Pedalcyclists | 693 | 665 | 727 | 773 | 716 | 3.3% |
| Other and Unknown | 141 | 114 | 130 | 183 | 188 | 33.3% |
| Total | 41,945 | 43,005 | 42,836 | 42,642 | 37,261 | -11.2% |
The most significant, consistent increase in fatalities among vehicle types involved those who ride motorcycles. The number of motorcyclists who died in crashes increased each year between 2000 and 2008, rising by almost 83 percent over 8 years from 2,897 to 5,290. Motorcycle crashes are frequently speed-related. Speed is two times more likely to be a factor in fatal motorcycle crashes than in passenger car or light truck crashes. Studies also have shown that alcohol is more likely to be a factor in motorcycle crashes than in passenger car or light truck crashes.
Exhibit 5-13 describes the breakdown of occupant injuries between 2000 and 2008. The number of injuries decreased for passenger cars, buses, light trucks, and large trucks during that period. Injuries for motorcycle riders drastically increased during this same period, rising from 57,723 to approximately 96,000, an increase of more than 66 percent over 8 years.
| Type of Vehicle | 2000 | 2002 | 2004 | 2006 | 2008 | Percent Change 2008/2000 |
|---|---|---|---|---|---|---|
| Motorists | ||||||
| Passenger Cars | 2,051,609 | 1,804,788 | 1,642,549 | 1,474,536 | 1,304,000 | -36.4% |
| Light Trucks | 886,566 | 879,338 | 900,171 | 856,896 | 768,000 | -13.4% |
| Large Trucks | 30,832 | 26,242 | 27,287 | 22,815 | 23,000 | -25.4% |
| Motorcycles | 57,723 | 64,713 | 76,379 | 87,652 | 96,000 | 66.3% |
| Buses | 17,769 | 18,819 | 16,410 | 9,839 | 15,000 | -15.6% |
| Other and Unknown Vehicles | 10,120 | 6,187 | 7,262 | 10,843 | 9,000 | -11.1% |
| Nonmotorists | ||||||
| Pedestrians | 78,000 | 71,000 | 68,000 | 61,000 | 69,000 | -11.5% |
| Pedalcyclists | 51,000 | 48,000 | 41,000 | 44,000 | 52,000 | 2.0% |
| Other and Unknown Vehicles | 5,000 | 7,000 | 9,000 | 7,000 | 9,000 | 80.0% |
| Total | 3,188,619 | 2,926,087 | 2,788,058 | 2,574,581 | 2,345,000 | -26.5% |
Transit Safety
Transit operators report safety information to the National Transit Database for three major categories: incidents, injuries, and fatalities. In 2002, the Federal Transit Administration revised the definitions of an “incident” and an “injury.” Given that there is no “statistical bridge” across the change in definitions, this chapter provides only injury and incident data from 2002 onward. Data on injuries and incidents prior to 2002, which are not comparable with the new data, are available in the 2004 C&P Report.
| What sort of events result in a recorded transit incident? | |
|
A transit agency records an incident for any event occurring on transit property, onboard or involving transit vehicles, or to persons using the transit system that results in one of the following:
Additionally, an incident is recorded by a transit agency whenever one of the following security situations occurs on transit property, onboard or involving transit vehicles, or to persons using the transit system:
|
|
An incident is recorded by a transit agency for a variety of events occurring on transit property or vehicles, involving transit vehicles, or to persons using the transit system. Included among these is any event that results in significant property damage, one or more reported injuries, one or more reported fatalities, or some combination thereof. Since 2002, the definition of “significant property damage” has been total property damage in excess of $7,500 (in current-year dollars, not indexed to inflation).
Since 2002, an injury has been reported only when a person has been immediately transported away from the scene of a transit incident for medical care. Any event producing a reported injury is also reported as an incident.
The definition of a transit-related fatality was not revised in 2002. A transit-related fatality is reported for any death occurring within 30 days of a transit incident which is confirmed to be a result of that incident. Fatality data are provided from 2000 through 2008.
Injuries and fatalities include those suffered by riders, as well as those suffered by pedestrians, bicyclists, and people in other vehicles. Injuries and fatalities may occur while traveling on transit or while boarding, alighting, or waiting for transit vehicles to arrive. An injury or fatality may also occur while not using transit, such as in the cases of being struck by a transit vehicle or, in the case of a collision, in a transit station parking lot.
Exhibit 5-15 shows annual fatalities for transit services in both absolute numbers and adjusted according to the number of passenger miles traveled (PMT) in each year for 2000 to 2008. Fatality numbers include reported incidents on commuter rail, heavy rail, light rail, demand response, and motor bus but exclude suicides and homicides. Both the count of 216 fatalities for 2008 and the rate of 0.42 fatalities per 100 million passenger miles demonstrate that transit is an extremely safe mode of transportation. With the fatality count steadily trending down since 2002, it experienced an unexplained increase of 30 deaths in 2007. This significant increase was not the result of any single incident. The fatality count in 2008 dropped back to the pre-2007 levels in spite of the September 13, 2008, collision between a Metrolink commuter train and a Union Pacific freight train in Chatsworth, California, that killed 25 and injured 135.
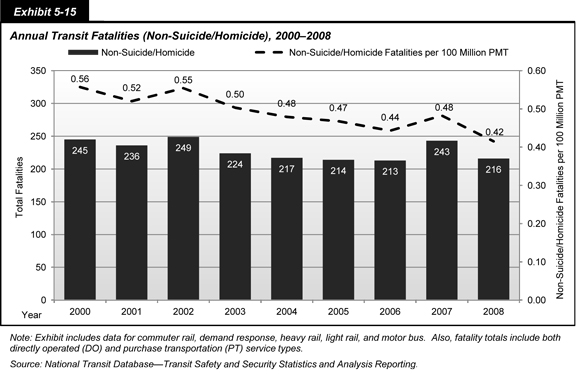
Exhibit 5-16 provides total incidents and injuries both in absolute terms and per 100 million PMT. A trend toward fewer incidents is apparent over the most recent 3 years, but there is no comparable downward trend in injuries. It is notable that the injury rate was low in 2007, even though the fatality rate was high that year. Exhibit 5-17 lists injuries and fatalities for the most significant light and heavy rail transit accidents for 2008, 2009, and 2010. As this exhibit indicates, the total injuries and fatalities in this time period are due to numerous accidents and no one accident accounts for the majority of the total; therefore, increases in annual injury and fatality rates are not merely the result of one or two bad incidents. However, multi-injury incidents (like the above-mentioned Chatsworth collision) must account for the absolute number of injuries being greater than the number of incidents in 2008.
| Year | Incidents | Injuries | ||
|---|---|---|---|---|
| Total | Per 100 Million PMT | Total | Per 100 Million PMT | |
| 2004 | 24,031 | 58.00 | 20,439 | 49.33 |
| 2005 | 23,578 | 56.71 | 19,201 | 46.18 |
| 2006 | 25,572 | 59.07 | 20,857 | 48.17 |
| 2007 | 25,525 | 50.67 | 23,567 | 45.32 |
| 2008 | 24,898 | 47.88 | 26,228 | 50.43 |
| Agency | Date | Mode | Injuries | Fatalities |
|---|---|---|---|---|
| Washington Metropolitan Area Transit Authority | 3-Oct-09 | Heavy Rail | 70 | 9 |
| Miami-Dade Transit | 4-Mar-09 | Heavy Rail | 3 | 3 |
| MTA New York City Transit | 2-Apr-10 | Heavy Rail | 3 | 2 |
| Utah Transit Authority | 28-Mar-10 | Light Rail | 4 | 2 |
| Washington Metropolitan Area Transit Authority | 16-Feb-10 | Heavy Rail | 2 | 2 |
| Maryland Transit Administration | 10-Aug-09 | Light Rail | 2 | 2 |
| Chicago Transit Authority | 23-May-08 | Heavy Rail | 20 | 2 |
| Massachusetts Bay Transportation Authority | 1-Oct-09 | Light Rail | 49 | 0 |
| San Francisco Municipal Railway | 23-Feb-10 | Light Rail | 40 | 0 |
| The Greater Cleveland Regional Transit Authority | 5-Oct-10 | Heavy Rail | 25 | 0 |
Exhibit 5-18 shows fatality rates per 100 million PMT for motor bus and demand response (excluding suicides and homicides). The data indicate demand response experienced a significant decrease in fatality rates in 2008 while motor bus experienced a less dramatic decrease. Absolute fatalities are not comparable across modes because of the wide range of passenger miles traveled on each mode and are therefore not provided. Exhibit 5-19 shows fatality rates per 100 million PMT for commuter rail, heavy rail, and light rail (excluding suicides and homicides). While no trends are apparent in this data, it appears to indicate that heavy rail is the statistically safest mode of travel.
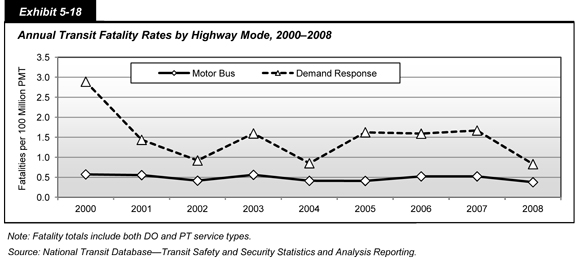
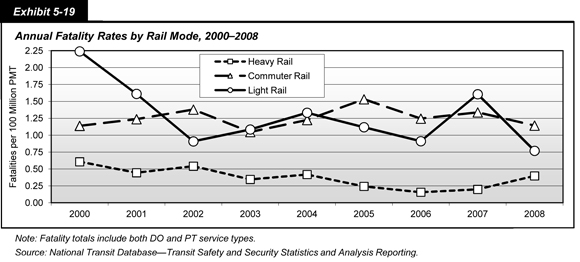
Exhibit 5-20 provides data on incidents and injuries per 100 million PMT for transportation services on the five largest modes from 2004 to 2008 (excluding suicides and homicides). This data suggests that the highway modes (motor bus and demand response) became significantly safer in 2007 and 2008; however, given this dramatic decrease is unexplained, the data for these years may also suggest a reporting inconsistency. Data for the rail modes is volatile, but does not suggest any significant positive or negative trends over this period.
| Analysis Parameter | 2004 | 2005 | 2006 | 2007 | 2008 |
|---|---|---|---|---|---|
| Incidents per 100 Million PMT | |||||
| Motor Bus | 77.31 | 74.31 | 78.71 | 66.02 | 54.15 |
| Heavy Rail | 44.57 | 39.79 | 42.24 | 43.15 | 52.83 |
| Commuter Rail | 20.13 | 21.51 | 18.84 | 17.93 | 16.18 |
| Light Rail | 63.15 | 67.37 | 61.62 | 61.18 | 48.48 |
| Demand Response | 895.24 | 1,010.24 | 1,298.07 | 247.39 | 204.28 |
| Injuries per 100 Million PMT | |||||
| Motor Bus | 75.56 | 70.08 | 70.84 | 68.57 | 66.89 |
| Heavy Rail | 32.88 | 26.17 | 32.41 | 31.08 | 43.11 |
| Commuter Rail | 16.84 | 21.05 | 16.50 | 17.60 | 16.31 |
| Light Rail | 41.84 | 36.59 | 35.76 | 43.67 | 48.34 |
| Demand Response | 448.50 | 506.00 | 729.47 | 227.33 | 234.50 |
Exhibit 5-21 shows the number of fatalities per 100 incidents for each of the five largest transit modes from 2004 to 2008. This metric does not represent the percentage of incidents that are fatal, as some incidents result in multiple fatalities. The metric does, however, show the likelihood that a fatality will result from an incident. Although commuter rail has a very low number of incidents per PMT (as indicated in Exhibit 5-20), commuter rail incidents are far more likely to result in a fatality than incidents occurring on any other mode. Most likely, this is because the average speed of commuter rail vehicles is considerably higher than the other modes (except vanpools). Motor buses, on the other hand, have a high number of incidents per PMT, but a lower chance of having an incident result in a fatality than almost any other mode (perhaps related to their low average speed). While light rail and motor bus modes of transit have similar numbers of incidents per PMT, an incident on light rail is approximately 2.3 times more likely to produce a fatality than an incident on a motor bus, based on 2008 data. It is possible that this is a result of the higher mass and longer stopping distance of light rail vehicles relative to motorbuses. It could also be that light rail vehicles attract more suicide attempts, some of which may not be recognizable as such and are not excluded from the fatality count.
| Mode | 2004 | 2005 | 2006 | 2007 | 2008 |
|---|---|---|---|---|---|
| Motor Bus | 0.63 | 0.63 | 0.76 | 0.79 | 0.70 |
| Heavy Rail | 0.96 | 0.61 | 0.37 | 0.46 | 0.75 |
| Commuter Rail | 6.86 | 8.16 | 7.52 | 7.46 | 7.06 |
| Light Rail | 2.24 | 1.68 | 1.50 | 2.62 | 1.59 |
| Demand Response | 0.29 | 0.50 | 0.43 | 0.68 | 0.41 |
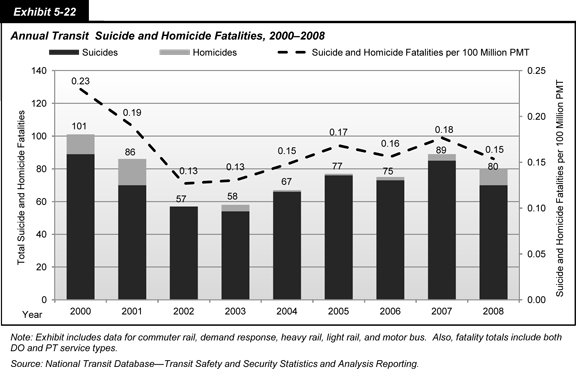
Suicides and homicides represented about a quarter of transit fatalities in 2008, perhaps a bit more since it is possible not all suicide attempts are recognized as such. Data on these fatalities since 2000 are shown in Exhibit 5-22, which indicates a modest upward trend.
To view PDF files, you need the Acrobat® Reader®.