- Highway Finance
- Revenue Sources for Highways
- Revenue Trends
- Highway Expenditures
- Types of Highway Expenditures
- Expenditure and Funding Trends
- Highway Capital Outlay
- Capital Outlay by Improvement Type
- Capital Outlay on Federal-Aid Highways
- Capital Outlay on the National Highway System
- Capital Outlay on the Interstate Highway System
- Revenue Sources for Highways
- Transit Finance
- Level and Composition of Transit Funding
- Federal Funding
- State and Local Funding
- System-Generated Funds
- Trends in Public Funding
- Funding in Current and Constant Dollars
- Capital Funding and Expenditures
- Operating Expenditures
- Operating Expenditures by Transit Mode
- Operating Expenditures by Type of Cost
- Operating Expenditures per Vehicle Revenue Mile
- Operating Expenditures per Passenger Mile
- Farebox Recovery Ratios
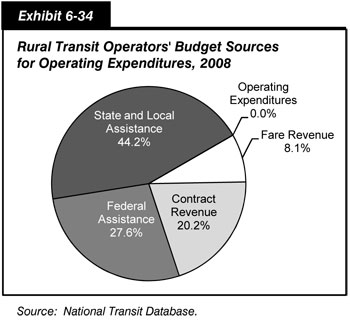
- Rural Transit
- Level and Composition of Transit Funding
Highway Finance
This section presents a detailed look at highway finance trends, beginning with revenue sources that support public investment in highways and bridges across all levels of government. This is followed by a detailed analysis of highway expenditures in general and highway capital outlay. A separate section within this chapter explores the financing of transit systems.
Revenue Sources for Highways
As shown in Exhibit 6-1, all levels of government combined generated $192.7 billion in 2008 to fund spending on highway and bridges. Actual cash expenditures during the same year for highways and bridges were lower, totaling $182.1 billion. The difference was placed in reserves for expenditure in future years.
| Source | Highway Revenue, Billions of Dollars | Percent | |||
|---|---|---|---|---|---|
| Federal | State | Local | Total | ||
| User Charges* | |||||
| Motor-Fuel Taxes | $26.2 | $30.0 | $1.5 | $57.7 | 29.9% |
| Motor-Vehicle Taxes and Fees | $4.7 | $21.4 | $1.1 | $27.2 | 14.1% |
| Tolls | $0.0 | $7.5 | $1.8 | $9.3 | 4.8% |
| Subtotal | $30.8 | $59.0 | $4.3 | $94.2 | 48.9% |
| Other | |||||
| Property Taxes and Assessments | $0.0 | $0.0 | $8.3 | $8.3 | 4.3% |
| General Fund Appropriations | $10.6 | $6.8 | $23.0 | $40.4 | 21.0% |
| Other Taxes and Fees | $0.5 | $7.0 | $5.0 | $12.4 | 6.5% |
| Investment Income and Other Receipts | $0.0 | $10.6 | $6.8 | $17.5 | 9.1% |
| Bond Issue Proceeds | $0.0 | $14.3 | $5.7 | $19.9 | 10.3% |
| Subtotal | $11.1 | $38.7 | $48.8 | $98.6 | 51.1% |
| Total Revenues | $41.9 | $97.7 | $53.1 | $192.7 | 100.0% |
| Funds Drawn From (or Placed in) Reserves | ($1.9) | ($7.1) | ($1.6) | ($10.7) | -5.5% |
| Total Expenditures Funded During 2008 | $40.0 | $90.6 | $51.5 | $182.1 | 94.5% |
|
Private Sector Financing Financing for highways comes from both the public and private sectors. The private sector has increasingly played a role in the delivery of highway infrastructure, but the vast majority of funding is still provided by the public sector. The financial statistics presented in this chapter are predominantly drawn from State reports based on State and local accounting systems. Figures in these systems can include some private sector investment; where it does, these amounts are generally classified as “other receipts.” For additional information on private sector investment in highways, see https://www.fhwa.dot.gov/ipd/p3/. |
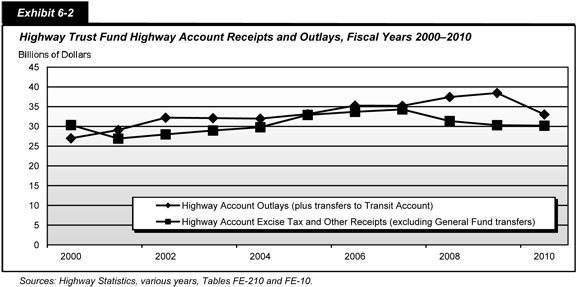
The $1.9 billion difference between total revenues and total expenditures in the “Federal” column in Exhibit 6-1 corresponds to an increase in the cash balance in the Highway Account of the Highway Trust Fund (HTF) of that amount in 2008. However, it is important to note that these revenues include a legislatively mandated transfer of $8.0 billion from the Federal General Fund to the HTF in September 2008. The annual proceeds from the taxes and fees dedicated to the Highway Account of the HTF have fallen below annual expenditures in recent years; additional transfers of general revenues to the HTF have subsequently occurred in FY 2009 and FY 2010 to keep the account solvent. In 2008, 48.9 percent of the total revenues for highway and bridges were provided from highway-user charges—including motor-fuel taxes, motor-vehicle taxes and fees, and tolls. The remaining 51.1 percent of revenues came from a number of sources, including local property taxes and assessments, other dedicated taxes, general funds, bond issues, investment income, and other miscellaneous sources.
|
Debt Financing Tools Some transportation projects are so large that their cost exceeds available current grant funding and tax receipts or would consume so much of these current funding sources as to delay many other planned projects. For this reason, State and local governments often look to finance large projects through borrowing, which provides an immediate influx of cash to fund project construction costs. The borrower then retires the debt by making principal and interest payments over time. Tax-exempt municipal bonds, backed by future government revenues, are the most common method of borrowing by government agencies for transportation projects. Three innovative debt instrument tools—Grant Anticipation Revenue Vehicles (GARVEEs), Private Activity Bonds (PABs), and Build America Bonds (BABs)—provide further borrowing opportunities. A GARVEE is a debt financing instrument—such as a bond, note, certificate, mortgage, lease, or other debt financing technique—that has a pledge of future Federal-aid funding. PABs are debt instruments issued by State or local governments on behalf of a private entity for highway and freight transfer projects, allowing a private project sponsor to benefit from the lower financing costs of tax-exempt municipal bonds. BABs, which were authorized by the American Recovery and Reinvestment Act (Recovery Act), are taxable bonds that are eligible for an interest rate subsidy paid directly from the U.S. Treasury. The Recovery Act allows States and local governments to issue BABs through December 2010. Additional information on Federal debt financing tools is available at https://www.fhwa.dot.gov/ipd/finance/tools_programs/federal_debt_financing/. |
The degree to which highway programs are funded by highway-user charges differs widely among the different levels of government. At the Federal level, $30.8 billion (73.6 percent) of highway revenues came from motor-fuel and motor-vehicle taxes in 2008. (It should be noted that this share was unusually low due to the transfer of general revenues to the HTF in 2008; from 1985 through 2007, the share of highway revenues at the Federal level derived from motor-fuel and motor-vehicle taxes exceeded 90 percent in each year.) The remaining $11.1 billion in revenues at the Federal level came from general fund appropriations, other taxes and fees (timber sales, mineral leases, etc.), and other receipts (interest income, fines and penalties, etc.); this includes the transfer of general revenues to the HTF, as well as additional revenues that cover highway-related activities of various Federal agencies that are not funded by the HTF.
At the State level, highway-user charges provided $59.0 billion or 60.4 percent of total highway revenues in 2008. Bond sales were another significant source of funding, contributing $14.3 billion (14.6 percent) toward total State highway revenues.
Many States do not permit local governments to impose motor-fuel and motor-vehicle taxes, or they cap them at relatively low levels. Therefore, at the local government level, only $4.3 billion (8.2 percent) of highway funding was provided by highway-user charges in 2008. General fund appropriations contributed $23.0 billion (43.3 percent) toward total local highway revenues, while property taxes generated $8.3 billion (15.7 percent).
The “Investment Income and Other Receipts” category in Exhibit 6-1 includes development fees and special district assessments. Other private sector investment in highways would also be reflected in this category, to the extent that such investment is captured in State and local accounting systems.
|
Federal Credit Assistance Federal credit assistance for surface transportation improvements can take one of two forms: loans, where project sponsors borrow Federal highway funds directly from a State DOT or the Federal government; and credit enhancements, where a State DOT or the Federal government makes Federal funds available on a contingent (or standby) basis. Credit enhancement helps reduce risk to investors and thus allows project sponsors to borrow at lower interest rates. Loans can provide the capital necessary to proceed with a project, and reduce the amount of capital borrowed from other sources, and may also serve a credit enhancement function by reducing the risk borne by other investors. Federal tools currently available to project sponsors include the Transportation Infrastructure and Finance Innovation Act (TIFIA) program, State Infrastructure Bank (SIB) programs, and Section 129 loans. The TIFIA Credit Program provides Federal credit assistance in the form of direct loans, loan guarantees, and standby lines of credit to finance surface transportation projects of national and regional significance. A TIFIA project must pledge repayment in whole or in part with dedicated revenue sources such as tolls, user fees, special assessments (taxes), or other non-Federal sources. SIBs are State-run revolving funds that provide loans, credit enhancements, and other forms of non-grant assistance to surface transportation projects. SIBs can be capitalized with regularly apportioned Federal-aid funds. Section 129 loans allow States to lend apportioned Federal-aid highway funds to toll and non-toll projects generating dedicated revenue streams. Additional information on credit assistance tools is available at https://www.fhwa.dot.gov/ipd/finance/tools_programs/federal_credit_assistance/. |
|
Public-Private Partnerships Public-Private Partnerships (P3s) are contractual agreements formed between a public agency and a private sector entity that allow for greater private sector participation in the delivery and financing of transportation projects. Typically, this participation involves the private sector taking on additional project risks, such as design, finance, long-term operation, maintenance, or traffic revenue. P3s are undertaken for a variety of purposes, including monetizing the value of existing assets, developing new transportation facilities, or rehabilitating or expanding existing facilities. While P3s may offer certain advantages, such as increased financing capacity and reduced costs, the public sector still must identify a source of revenue for the project, in order to provide a return to the private partner’s involvement, and must ensure that the goals and interests of the public are adequately secured. Additional information on P3s is available at https://www.fhwa.dot.gov/ipd/p3/. |
Revenue Trends
Since the passage of the Federal-Aid Highway Act of 1956 and the establishment of the HTF, user charges such as motor-fuel and motor-vehicle tax receipts have consistently provided a majority of the combined revenues raised for highway and bridge programs by all levels of government.
Exhibit 6-4 shows the trends for highway revenue sources by all levels of government between 2000 and 2008. While motor-fuel and motor-vehicle taxes continue to account for a large percentage of highway funding, revenues from this source grew at an average annual rate of only 1.5 percent over this period, well below the 4.9 percent average annual rate for all types of highway revenues. In contrast, revenues from “Investment Income and Other Receipts” and “Other Taxes and Fees” increased at average annual rates of 11.4 percent and 10.2 percent, respectively, between 2000 and 2008. The “General Fund Appropriations” category showed a 9.7 percent average annual increase between 2000 and 2008; a portion of this increase is attributable to the transfer of Federal general revenues to the HTF referenced earlier.
| Source | Highway Revenue, Billions of Dollars | Annual Rate of Change 2008/2000 | ||||
|---|---|---|---|---|---|---|
| 2000 | 2002 | 2004 | 2006 | 2008 | ||
| Motor-Fuel and Motor-Vehicle Taxes | $75.6 | $73.1 | $76.4 | $85.4 | $84.9 | 1.5% |
| Tolls | $5.7 | $6.6 | $6.6 | $8.3 | $9.3 | 6.2% |
| Property Taxes and Assessments | $6.1 | $6.5 | $7.5 | $9.0 | $8.3 | 3.9% |
| General Fund Appropriations | $19.3 | $20.3 | $23.6 | $28.3 | $40.4 | 9.7% |
| Other Taxes and Fees | $5.7 | $7.5 | $7.9 | $10.1 | $12.4 | 10.2% |
| Investment Income and Other Receipts | $7.3 | $8.1 | $7.6 | $9.7 | $17.5 | 11.4% |
| Bond Issue Proceeds | $11.3 | $12.7 | $15.8 | $18.3 | $19.9 | 7.4% |
| Total Revenues | $131.1 | $134.8 | $145.3 | $169.0 | $192.7 | 4.9% |
As shown in Exhibit 6-5, the percentage of Federal highway revenue derived from user charges declined from 95.5 percent in 2000 to 93.7 percent in 2006, followed by a steep drop to 73.6 percent in 2008 attributable to the transfer of general revenues to the HTF. At the State government level, the portion of highway funding from user charges has also declined, dropping from 73.9 percent to 60.4 percent over this period. States diversified their highway revenue sources of this period and relied more heavily on debt financing.
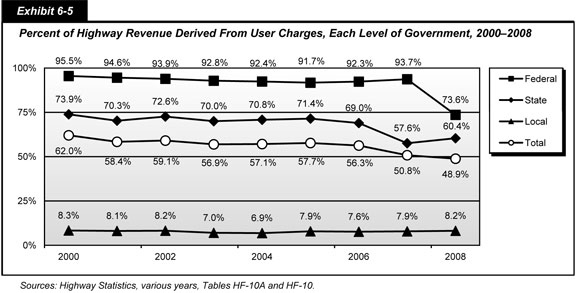
Highway-user charges have never been as significant a source of highway revenue at the local government level as at the Federal or State levels. The share of local government highway revenues derived from highway-user charges was 8.3 percent in 2000, decreasing to 6.9 percent in 2004, and then increasing to 8.2 percent in 2008.
Highway Expenditures
As indicated earlier in Exhibit 6-1, total expenditures for highways in 2008 equaled $182.1 billion. Exhibit 6-6 classifies this total by type of expenditure and level of government. The “Federal,” “State,” and “Local” columns in Exhibit 6-6 indicate which level of government made the direct expenditures, while the rows “Funding Sources for Capital Outlay” and “Funding Sources for Total Expenditures” indicate the level of government that provided the funding for those expenditures. Note that all amounts cited as “expenditures,” “spending,” or “outlays” in this report represent cash expenditures rather than authorizations or obligations.
| Highway Expenditures, Billions of Dollars | Percent | ||||
|---|---|---|---|---|---|
| Federal | State | Local | Total | ||
| Expenditures by Type | |||||
| Capital Outlay | $0.7 | $67.5 | $22.9 | $91.1 | 50.1% |
| Noncapital Expenditures | |||||
| Maintenance | $0.5 | $13.0 | $18.7 | $32.1 | 17.6% |
| Highway and Traffic Services | $0.0 | $7.5 | $5.3 | $12.8 | 7.1% |
| Administration | $1.7 | $8.2 | $4.9 | $14.7 | 8.1% |
| Highway Patrol and Safety | $0.0 | $7.7 | $6.9 | $14.6 | 8.0% |
| Interest on Debt | $0.0 | $6.0 | $2.5 | $8.5 | 4.7% |
| Subtotal | $2.2 | $42.3 | $38.2 | $82.7 | 45.4% |
| Total, Current Expenditures | $2.9 | $109.9 | $61.1 | $173.9 | 95.5% |
| Bond Retirement | $0.0 | $4.3 | $3.9 | $8.2 | 4.5% |
| Total, All Expenditures | $2.9 | $114.2 | $65.0 | $182.1 | 100.0% |
| Funding Sources for Capital Outlay | |||||
| Funded by Federal Government* | $0.7 | $36.0 | $1.1 | $37.8 | 41.5% |
| Funded by State or Local Govt's* | $0.0 | $31.5 | $21.8 | $53.3 | 58.5% |
| Total | $0.7 | $67.5 | $22.9 | $91.1 | 100.0% |
| Funding Sources for Total Expenditures | |||||
| Funded by Federal Government* | $2.9 | $36.0 | $1.1 | $40.0 | 22.0% |
| Funded by State Governments* | $0.0 | $75.7 | $14.8 | $90.6 | 49.7% |
| Funded by Local Governments* | $0.0 | $2.4 | $49.1 | $51.5 | 28.3% |
| Total | $2.9 | $114.1 | $65.0 | $182.1 | 100.0% |
| How was the $40.0 billion figure for Federal contributions to total highway expenditures derived, and why does this figure differ from amounts that appear in other documents (e.g., the President’s Budget)? | |
|
The Federal expenditures shown in this report are intended to reflect the highway-related activities of all Federal agencies, rather than just those of the traditional transportation agencies such as FHWA. The figures shown in this report draw from the same source data presented in Tables HF-10 and HF-10A in the annual Highway Statistics publication, which are linked to data for highway expenditures on an agency-by-agency basis at the Federal level presented in Tables FA-5 and FA-5R. These data represent cash outlays, rather than obligations (which are more relevant in terms of the annual Federal budget) or authorizations (which are more relevant in terms of multiyear authorization bills). Since the financial data reported by State and local governments are compiled on a cash basis, this report uses the same basis for Federal expenditures to ensure consistency.
These Federal spending figures rely on data from a mix of Federal, State, and local sources; in some cases, the Highway Statistics tables capture Federal funding for highways that is not otherwise tracked at the Federal level. For example, under current law, 25 percent of the receipts derived from Federal timber sales are to be paid to States for public roads and schools in the counties where forests are situated. At the time these payments are made, it is often unknown what portion will ultimately be used for roads as opposed to schools; however, once States have expended these funds, they report to FHWA what portion was used for roads so that this information may be included. Note that the Federal highway funding figures in this report exclude any amounts funded from the Highway Account of the Federal HTF that were used for transit purposes as identified in Highway Statistics. Such amounts would appear as Federal funding for transit in this report. The $37.8 billion Federal contribution to total capital expenditures represents total Federal highway expenditures of $40.0 billion, less direct Federal expenditures for noncapital purposes such as maintenance on Federally owned roads, administrative costs, and research. |
|
While the Federal government funded $40.0 billion of total highway expenditures in 2008, the majority of the Federal government’s contribution to highways consists of transfers to State and local governments. Direct Federal spending on capital outlay, maintenance, administration, and research amounted to only $2.9 billion. The remaining $37.1 billion was in the form of transfers to State and local governments.
State governments combined $36.0 billion of Federal funds with $75.7 billion of State funds and $2.4 billion of local funds to make direct expenditures of $114.1 billion (62.6 percent). Local governments combined $1.1 billion of Federal funds with $14.8 billion of State funds and $49.1 billion of local funds to make direct expenditures of $65.0 billion (35.6 percent).
Types of Highway Expenditures
Exhibit 6-6 classifies highway expenditure by type. Total highway expenditures are divided into two categories: bond retirement, which represents the costs associated with paying off the principal of bonds issued in the past to support highway spending; and current expenditures, which include all spending that has a direct impact on the highway system today. Current expenditures are further subdivided into capital outlay and noncapital expenditures.
| What is the distinction between “total expenditures” and “current expenditures”? | |
|
The difference relates to expenditures for bond retirement, which are not included as part of current expenditures. When looking at cash outlays for a particular year, total expenditures is more relevant, as it measures the full scope of highway-related activity. However, when summing expenditures across years, it is sometimes more appropriate to use current expenditures. For example, if bonds were issued to pay for a capital project, and retired 20 years later, then summing total expenditures over 20 years would effectively capture this transaction twice, as both the initial capital expenditure and the retirement of the bonds would be included. In such instances, summing current expenditures over time (excluding bond retirement) may provide a more accurate reflection of cumulative investment.
It should be noted that refunding bond transactions (bonds issued in the current year to immediately retire bonds issued in previous years) are excluded from both the total revenue and total expenditure figures presented in this chapter. |
|
Highway capital outlay consists of those expenditures associated with highway improvements. Improvements include land acquisition and other right-of-way costs; preliminary and construction engineering; new construction, reconstruction, resurfacing, rehabilitation, and restoration; and installation of guardrails, fencing, signs, and signals. Noncapital highway expenditures include maintenance of highways, highway and traffic services, administration, highway law enforcement, highway behavioral safety, and interest on debt.
| What basis is used for distinguishing between capital expenditures and maintenance expenditures? | |
|
The classification of the revenue and expenditure items in this report is based on definitions contained in A Guide to Reporting Highway Statistics, the instructional manual for States providing financial data for the Highway Statistics publication.
Other definitions of maintenance are used by different organizations. Some resurfacing, restoration, and rehabilitation projects that meet this report’s definition of capital outlay might be classified as maintenance activities in internal State or local accounting systems. |
|
As shown in Exhibit 6-6, in 2008 all levels of government spent $91.1 billion (50.1 percent) of highway expenditures on capital outlay. Additional information on types of capital outlay and the distribution of capital outlay by type of highway facility is presented later in this chapter. Combined spending on maintenance and traffic services of $45.0 billion represented 24.7 percent on total highway expenditures.
Expressed as a percentage, most Federal funding for highways goes for capital outlay; noncapital expenditures are funded primarily by State and local governments. The Federal government funded 41.5 percent of capital outlay in 2008, but only 22.0 percent of total highway expenditures.
| How are “maintenance” and “highway and traffic services” defined in this report? | |
|
Maintenance in this report includes routine and regular expenditures required to keep the highway surface, shoulders, roadsides, structures, and traffic control devices in usable condition. This includes completing spot patching and crack sealing of roadways and bridge decks and maintaining and repairing highway utilities and safety devices such as route markers, signs, guardrails, fence, signals, and highway lighting.
Highway and traffic services include activities designed to improve the operation and appearance of the roadway. This includes items such as the operation of traffic control systems, snow and ice removal, highway beautification, litter pickup, mowing, toll collection, and air quality monitoring. |
|
In terms of direct expenditures by expending agency, State expenditures represent a majority of total spending for each type of expenditure except for maintenance. Local governments spent $18.7 billion on maintenance in 2008, which is 58.2 percent of total maintenance spending by all levels of government combined.
Expenditure and Funding Trends
Exhibit 6-7 shows highway expenditures by all levels of government between 2000 and 2008. Total highway expenditures grew by 48.4 percent (5.1 percent per year) in nominal dollar terms over this period, rising from $122.7 billion to $182.1 billion. Capital outlay by all levels of government increased by 48.6 percent (5.1 percent per year) in nominal dollar terms over the same period, from $61.3 billion to $91.1 billion. Highway patrol and safety expenditures rose more slowly than other types of expenditures, increasing at an average annual rate of 3.5 percent per year; interest on debt grew more quickly than other types, growing by 8.0 percent annually.
| Expenditure Type | Highway Expenditures, Billions of Dollars | Annual Rate of Change 2008/2000 | ||||
|---|---|---|---|---|---|---|
| 2000 | 2002 | 2004 | 2006 | 2008 | ||
| Capital Outlay | $61.3 | $68.2 | $70.3 | $80.2 | $91.1 | 5.1% |
| Maintenance and Traffic Services | $30.6 | $33.2 | $36.3 | $40.8 | $45.0 | 4.9% |
| Administration | $10.0 | $10.7 | $12.7 | $13.1 | $14.7 | 4.9% |
| Highway Patrol and Safety | $11.0 | $11.7 | $14.3 | $14.7 | $14.6 | 3.5% |
| Interest on Debt | $4.6 | $5.4 | $5.8 | $6.6 | $8.5 | 8.0% |
| Total, Current Expenditures | $117.6 | $129.1 | $139.5 | $155.5 | $173.9 | 5.0% |
| Bond Retirement | $5.1 | $6.8 | $8.0 | $8.1 | $8.2 | 6.1% |
| Total, All Expenditures | $122.7 | $135.9 | $147.5 | $163.5 | $182.1 | 5.1% |
As shown in Exhibit 6-8, the portion of total highway expenditures funded by the Federal government declined from 22.4 percent in 2000 to 22.0 percent in 2008, peaking in 2004 before gradually declining. While Federally funded capital outlay grew by 44.8 percent (4.7 percent per year) from $26.1 billion in 2000 to $37.8 billion in 2008, State and local capital investment increased even faster, by 51.5 percent (5.3 percent annually), from $35.2 billion to $53.3 billion. Consequently, the Federal share of capital outlay declined over this period, from 42.6 percent to 41.5 percent.
| Highway Funding, Billions of Dollars | Annual Rate of Change 2008/2000 | |||||
|---|---|---|---|---|---|---|
| 2000 | 2002 | 2004 | 2006 | 2008 | ||
| Capital Outlay | ||||||
| Funded by Federal Government | $26.1 | $31.5 | $30.8 | $34.6 | $37.8 | 4.7% |
| Funded by State or Local Govt's | $35.2 | $36.7 | $39.5 | $45.6 | $53.3 | 5.3% |
| Total | $61.3 | $68.2 | $70.3 | $80.2 | $91.1 | 5.1% |
| Federal Share | 42.6% | 46.1% | 43.8% | 43.1% | 41.5% | |
| Total Expenditures | ||||||
| Funded by Federal Government | $27.5 | $32.8 | $33.1 | $36.3 | $40.0 | 4.8% |
| Funded by State Governments | $62.7 | $69.0 | $72.8 | $77.4 | $90.6 | 4.7% |
| Funded by Local Governments | $32.6 | $34.1 | $41.6 | $49.8 | $51.5 | 5.9% |
| Total | $122.7 | $135.9 | $147.5 | $163.5 | $182.1 | 5.1% |
| Federal Share | 22.4% | 24.1% | 22.4% | 22.2% | 22.0% | |
Constant Dollar Expenditures
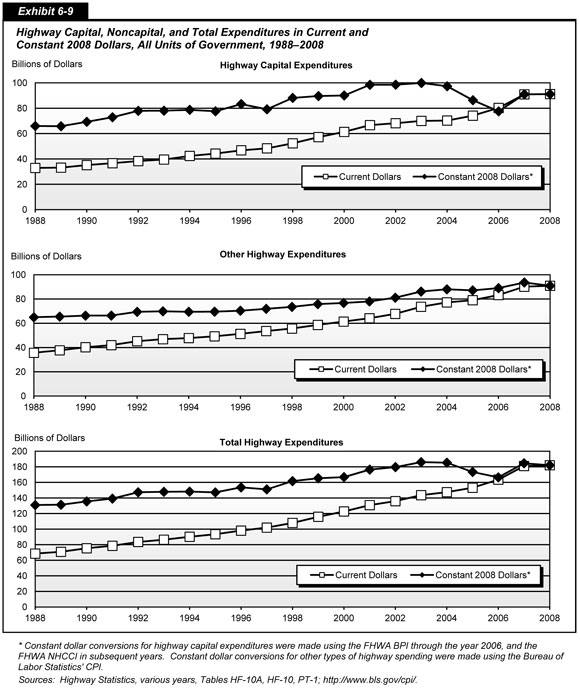
There are significant differences in the types of inputs of materials and labor that are associated with different types of highway expenditures; for example, on a dollar-per-dollar basis, highway maintenance activities are generally more labor intensive than highway construction activities. This report uses different indices for converting nominal dollar highway spending to constant dollars for capital and noncapital expenditures. For constant dollar conversions for highway capital expenditures, the Federal Highway Administration (FHWA) Composite Bid Price Index (BPI) is used through the year 2006, the last year for which this index was produced. Capital expenditure conversions for subsequent years rely on a new index, the FHWA National Highway Construction Cost Index (NHCCI). Constant dollar conversions for other types of highway expenditures are based on the Bureau of Labor Statistics’ Consumer Price Index (CPI).
For some historic periods, highway construction costs as measured by the BPI and NHCCI have grown faster than the CPI; in others, the CPI has grown faster. Industry-specific indices such as the BPI and NHCCI tend to be more volatile than the CPI, which reflects general trends within the overall economy. This volatility was demonstrated in the period between 2004 and 2006, as sharp increases in the prices of materials such as steel, asphalt, and cement caused the BPI to increase by 43.3 percent, compared with a 6.7 percent increase in the CPI.
Exhibit 6-9 compares highway expenditures in current (nominal) and constant (real) dollars over time. While total highway expenditures have grown in current dollar terms in each year from 1988 through 2008, constant dollar expenditures show a different pattern. Within this 20-year period, total highway spending peaked in constant dollar terms in 2003 and has subsequently declined. A similar pattern is evident for highway capital outlay, which was virtually unchanged in nominal dollar spending from 2003 to 2004 and grew by less than the rate of construction costs in subsequent years. Noncapital expenditures have grown more steadily over time in constant dollar terms.
From 1988 to 2008, highway capital spending increased at an average annual rate of 1.6 percent in constant dollar terms, slightly below the 1.7 percent annual constant dollar growth rate for total highway expenditures. More recently, for the 8-year period from 2000 to 2008, highway capital outlay grew by 1.2 percent (0.1 percent per year) in constant dollar terms, while total highway expenditures grew by 9.1 percent (1.1 percent annually) in constant dollars.
Exhibit 6-10 shows highway expenditures in current (nominal) and constant (real) dollars between 1988 and 2008 at the Federal government level and for State and local governments combined. Within this period, Federally funded highway expenditures peaked in 2002 in constant dollar terms, while non-Federal constant dollar expenditures peaked in 2007. As indicated earlier, most Federal highway funding goes for capital outlay, and highway construction costs as reflected in the BPI and NHCCI have risen more quickly in recent years than has the CPI.
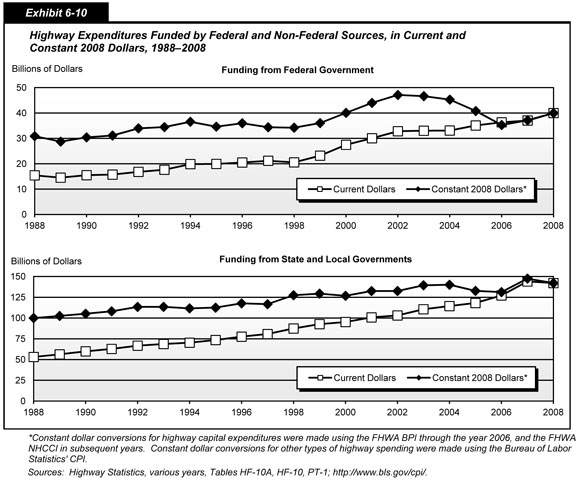
From 1988 to 2008, Federally funded highway expenditures increased at an average annual rate of 1.3 percent in constant dollar terms; State and local constant-dollar highway expenditures grew more quickly, increasing by 1.8 percent per year on average. For the 8-year period from 2000 to 2008, highway expenditures funded by the Federal government fell by 0.2 percent (0.0 percent per year) in constant dollar terms. Highway expenditures funded by State and local sources grew by 12.1 percent (1.4 percent annually) over this same period.
Highway Capital Outlay
As discussed earlier in the chapter, while the Federal government funds a significant portion of total capital outlay, most of the Federal contribution comes in the form of transfers to State and local governments for expenditure. Of the $91.1 billion in combined capital outlay by all levels of government in 2008, State governments directly spent $67.5 billion; this figure includes State projects funded with State funds, Federal funds, and/or local funds. Approximately $59.8 billion of direct State expenditures went for roads that are functionally classified as arterials or collectors; the remainder went for roads classified as rural local or urban local. Chapter 2 provides more detail on functional classification definition.
Capital Outlay by Improvement Type
States provide the FHWA with detailed data on what they spend on arterials and collectors, classifying capital outlay on each functional system into 17 improvement types. For this report, these improvement types have been allocated among three broad categories: system rehabilitation, system expansion, and system enhancement.
| How are “system rehabilitation,” “system expansion,” and “system enhancement” defined in this report? | |
|
System rehabilitation consists of capital improvements on existing roads and bridges that are intended to preserve the existing pavement and bridge infrastructure. These activities include reconstruction, resurfacing, pavement restoration or rehabilitation, widening of narrow lanes or shoulders, bridge replacement, and bridge rehabilitation. Also included is the portion of widening (lane addition) projects estimated to be related to reconstructing or improving existing lanes. System rehabilitation does not include routine maintenance costs. As shown in Exhibit 6-6, an additional $32.1 billion was spent by all levels of government in 2008 on routine maintenance.
System expansion includes construction of new roads and new bridges and addition of new lanes to existing roads. This includes all “New Construction,” “New Bridge,” “Major Widening,” and most of the costs associated with “Reconstruction-Added Capacity,” except for the portion of these expenditures estimated to be related to improving the existing lanes of a facility. As used in this report, “System Expansion” is the functional equivalent to “Capacity Expansion” used in some previous editions. The term was modified because some system rehabilitation and system enhancement improvements may result in added capacity without the addition of new lanes. System enhancement includes safety enhancements, traffic operations improvements such as the installation of intelligent transportation systems, and environmental enhancements. |
|
Exhibit 6-11 shows the distribution of the $59.8 billion in State expenditures on arterials and collectors by improvement type and demonstrates how this funding was grouped among these three major categories. No comparably detailed data for local expenditures or direct expenditures by Federal agencies are available; the distribution of such spending was estimated, based on the State expenditure patterns. An estimated $72.2 billion was expended in 2008 by all levels of government on capital improvements to arterials and collectors.
| Type of Expenditure | Distribution of Capital Outlay, Billions of Dollars | Total Outlay | |||
|---|---|---|---|---|---|
| System Rehabilitation | System Expansion New Roads and Bridges | System Expansion Existing Roads | System Enhancements | ||
| Direct State Expenditures on Arterials and Collectors | |||||
| Right-of-Way | $1.9 | $1.9 | $3.8 | ||
| Engineering | $4.0 | $1.3 | $1.3 | $0.7 | $7.4 |
| New Construction | $8.0 | $8.0 | |||
| Relocation | $1.0 | $1.0 | |||
| Reconstruction—Added Capacity | $2.2 | $5.0 | $7.2 | ||
| Reconstruction—No Added Capacity | $3.5 | $3.5 | |||
| Major Widening | $2.9 | $2.9 | |||
| Minor Widening | $1.4 | $1.4 | |||
| Restoration and Rehabilitation | $10.9 | $10.9 | |||
| Resurfacing | $0.3 | $0.3 | |||
| New Bridge | $0.9 | $0.9 | |||
| Bridge Replacement | $4.0 | $4.0 | |||
| Major Bridge Rehabilitation | $2.2 | $2.2 | |||
| Minor Bridge Work | $1.9 | $1.9 | |||
| Safety | $1.9 | $1.9 | |||
| Traffic Management/Engineering | $1.2 | $1.2 | |||
| Environmental and Other | $1.5 | $1.5 | |||
| Total, State Arterials and Collectors | $30.3 | $12.1 | $12.1 | $5.2 | $59.8 |
| Total, Arterials and Collectors, All Jurisdictions (estimated)* | |||||
| Highways and Other | $26.9 | $12.9 | $14.6 | $6.8 | $61.2 |
| Bridges | $9.9 | $1.0 | $11.0 | ||
| Total, Arterials and Collectors | $36.8 | $14.0 | $14.6 | $6.8 | $72.2 |
| Total Capital Outlay on All Systems (estimated)* | |||||
| Highways and Other | $33.8 | $16.2 | $15.9 | $11.0 | $76.8 |
| Bridges | $12.8 | $1.5 | $14.3 | ||
| Total, All Systems | $46.6 | $17.7 | $15.9 | $11.0 | $91.1 |
| Percent of Total | 51.1% | 19.4% | 17.4% | 12.0% | 100.0% |
Exhibit 6-11 also shows an estimated distribution of capital outlay by improvement type on all roadways and bridges for all levels of government combined. The improvement type breakdown for the $91.1 billion in total capital outlay includes estimates for roads classified as rural local and urban local. This distribution was estimated based on State expenditure patterns on lower-ordered functional systems such as rural minor collectors, rural major collectors, and urban collectors.
In 2008, about $46.6 billion was spent on system rehabilitation (51.1 percent of total capital outlay). As defined in this report, system rehabilitation activities include capital improvements on existing roads and bridges that are designed to preserve the existing pavement and bridge infrastructure. These improvements do not include routine maintenance.
About $17.7 billion—19.4 percent of total capital outlay—was spent on the construction of new roads and bridges in 2008. An additional $15.9 billion, or 17.4 percent, was used to add lanes to existing roads. Another $11.0 billion, or 12.0 percent, was spent on system enhancement, including safety enhancements, traffic operations improvements, and environmental enhancements.
Exhibit 6-12 shows the distribution of capital outlay by improvement type for individual functional systems. The portion of capital outlay spent on system rehabilitation ranges from 39.7 percent on urban other freeways and expressways to 67.8 percent on rural major collectors. Overall, system rehabilitation’s share of capital spending on arterials and collectors in rural areas (58.3 percent) was greater than in urban areas (46.1 percent).
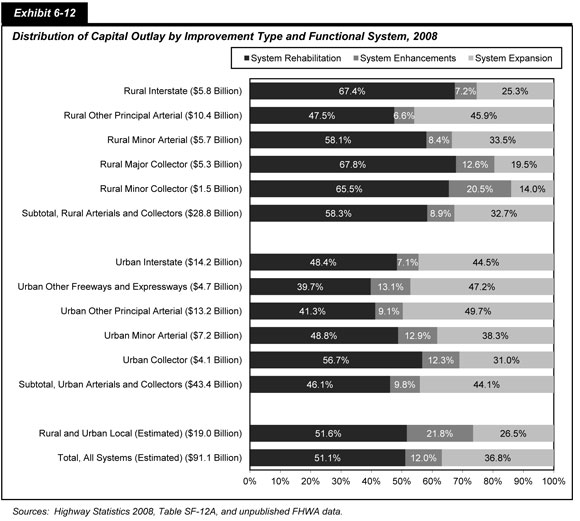
System expansion expenditures also vary significantly by functional class. The portion of capital used for lane additions, new roads, and new bridges is highest on urban other principal arterials, at 49.7 percent. In contrast, only 14.0 percent of capital outlay on rural minor collectors went for system expansion.
| How have constant dollar expenditures for different capital improvement types grown in recent years? | |
|
As noted earlier in this section, total capital outlay by all levels of government grew at an average annual rate of 0.1 percent from 2000 to 2008. System rehabilitation expenditures fell by 0.2 percent per year in constant dollar terms over this period, while system expansion expenditures fell by 0.1 percent annually. Expenditures for system enhancements grew by 2.6 percent per year in constant dollar terms from 2000 to 2008.
|
|
Exhibit 6-13 provides information on capital outlay by improvement type between 2000 and 2008. System rehabilitation expenditures grew at an average annual rate of 4.7 percent over this period, from $32.3 billion in 2000 to $46.6 billion in 2008. System expansion grew by 4.9 percent annually, from $23.0 billion in 2000 to $33.6 billion by 2008. Spending on system enhancements grew more quickly than overall highway spending, rising from $6.1 billion in 2000 to $11.0 billion by 2008, an increase of 7.7 percent per year.
| Improvement Type | Capital Outlay, Billions of Dollars | Annual Rate of Change 2008/2000 | ||||
|---|---|---|---|---|---|---|
| 2000 | 2002 | 2004 | 2006 | 2008 | ||
| System Rehabilitation | ||||||
| Highway | $25.0 | $25.5 | $26.7 | $31.0 | $33.8 | 3.8% |
| Bridge | $7.3 | $10.7 | $9.6 | $10.3 | $12.8 | 7.3% |
| Subtotal | $32.3 | $36.2 | $36.3 | $41.3 | $46.6 | 4.7% |
| System Expansion | ||||||
| Additions to Existing Roadways | $11.4 | $11.9 | $12.1 | $14.0 | $15.9 | 4.2% |
| New Routes | $10.5 | $11.4 | $12.6 | $15.2 | $16.2 | 5.6% |
| New Bridges | $1.1 | $1.1 | $1.4 | $1.2 | $1.5 | 3.9% |
| Subtotal | $23.0 | $24.4 | $26.1 | $30.4 | $33.6 | 4.9% |
| System Enhancements | $6.1 | $7.6 | $7.8 | $8.5 | $11.0 | 7.7% |
| Total | $61.3 | $68.2 | $70.3 | $80.2 | $91.1 | 5.1% |
| Percent of Total Capital Outlay | ||||||
| System Rehabilitation | 52.7% | 53.1% | 51.7% | 51.5% | 51.1% | |
| System Expansion | 37.4% | 35.8% | 37.1% | 37.9% | 36.8% | |
| System Enhancements | 9.9% | 11.1% | 11.2% | 10.6% | 12.0% | |
As system rehabilitation grew more slowly than these other two categories, its share of total capital spending fell from 52.7 percent in 2000 to 51.1 percent in 2008. Over this same period, the portion of total capital spending devoted to system expansion fell from 37.4 percent to 36.8 percent, while system enhancements’ share of total capital outlay rose from 9.9 percent to 12.0 percent.
Capital Outlay on Federal-Aid Highways
As discussed in Chapter 2, the term “Federal-aid highways” includes roads that are generally eligible for Federal funding assistance under current law. This includes all public roads that are not functionally classified as rural minor collector, rural local, or urban local. As shown in Exhibit 6-14, capital outlay on Federal-aid highways increased by 4.9 percent per year from 2000 to 2008, rising from $48.3 billion to $70.6 billion. Capital outlay on Federal-aid highways represents approximately 77.5 percent of the $91.1 billion of combined capital outlay by all levels of government in 2008.
| Improvement Type | Capital Outlay, Billions of Dollars | Annual Rate of Change 2008/2000 | ||||
|---|---|---|---|---|---|---|
| 2000 | 2002 | 2004 | 2006 | 2008 | ||
| System Rehabilitation | ||||||
| Highway | $19.3 | $19.6 | $19.4 | $22.9 | $26.4 | 3.9% |
| Bridge | $5.5 | $8.3 | $7.2 | $7.7 | $9.4 | 7.0% |
| Subtotal | $24.8 | $27.9 | $26.6 | $30.6 | $35.8 | 4.7% |
| System Expansion | ||||||
| Additions to Existing Roadways | $10.4 | $11.0 | $11.6 | $12.9 | $14.4 | 4.2% |
| New Routes | $8.4 | $9.1 | $9.8 | $12.0 | $12.9 | 5.4% |
| New Bridges | $0.9 | $0.9 | $1.2 | $0.9 | $1.0 | 1.4% |
| Subtotal | $19.7 | $21.0 | $22.6 | $25.9 | $28.3 | 4.6% |
| System Enhancements | $3.8 | $4.8 | $5.0 | $5.5 | $6.5 | 7.1% |
| Total | $48.3 | $53.7 | $54.2 | $61.9 | $70.6 | 4.9% |
| Percent of Total Capital Outlay | ||||||
| System Rehabilitation | 51.4% | 52.0% | 49.1% | 49.3% | 50.7% | |
| System Expansion | 40.8% | 39.1% | 41.6% | 41.9% | 40.1% | |
| System Enhancements | 7.8% | 8.9% | 9.3% | 8.8% | 9.2% | |
The share of capital outlay on Federal-aid highways directed toward system rehabilitation fell from 51.4 percent to 50.7 percent over this period, while the portion directed toward system expansion fell from 40.8 percent to 40.1 percent. System enhancement expenditures rose from 7.8 percent in 2000 to 9.2 percent in 2008.
Capital Outlay on the National Highway System
The National Highway System (NHS), which is described more fully in Chapter 2, includes the Interstate Highway System and other roads important to the Nation’s economy, defense, and mobility. As shown in Exhibit 6-15, capital outlay on the NHS grew from $29.9 billion in 2000 to $42.0 billion in 2008, equating to an average annual increase of 4.3 percent. System rehabilitation expenditures of $20.4 billion constituted 48.5 percent of total NHS capital spending in 2008. The $18.4 billion spent for system expansion represented 43.7 percent of total NHS capital spending, while the $3.3 billion spent for NHS system enhancements constituted 7.8 percent.
| Improvement Type | Capital Outlay, Billions of Dollars | Annual Rate of Change 2008/2000 | ||||
|---|---|---|---|---|---|---|
| 2000 | 2002 | 2004 | 2006 | 2008 | ||
| System Rehabilitation | ||||||
| Highway | $11.1 | $10.6 | $9.5 | $12.3 | $15.0 | 3.8% |
| Bridge | $3.1 | $4.5 | $4.0 | $4.3 | $5.4 | 7.4% |
| Subtotal | $14.2 | $15.1 | $13.5 | $16.6 | $20.4 | 4.6% |
| System Expansion | ||||||
| Additions to Existing Roadways | $6.4 | $7.1 | $7.1 | $8.1 | $9.2 | 4.7% |
| New Routes | $6.6 | $6.7 | $6.8 | $8.9 | $8.6 | 3.4% |
| New Bridges | $0.8 | $0.6 | $0.9 | $0.7 | $0.6 | -3.8% |
| Subtotal | $13.7 | $14.5 | $14.8 | $17.7 | $18.4 | 3.7% |
| System Enhancements | $2.0 | $2.8 | $2.8 | $2.8 | $3.3 | 6.6% |
| Total | $29.9 | $32.4 | $31.1 | $37.2 | $42.0 | 4.3% |
| Percent of Total Capital Outlay | ||||||
| System Rehabilitation | 47.5% | 46.7% | 43.5% | 44.7% | 48.5% | |
| System Expansion | 46.0% | 44.7% | 47.6% | 47.7% | 43.7% | |
| System Enhancements | 6.6% | 8.7% | 8.9% | 7.6% | 7.8% | |
The $42.0 billion spent for capital improvements to the NHS in 2008 constituted 46.1 percent of the $91.1 billion that all governments expended on highway capital projects that year.
Capital Outlay on the Interstate Highway System
Of the $91.1 billion spent for highway capital outlay by all levels of government in 2008, approximately 22.0 percent was used on the Interstate highway system component of the NHS. Exhibit 6-16 describes how the $20.0 billion of Interstate capital spending in 2008 was distributed by type of improvement. In 2008, all levels of government combined directed 53.9 percent of their Interstate-related expenditures to system rehabilitation, 38.9 percent to system expansion, and 7.1 percent to system enhancements. Total capital outlay on the Interstate system increased at an average annual rate of 4.7 percent between 2000 and 2008.
| Improvement Type | Capital Outlay, Billions of Dollars | Annual Rate of Change 2008/2000 | ||||
|---|---|---|---|---|---|---|
| 2000 | 2002 | 2004 | 2006 | 2008 | ||
| System Rehabilitation | ||||||
| Highway | $5.8 | $5.5 | $4.7 | $5.8 | $7.5 | 3.2% |
| Bridge | $1.6 | $2.4 | $2.3 | $2.5 | $3.3 | 9.4% |
| Subtotal | $7.4 | $8.0 | $7.0 | $8.3 | $10.8 | 4.8% |
| System Expansion | ||||||
| Additions to Existing Roadways | $2.5 | $3.2 | $2.9 | $3.2 | $4.5 | 7.9% |
| New Routes | $2.6 | $2.5 | $2.5 | $3.5 | $3.0 | 1.8% |
| New Bridges | $0.4 | $0.2 | $0.2 | $0.3 | $0.3 | -3.7% |
| Subtotal | $5.5 | $5.9 | $5.6 | $7.1 | $7.8 | 4.5% |
| System Enhancements | $0.9 | $1.4 | $1.1 | $1.2 | $1.4 | 5.6% |
| Total | $13.8 | $15.3 | $13.7 | $16.5 | $20.0 | 4.7% |
| Percent of Total Capital Outlay | ||||||
| System Rehabilitation | 53.7% | 52.1% | 50.8% | 49.9% | 53.9% | |
| System Expansion | 39.6% | 38.5% | 40.9% | 42.6% | 38.9% | |
| System Enhancements | 6.7% | 9.4% | 8.3% | 7.4% | 7.1% | |
Transit Finance
Transit funding comes from two major sources: public funds allocated by Federal, State, and local governments, and system-generated revenues earned from the provision of transit services. As shown in Exhibit 6-17, the total amount available for transit financing in 2008 was $52.5 billion. Federal funding for transit includes fuel taxes dedicated to transit from the Mass Transit Account (MTA) of the Highway Trust Fund (HTF), as well as undedicated taxes allocated from Federal general fund appropriations. State and local governments also provide funding for transit from their general fund appropriations, as well as from fuel, income, sales, property, and other unspecified taxes, specific percentages of which may be dedicated to transit. These percentages vary considerably among taxing jurisdictions and by type of tax. Other public funds from sources such as toll revenues and general transportation funds may also be used to fund transit. System-generated revenues are composed principally of passenger fares, although additional revenues are also earned by transit systems from advertising and concessions, park-and-ride lots, investment income, and rental of excess property and equipment.
| Transit Financing (Millions of Dollars) | Percent | ||||
|---|---|---|---|---|---|
| Federal | State | Local | Total | ||
| Public Funds | $8,986.3 | $11,388.8 | $18,455.3 | $38,830.4 | 73.9% |
| General Fund | $1,797.3 | $3,204.2 | $4,345.2 | $9,346.7 | 17.8% |
| Fuel Tax | $7,189.0 | $724.3 | $204.0 | $8,117.3 | 15.5% |
| Income Tax | $1,075.7 | $99.2 | $1,174.9 | 2.2% | |
| Sales Tax | $3,434.6 | $6,649.1 | $10,083.7 | 19.2% | |
| Property Tax | $0.1 | $849.1 | $849.2 | 1.6% | |
| Other Dedicated Taxes | $1,056.0 | $906.8 | $1,962.8 | 3.7% | |
| Other Public Funds | $1,893.9 | $5,401.9 | $7,295.8 | 13.9% | |
| System-Generated Revenue | $13,685.1 | 26.1% | |||
| Passenger Fares | $11,378.4 | 21.7% | |||
| Other Revenue | $2,306.7 | 4.4% | |||
| Total, All Sources | $52,515.5 | 100.0% | |||
Level and Composition of Transit Funding
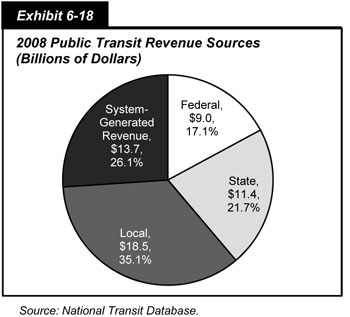
Exhibit 6-18 breaks down the sources of total transit funding. In 2008, public funds of $38.8 billion were available for transit and accounted for 73.9 percent of total transit funding. Of this amount, Federal funding was $9.0 billion, accounting for 23.1 percent of total public funding and for 17.1 percent of all funding from both public and nonpublic sources. State funding was $11.4 billion, accounting for 29.3 percent of total public funds and 21.7 percent of all funding. Local jurisdictions provided the bulk of transit funds, $18.5 billion in 2008, or 47.5 percent of total public funds and 35.1 percent of all funding. System-generated revenues were $13.7 billion, 26.1 percent of all funding.
| What type of dedicated funding does mass transit receive from Federal highway-user fees? | |
|
In 1983 the MTA was established within the HTF. It is funded by 2.86 cents of Federal highway-user fees on gasohol, diesel and kerosene fuel, and other special fuels (benzol, benzene, and naphtha). Since 1997 the Federal fuel tax on a gallon of gasoline has been 18.4 cents and the tax on a gallon of diesel has been 24.4 cents.
The MTA also receives 2.13 cents of the user fee on liquefied petroleum gas (LPG) and 1.86 cents of the user fee on liquefied natural gas (LNG). The MTA does not receive any of the nonfuel revenues (such as heavy vehicle use taxes) that accrue to the HTF. Since the passage of the Safe, Accountable, Flexible, Efficient Transportation Equity Act: A Legacy for Users (SAFETEA-LU), only the Formula and Bus Grants Program is funded from the MTA. Prior to SAFETEA-LU, MTA funded other FTA programs. |
|
Federal Funding
Federal funding for transit comes from two sources: the general revenues of the U.S. government and revenues generated from fuel taxes credited to the HTF’s MTA. General revenue sources include income taxes, corporate taxes, tariffs, fees, and other government income not required by statute to be accounted for in a separate fund. The MTA, a trust fund for capital projects in transit, is the largest source of Federal funding for transit. Eighty-two percent of the funds authorized for transit by the Safe, Accountable, Flexible, Efficient Transportation Equity Act: A Legacy for Users (SAFETEA-LU) ($37.2 billion) were derived from the MTA. Funding from the MTA in nominal dollars increased from $0.5 billion in 1983 to $7.2 billion in 2008.
The Department of Homeland Security (DHS) provides funding for projects aimed at improving transit security. In 2008, DHS provided a total of $350.1 million to transit service providers.
Since 1973, Federal surface transportation authorization statutes have contained flexible funding provisions that enable transfers from certain highway funds to transit programs and vice versa. Transfers are subject to State and regional/local discretion, and priorities are established through statewide transportation planning processes. All States and territories within the United States participate in the flexible funding program except Kansas, North Dakota, South Dakota, and Wyoming. The amount of flexible funding transferred from highways to transit fluctuates from year to year and is drawn from several different sources.
The Surface Transportation Program is the largest source of funds from the Federal Highway Administration (FHWA). Funding is at 80 percent of Federal share and may be used for all capital and maintenance projects eligible for funds under current Federal Transit Administration (FTA) programs, and may not be used for operating assistance. Several transit projects are also earmarked under TEA-21 and SAFETEA-LU as high-priority projects. FHWA has requested that they be administered by FTA.
Congestion Mitigation and Air Quality (CMAQ) Improvement Program funds are used to support transportation projects in air quality nonattainment areas. A CMAQ project must contribute to the attainment of the national ambient air quality standards by reducing air pollutant emissions from transportation sources.
| What are Flex Funds? | |
|
In FY 2008, $1.4 billion in flexible funds/transfers were available to FTA for obligation. Of that total, $957.3 million (67.0 percent) was transferred in FY 2008; the remaining available $472.5 million (33.0 percent) was the un-obligated carryover or recovery of prior year transfers. Thirty-nine states transferred flexible funds during FY 2008 and obligations totaled $1.1 billion. Once transferred, these funds take on the characteristics of the program in which they are received and are included in the figures reported across various programs. Obligations in FY 2008 were:
Since the program’s initiation in FY 1992, a total of $15.0 billion has been transferred from highways to transit. |
|
State and Local Funding
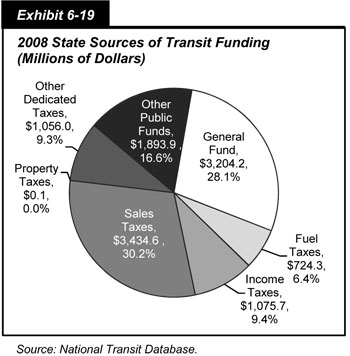
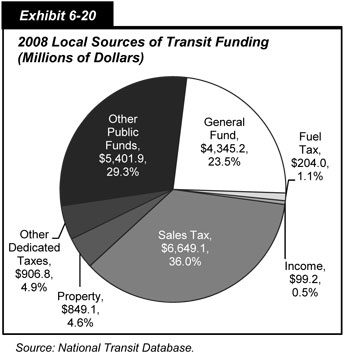
General funds and other dedicated public funds (vehicle licensing and registration fees, communications access fees, surcharges and taxes, lottery and casino receipts, and the proceeds from property and asset sales) are important sources of funding for transit at both the State and local levels. State and local transit funding sources are shown in Exhibits 6-19 and 6-20. Sales taxes are the most common source of dedicated funding for transit at both the State and local levels. In 2008, they accounted for 30.2 percent of total State and 36.0 percent of total local funding for transit. Other important sources of dedicated transit funding at both the State and local levels included income and property taxes. Dedicated income taxes are a more frequent source of transit funds at the State level, whereas dedicated property taxes are a more frequent source at the local level.
System-Generated Funds
In 2008, system-generated funds were $13.7 billion and provided 26.1 percent of total transit funding. Passenger fares contributed $11.4 billion, accounting for 21.7 percent of total transit funds. These passenger fare figures do not include payments by State entities to transit systems that offset reduced transit fares for certain segments of the population, such as students and the elderly. These payments are included in the “other revenue” category.
Exhibit 6-21 shows average fares and costs, on a per mile basis, for the nation’s ten largest transit agencies since 2000. After adjusting for inflation (constant dollars) there has been no increase in fares per mile over this period while the average cost per mile has increased by 7.0 percent. This has resulted in an 8.0 percent decrease in the “fare recovery ratio,” which is the percentage of operating costs covered by passenger fares. The 2008 fare recovery ratio for these ten agencies was 36.8 percent. Since these are all rail agencies, and rail systems tend to have lower operating costs per passenger mile, this is a higher fare recovery ratio than would be found for most bus or demand response operations. In many cases municipalities operating these systems have determined that it is more cost-effective for them to provide free service as fare collection is expensive and fares for these operations are generally kept low.
| Top 10 Systems* | 2000 | 2001 | 2002 | 2003 | 2004 | 2005 | 2006 | 2007 | 2008 | % Increase 2000– 2008 | % Increase Average Annual |
|---|---|---|---|---|---|---|---|---|---|---|---|
| Average Fare per Mile (Constant Dollars) | $3.71 | $3.71 | $3.50 | $3.42 | $3.56 | $3.58 | $3.66 | $3.68 | $3.70 | 0% | 0.0% |
| Average Fare per Mile (Current Year Dollars) | $3.03 | $3.10 | $2.98 | $2.97 | $3.16 | $3.29 | $3.47 | $3.59 | $3.70 | 22% | 2.5% |
| Average Cost per Mile (Constant Dollars) | $9.45 | $9.70 | $9.60 | $9.63 | $9.79 | $9.97 | $10.06 | $10.43 | $10.15 | 7% | 0.9% |
| Average Cost per Mile (Current Year Dollars) | $7.72 | $8.11 | $8.15 | $8.35 | $8.71 | $9.15 | $9.55 | $10.19 | $10.15 | 31% | 3.5% |
| Average Recovery Ratio | 40.2% | 39.2% | 38.0% | 36.6% | 36.9% | 36.4% | 36.6% | 35.5% | 36.8% | -8% | -1.1% |
Trends in Public Funding
Between 2000 and 2008, public funding for transit increased at an average annual rate of 10.6 percent; Federal funding increased at an average annual rate of 8.9 percent, and State and local funding grew at an average annual rate of 11.2 percent. These data are presented in Exhibit 6-22.
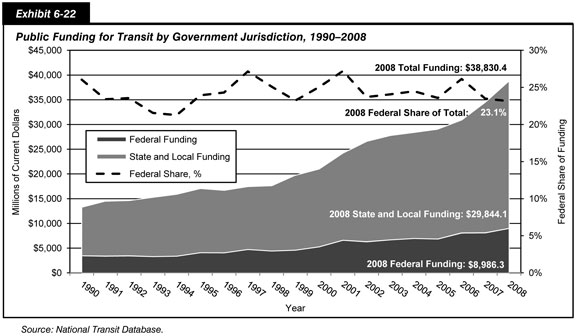
Federal funding for transit, as a percentage of total public funding for transit from Federal, State, and local sources combined, reached a peak of 42.9 percent in the late 1970s, and declined to near its present value by the early 1990’s as State and local funding increased. Exhibit 6-22 shows that, since 1990, the Federal government has provided between 21.3 and 27.2 percent of total public funding for transit; in 2008, it provided 23.1 percent of these funds.
Funding in Current and Constant Dollars
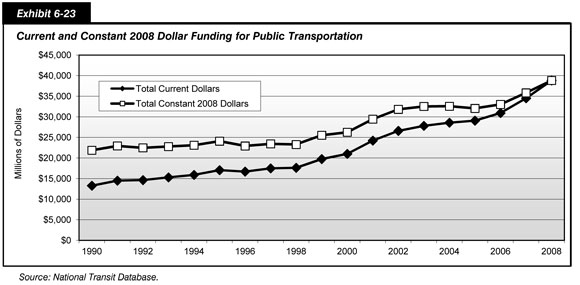
Total funding for transit in current and constant dollar terms since 1990 is presented in Exhibit 6-23. Total public funding for transit reached its highest level of $38.8 billion in 2008. After adjusting for inflation (constant dollars) this was 20.2 percent higher than in 2006. Between 2006 and 2008 Federal funding increased from $8.1 billion to $9.0 billion (11.1 percent) in current dollars. In constant dollars this represents a 5.7 percent increase. In current dollars State and local funding increased from $22.8 billion in 2006 to $29.8 billion in 2008 (30.7 percent). In constant dollars this represents a 25.3 percent increase.
Capital Funding and Expenditures
Funding for capital investments by transit operators in the United States comes primarily from public sources. Capital investment funds for transit are also generated through innovative finance programs.
Capital investments include the design and construction of new transit systems, extensions of existing systems (“New Starts”), and the modernization or replacement of existing assets. Capital investment expenditures can be for the acquisition, renovation, and repair of rolling stock (i.e., buses, railcars, locomotives, and service vehicles) or fixed assets (which include fixed guideway systems, terminals, and stations, as well as maintenance and administrative facilities).
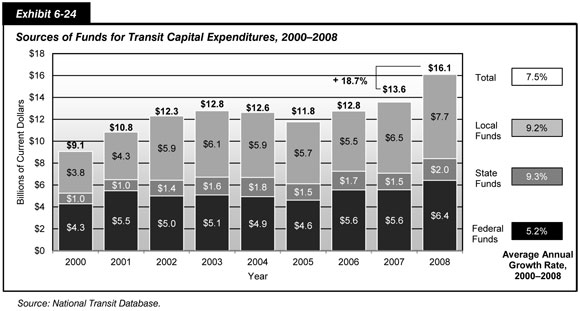
In 2008, total public transit agency expenditures for capital investment were $16.1 billion in current dollars and accounted for 41.5 percent of total available funds as shown in Exhibit 6-24. Federal funds were $6.4 billion in 2008, 39.8 percent of total transit agency capital expenditures. State funds provided an additional 12.4 percent and local funds provided the remaining 47.8 percent of total transit agency capital expenditures.
As shown in Exhibit 6-25, rail modes require a higher percentage of total transit capital investment than bus modes because of the higher cost of building fixed guideways and rail stations and because bus systems typically do not pay to build or maintain the roads they run on. In 2008, $12.3 billion, or 76.4 percent of total transit capital expenditures, were invested in rail modes of transportation, compared with $3.8 billion, or 23.6 percent of the total, which was invested in nonrail modes. This investment distribution has been consistent over the last decade.
| Type | Rail Capital Expenditures, Millions of Dollars | ||||
|---|---|---|---|---|---|
| Commuter Rail |
Heavy Rail |
Light Rail |
Other Rail 1 |
Total Rail |
|
| Guideway | $1,021.6 | $2,134.0 | $2,363.3 | $6.7 | $5,525.6 |
| Rolling Stock | $683.9 | $1,206.8 | $485.7 | $4.7 | $2,381.1 |
| Systems | $104.5 | $621.1 | $72.1 | $3.1 | $800.8 |
| Maintenance Facilities | $306.7 | $823.5 | $121.9 | $3.5 | $1,255.6 |
| Stations | $441.6 | $1,049.9 | $288.5 | $1.8 | $1,781.8 |
| Fare Revenue Collection Equipment | $10.9 | $91.6 | $14.0 | $0.0 | $116.5 |
| Administrative Buildings | $3.7 | $46.9 | $1.0 | $0.0 | $51.6 |
| Other Vehicles | $11.9 | $28.0 | $5.1 | $0.2 | $45.2 |
| Other Capital Expenditures 2 | $101.4 | $124.0 | $106.7 | $2.2 | $334.3 |
| Total | $2,686.2 | $6,125.8 | $3,458.3 | $22.2 | $12,292.5 |
| Percent of Total | 16.7% | 38.1% | 21.5% | 0.1% | 76.4% |
| Type | Nonrail Capital Expenditures, Millions of Dollars | |||||
|---|---|---|---|---|---|---|
| Motor Bus |
Demand Response |
Ferryboat | Trolleybus | Other Nonrail 3 |
Total Nonrail |
|
| Guideway | $154.7 | $0.0 | $0.0 | $12.0 | $0.0 | $166.7 |
| Rolling Stock | $1,682.9 | $191.0 | $57.6 | $29.0 | $17.7 | $1,978.2 |
| Systems | $233.6 | $14.0 | $1.0 | $1.1 | $0.0 | $249.7 |
| Maintenance Facilities | $527.7 | $32.9 | $3.2 | $0.3 | $0.0 | $564.1 |
| Stations | $313.1 | $7.2 | $48.7 | $0.0 | $0.7 | $369.7 |
| Fare Revenue Collection Equipment | $89.9 | $0.1 | $0.1 | $0.0 | $0.0 | $90.1 |
| Administrative Buildings | $137.1 | $7.2 | $0.6 | $1.0 | $0.1 | $146.0 |
| Other Vehicles | $47.4 | $2.8 | $0.0 | $0.9 | $0.0 | $51.1 |
| Other Capital Expenditures 2 | $168.9 | $8.7 | $2.0 | $0.3 | $0.8 | $180.7 |
| Total | $3,355.3 | $263.9 | $113.2 | $44.6 | $19.3 | $3,796.3 |
| Percent of Total | 20.9% | 1.6% | 0.7% | 0.3% | 0.1% | 23.6% |
| Type | Total Expenditures, Millions of Dollars for Rail and Nonrail Modes |
Percent of Total |
|---|---|---|
| Guideway | $5,692.3 | 35.4% |
| Rolling Stock | $4,359.3 | 27.1% |
| Systems | $1,050.5 | 6.5% |
| Maintenance Facilities | $1,819.7 | 11.3% |
| Stations | $2,151.5 | 13.4% |
| Fare Revenue Collection Equipment | $206.6 | 1.3% |
| Administrative Buildings | $197.6 | 1.2% |
| Other Vehicles | $96.3 | 0.6% |
| Other Capital Expenditures 2 | $515.0 | 3.2% |
| Total | $16,088.8 | 100.0% |
2 Capital expenditures not elsewhere included. These expenditures include furniture and equipment that are not an integral part of buildings and structures; they also include shelters, signs, and passenger amenities (e.g., benches) not in passenger stations.
3 Jitney, Público, and vanpool.
Exhibit 6-25 shows the capital investment expenditures by asset type in 2008. Fluctuations in the levels of capital investment in different types of transit assets reflect normal rehabilitation and replacement cycles, as well as new investment. Capital investment expenditures have only been reported to the National Transit Database (NTD) at the level of detail in Exhibit 6-25 since 2002.
Guideway investment was $5.7 billion in 2008; investment in systems was $1.1 billion. Guideway includes at-grade rail, elevated and subway structures, tunnels, bridges, track and power systems for all rail modes, and paved highway lanes dedicated to buses. Investment in systems by transit operators includes groups of devices or objects forming a network, most notably for train control, signaling, and communications.
Investment in rolling stock in 2008 was $4.4 billion, investment in stations was $2.2 billion, and investment in maintenance facilities was $1.8 billion. Rolling stock includes the bodies and chassis of transit vehicles and their attached fixtures and appliances, but does not include fare collection equipment and revenue vehicle movement control equipment such as radios. Stations include station buildings, platforms, shelters, parking and other forms of access, and crime prevention and security equipment at stations. Facilities include the purchase, construction, and rehabilitation of administrative and maintenance facilities. Facilities also include investment in building structures, climate control, parking, yard track, vehicle and facilities maintenance equipment, furniture, office equipment, and computer systems.
Other capital includes capital costs associated with general administration facilities, furniture, equipment that is not an integral part of buildings and structures, data processing equipment (including computers and peripheral devices whose sole use is in data processing operations), and shelters located at on-street bus stops.
| What are “New Starts?” | |
|
Projects involving the construction of new fixed guideway systems are known as “New Starts.” Title 49 USC Section 5309 provides for the allocation of funds for the design and construction of new transit systems and extensions to current systems (“New Starts”), among other purposes. To receive FTA capital investment funds for a New Starts project, the proposed project must emerge from the metropolitan and/or statewide planning process. A rigorous series of planning and project development requirements must be completed in order for a project to qualify for this funding. Local officials are required to analyze the benefits, costs, and other impacts of alternative transportation strategies before deciding upon a locally preferred alternative. FTA evaluates proposed projects on the basis of financial criteria and project justification criteria as prescribed by statute. Initial planning efforts are not funded through the Section 5309 program, but may be funded through Section 5303, Metropolitan Planning; Section 5339, Alternatives Analysis; or Section 5307, Urbanized Area Formula Grants programs.
Under current law, Federal funding may account for up to 80 percent of a New Starts funding requirement. Generally, the Federal share of such projects now averages about 50 percent of the total project cost. |
|
Operating Expenditures
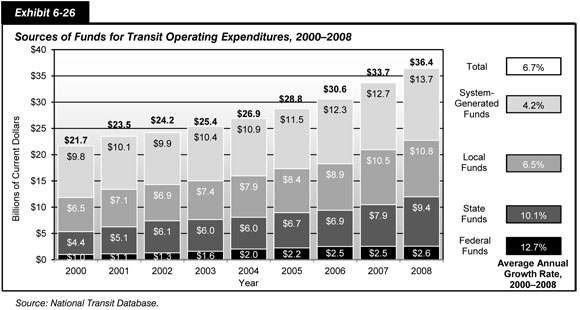
Transit operating expenditures include wages, salaries, fuel, spare parts, preventive maintenance, support services, and certain leases used in providing transit service. As shown in Exhibit 6-26, $36.4 billion was available for operating expenses in 2008, the Federal share of which has declined from the 2006 high of 8.2 percent to 7.1 percent. The share generated from system revenues decreased from 40.3 percent in 2006 to 37.6 percent. These decreases have been offset by the State share, which has increased from 22.5 percent in 2006 to 25.8 percent. The local share of operating expenditures has been close to 2008’s 29.7 percent for several years.
| What happens after the census? | |
|
TEA-21 mandated that Federal funding to transit systems in urbanized areas with populations over 200,000 be used only for capital expenses and preventive maintenance, and not for operating expenses. Formula grant funds to urbanized areas with populations of less than 200,000 were still allowed to be used for operating expenses. As a result of the 2000 census, 56 areas were reclassified as urbanized areas with populations of more than 200,000. (These reclassifications were announced by the Census Department in May 2002.) Transit agencies operating in these areas were slated to lose their eligibility to use Federal formula funding to finance transit operations starting in FY 2003. The Transit Operating Flexibility Act of 2002 amended Section 5307 of 49 USC to allow transit systems that were in these areas to continue to use their formula funds for operating expenses as well as for capital expenses in FY 2003, despite their change in status. This change was extended by the Surface Transportation Extension Act of 2003. Under SAFETEA-LU these transit agencies may continue to use formula funds for operating expenses in FY 2005 at 100 percent of their FY 2002 apportionment, in FY 2006 at 50 percent of their FY 2002 apportionment, and in FY 2007 at 25 percent of their FY 2002 apportionment. The impact of the 2010 census will not be known until the 2012 apportionment, and similar legislative responses to any reclassifications have yet to be considered. |
|
Operating Expenditures by Transit Mode
As shown in Exhibit 6-27, transit operators’ actual operating expenditures were $33.5 billion in 2008. These expenditures increased at an average annual rate of 6.6 percent between 2000 and 2008 (4.0 percent in constant dollars). Light rail and demand response modes have experienced the largest percentage increase in operating expenditures during this period. This is due to relatively greater investment in new light rail and demand response capacity over the past 10 years.
| Year | Expenditures, Millions of Current Dollars | ||||||
|---|---|---|---|---|---|---|---|
| Motor Bus | Heavy Rail | Commuter Rail | Light Rail | Demand Response | Other | Total | |
| 2000 | $11,026.4 | $3,930.8 | $2,679.0 | $592.1 | $1,225.4 | $549.3 | $20,003.1 |
| 2001 | $11,814.0 | $4,180.1 | $2,853.7 | $676.5 | $1,409.9 | $594.7 | $21,528.8 |
| 2002 | $12,585.7 | $4,267.5 | $2,994.7 | $778.3 | $1,635.7 | $643.4 | $22,905.1 |
| 2003 | $13,315.8 | $4,446.2 | $3,172.7 | $753.7 | $1,778.7 | $718.0 | $24,185.2 |
| 2004 | $13,789.5 | $4,734.2 | $3,436.4 | $826.1 | $1,902.0 | $738.6 | $25,426.8 |
| 2005 | $14,665.8 | $5,144.8 | $3,657.1 | $978.1 | $2,071.2 | $720.8 | $27,237.8 |
| 2006 | $15,796.5 | $5,287.5 | $3,764.9 | $1,070.1 | $2,285.9 | $819.7 | $29,024.6 |
| 2007 | $16,811.9 | $5,888.3 | $4,000.9 | $1,162.8 | $2,538.6 | $901.0 | $31,303.5 |
| 2008 | $17,963.2 | $6,128.5 | $4,293.8 | $1,258.5 | $2,860.8 | $974.6 | $33,479.4 |
| Percent of Total | |||||||
| 2000 | 55.1% | 19.7% | 13.4% | 3.0% | 6.1% | 2.7% | 100.0% |
| 2008 | 53.7% | 18.3% | 12.8% | 3.8% | 8.5% | 2.9% | 100.0% |
| Average Annual Growth Rate | |||||||
| 2008/2000 | 6.3% | 5.7% | 6.1% | 9.9% | 11.2% | 7.4% | 6.6% |
Operating Expenditures by Type of Cost
In 2008, $18.0 billion—or 53.8 percent of total transit operating expenditures—went toward vehicle operations. Smaller amounts were expended on maintenance and administration; these expenses, which have virtually been the same for several years now, are broken down across cost categories in Exhibit 6-28.
| Mode | Distribution of Expenditures, Millions of Dollars (Percent) | Totals, Millions of Dollars (Percent) | ||||||||
|---|---|---|---|---|---|---|---|---|---|---|
| Vehicle Operations | Vehicle Maintenance | Nonvehicle Maintenance | General Administration | |||||||
| Motor Bus | $10,613.6 | 58.9% | $3,696.4 | 55.8% | $758.1 | 22.2% | $2,895.0 | 53.4% | $17,963.1 | 53.7% |
| Heavy Rail | $2,639.0 | 14.7% | $1,089.3 | 16.4% | $1,583.9 | 46.3% | $816.5 | 15.1% | $6,128.7 | 18.3% |
| Commuter Rail | $1,810.2 | 10.0% | $1,067.1 | 16.1% | $714.9 | 20.9% | $701.7 | 13.0% | $4,293.9 | 12.8% |
| Light Rail | $535.6 | 3.0% | $270.9 | 4.1% | $219.9 | 6.4% | $232.1 | 4.3% | $1,258.5 | 3.8% |
| Demand Response | $1,873.5 | 10.4% | $352.2 | 5.3% | $72.6 | 2.1% | $562.4 | 10.4% | $2,860.7 | 8.5% |
| Other | $540.1 | 3.0% | $153.5 | 2.3% | $70.4 | 2.1% | $210.5 | 3.9% | $974.5 | 2.9% |
| Total | $18,012.0 | 100.0% | $6,629.4 | 100.0% | $3,419.8 | 100.0% | $5,418.2 | 100.0% | $33,479.4 | 100.0% |
| Percent of All Modes | 53.8% | 19.8% | 10.2% | 16.2% | 100.0% | |||||
Road and rail operations have inherently different cost structures because, in most cases roads are not paid for by the transit provider, but tracks are. Thus 59.1 percent of total operations expenditures for bus transit and 65.4 percent of total operations expenditures for demand response were spent for actual operation of the vehicles, only 42.7 percent of rail operations expenditures were spent on the operation of rail vehicles. A significantly higher percentage of expenditures for rail modes of transportation are classified as non-vehicle maintenance, corresponding to the repair and maintenance costs of fixed guideway systems.
Operating Expenditures per Vehicle Revenue Mile
Operating expenditures per vehicle revenue mile (VRM) is one measure of financial or cost efficiency. It shows the expense of operating a transit vehicle in revenue service. As shown in Exhibit 6-29, operating expenditures per VRM for all transit modes combined was $8.60 in 2008; the average annual increase in operating expenditures per VRM for all modes combined between 2000 and 2008 was 4.1 percent (1.5 percent after adjusting for inflation).
| Year | Motor Bus1 | Heavy Rail | Commuter Rail | Light Rail | Demand Response | Other2 | Total |
|---|---|---|---|---|---|---|---|
| 2000 | $6.25 | $6.80 | $10.81 | $11.51 | $2.71 | $5.05 | $6.25 |
| 2001 | $6.49 | $7.07 | $11.28 | $12.72 | $2.88 | $5.41 | $6.49 |
| 2002 | $6.75 | $7.07 | $11.56 | $12.98 | $3.11 | $5.59 | $6.68 |
| 2003 | $7.08 | $7.27 | $12.11 | $12.25 | $3.27 | $6.37 | $6.96 |
| 2004 | $7.32 | $7.58 | $12.79 | $12.40 | $3.39 | $5.21 | $7.17 |
| 2005 | $7.78 | $8.20 | $13.20 | $14.40 | $3.50 | $4.66 | $7.56 |
| 2006 | $8.27 | $8.34 | $13.12 | $14.66 | $3.77 | $5.13 | $7.31 |
| 2007 | $8.70 | $9.22 | $13.48 | $14.12 | $3.94 | $5.17 | $8.31 |
| 2008 | $9.18 | $9.35 | $13.89 | $14.58 | $4.16 | $4.89 | $8.60 |
| Average | $7.54 | $7.88 | $12.47 | $13.29 | $3.41 | $5.27 | $7.26 |
| Average Annual Rate of Change | |||||||
| 2008/2000 | 4.9% | 4.1% | 3.2% | 3.0% | 5.5% | -0.4% | 4.1% |
2 Automated guideway, Alaska railroad, cable car, ferryboat, inclined plane, monorail, Público, trolleybus, and vanpool.
As shown in Exhibit 6-30, analysis of NTD reports for the largest 10 transit agencies (by ridership) shows that the growth in operating expenses is led by the cost of fringe benefits (36.0 percent of all operating costs for these agencies), which have been going up at a rate of 3.4 percent per year above inflation (constant dollars) since 2000. By comparison, average salaries at these ten agencies grew at an inflation-adjusted rate of only 0.1 percent per year in that period. FTA does not collect data on the different components of fringe benefits but increases in the cost of medical insurance undoubtedly contribute to the growth in this category.
| Top 10 Systems* | Average Cost, Constant Dollars | % Increase | |||||||||
|---|---|---|---|---|---|---|---|---|---|---|---|
| 2000 | 2001 | 2002 | 2003 | 2004 | 2005 | 2006 | 2007 | 2008 | 2000– 2008 | Average Annual | |
| Fare per Mile | $3.71 | $3.71 | $3.50 | $3.42 | $3.56 | $3.58 | $3.66 | $3.68 | $3.70 | 0% | 0.0% |
| Cost per Mile | $9.45 | $9.70 | $9.60 | $9.63 | $9.79 | $9.97 | $10.06 | $10.43 | $10.15 | 7% | 0.9% |
| Labor Cost per Mile | $7.90 | $7.99 | $8.11 | $8.27 | $8.36 | $8.33 | $8.46 | $8.80 | $8.82 | 12% | 1.4% |
| Salaries per Mile | $5.11 | $5.11 | $5.08 | $5.06 | $5.02 | $4.91 | $4.97 | $5.07 | $5.17 | 1% | 0.1% |
| Fringe Benefits per Mile | $2.80 | $2.88 | $3.03 | $3.21 | $3.34 | $3.42 | $3.49 | $3.73 | $3.65 | 31% | 3.4% |
Operating expenditures per capacity-equivalent VRM is a better measure of comparing cost efficiency among modes than operating expenditures per VRM because it adjusts for passenger-carrying capacities. As demonstrated by the data in Exhibit 6-31, rail systems are more cost efficient in providing service than nonrail systems, once investment in rail infrastructure has been completed. Based on operating costs alone, heavy rail is the most efficient at providing transit service, and demand response systems are the least efficient. Annual changes in operating expense per capacity-equivalent VRM are not comparable across modes because average capacities for all vehicle types are adjusted separately each year based on reported fleet averages.
| Year | Motor Bus1 | Heavy Rail | Commuter Rail | Light Rail | Demand Response | Other2 | Total |
|---|---|---|---|---|---|---|---|
| 2000 | $6.25 | $2.88 | $4.64 | $4.57 | $15.05 | $7.71 | $5.15 |
| 2001 | $6.49 | $3.00 | $4.84 | $5.05 | $15.97 | $8.53 | $5.24 |
| 2002 | $6.75 | $3.00 | $4.96 | $5.15 | $17.30 | $8.43 | $5.31 |
| 2003 | $7.08 | $2.93 | $4.75 | $4.55 | $18.16 | $9.57 | $5.49 |
| 2004 | $7.32 | $3.06 | $5.02 | $4.61 | $19.93 | $9.10 | $5.68 |
| 2005 | $7.78 | $3.30 | $4.31 | $5.23 | $21.08 | $8.66 | $6.01 |
| 2006 | $8.27 | $3.35 | $4.28 | $5.32 | $22.71 | $9.91 | $6.29 |
| 2007 | $8.70 | $3.73 | $4.43 | $5.19 | $23.47 | $10.01 | $6.45 |
| 2008 | $9.18 | $3.78 | $4.57 | $5.36 | $24.80 | $12.91 | $6.77 |
| Average | $7.54 | $3.23 | $4.64 | $5.00 | $19.83 | $9.43 | $5.82 |
| Average Annual Rate of Change | |||||||
| 2008/2000 | 4.9% | 3.5% | -0.2% | 2.0% | 6.4% | 6.7% | 3.5% |
2 Automated guideway, cable car, ferryboat, inclined plane, jitney, monorail, Público, tramway, trolleybus, and vanpool.
Operating Expenditures per Passenger Mile
Operating expense per passenger mile is an indicator of the cost effectiveness of providing a transit service. It shows the relationship between service inputs as expressed by operating expenses and service consumption as expressed by passenger miles traveled. Operating expenditures per passenger mile for all transit modes combined increased at an average annual rate of 4.3 percent between 2000 and 2008 (from $0.44 to $0.62). These data are shown in Exhibit 6-32.
| Year | Motor Bus | Heavy Rail | Commuter Rail | Light Rail | Demand Response | Other* | Total |
|---|---|---|---|---|---|---|---|
| 2000 | $0.59 | $0.28 | $0.29 | $0.44 | $2.09 | $0.49 | $0.44 |
| 2001 | $0.60 | $0.29 | $0.30 | $0.47 | $2.25 | $0.52 | $0.46 |
| 2002 | $0.64 | $0.31 | $0.32 | $0.54 | $2.51 | $0.55 | $0.50 |
| 2003 | $0.69 | $0.33 | $0.33 | $0.55 | $2.58 | $0.56 | $0.53 |
| 2004 | $0.73 | $0.33 | $0.35 | $0.56 | $2.70 | $0.53 | $0.55 |
| 2005 | $0.76 | $0.36 | $0.39 | $0.58 | $2.80 | $0.52 | $0.58 |
| 2006 | $0.77 | $0.36 | $0.36 | $0.57 | $3.03 | $0.58 | $0.59 |
| 2007 | $0.82 | $0.36 | $0.36 | $0.60 | $3.26 | $0.60 | $0.60 |
| 2008 | $0.85 | $0.36 | $0.39 | $0.60 | $3.39 | $0.57 | $0.62 |
| Average | $0.72 | $0.33 | $0.34 | $0.55 | $2.74 | $0.55 | $0.54 |
| Average Annual Rate of Change | |||||||
| 2008/2000 | 4.7% | 3.1% | 4.0% | 4.0% | 6.3% | 1.9% | 4.3% |
Farebox Recovery Ratios
The farebox recovery ratio represents farebox revenues as a percentage of total transit operating costs. It measures users’ contributions to the variable cost of providing transit services and is influenced by the number of riders, fare structure, and rider profile. Low regular fares, the high availability and use of discounted fares, and high transfer rates tend to result in lower farebox recovery ratios. Farebox recovery ratios for 2004 to 2008 are provided in Exhibit 6-33. The average farebox recovery ratio over this period for all transit modes combined was 34.6 percent; heavy rail had the highest average farebox recovery ratio at 59.4 percent. Farebox recovery ratios for total costs are not provided because capital investment costs are not spread evenly across years. Rail modes have farebox recovery ratios for total costs that are significantly lower than for operating costs alone because of these modes’ high level of capital costs.
| Year | Motor Bus | Heavy Rail | Commuter Rail | Light Rail | Demand Response | Other2 | Total |
|---|---|---|---|---|---|---|---|
| 20041 | 27.9% | 61.3% | 47.0% | 26.2% | 9.6% | 36.2% | 35.5% |
| 20051 | 27.6% | 58.4% | 47.2% | 25.4% | 9.5% | 35.0% | 34.8% |
| 20061 | 26.6% | 60.9% | 49.4% | 27.4% | 9.3% | 34.3% | 34.8% |
| 2007 | 26.6% | 56.8% | 49.5% | 26.6% | 8.2% | 35.3% | 34.0% |
| 2008 | 26.3% | 59.4% | 50.3% | 29.3% | 7.5% | 32.7% | 34.1% |
| Average | 27.0% | 59.4% | 48.7% | 27.0% | 8.8% | 34.7% | 34.6% |
2 Automated guideway, Alaska railroad, cable car, ferryboat, inclined plane, jitney, monorail, Público, trolleybus, aerial tramway, and vanpool.
Rural Transit
Since 1978, the Federal government has contributed to the financing of transit in rural areas (i.e., areas with populations of less than 50,000). These rural areas are estimated to account for approximately 36 percent of the U.S. population and 38 percent of the transit-dependent population.
Funding for rural transit is currently provided through 49 USC Section 5311, which replaced Section 18 of the Urban Mass Transit Act in 1994. Rural transit funding was increased substantially with passage of TEA-21 and has continued to increase under SAFETEA-LU. Federal funding for rural transit was $240 million in the last year of TEA-21, FY 2004, and reached $465 million in FY 2009 under SAFETEA-LU. States may transfer additional funds to rural transit from highway projects, transit projects, or formula transit funds for small urbanized areas.
As shown in Exhibit 6-34, 27.6 percent of rural transit authorities’ operating budgets come from Federal Assistance funds. State and local governments cover 44.2 percent of their rural transit operating budgets through a combination of dedicated State and local taxes, appropriations from State general revenues, and allocations from other city and county funds. 20.2 percent of rural transit operating budgets comes from contract revenue, defined as reimbursement from a private entity (profit or non-profit) for the provision of transit service. Fares accounted for only 8.1 percent, close to the average farebox recovery rate for demand response service (which constitutes most of rural transit). In 2008, the total value of rural transit operating budgets reported to the NTD was $1.06 billion.