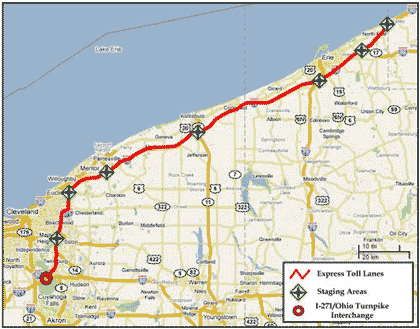
Longer Combination Vehicles on Exclusive Truck Lanes: Interstate 90 Corridor Case Study3.0 Facility CharacteristicsThis section outlines the physical and operational characteristics of the potential exclusive truck lane facility examined in this study. The physical characteristics include assumptions on the route, lanes, access, and staging areas. The physical features of the facility provide the basis for construction costs, which this section also estimates. The operational characteristics include assumptions about the types of vehicles, toll technologies, and operating and maintenance costs. 3.1 Highway Physical CharacteristicsRouteThe proposed exclusive truck lane in this scenario is a 128.1-mile highway section between Cleveland, Ohio, and the New York/Pennsylvania State Line on I-90. The route of the new exclusive truck lanes would commence at a new interchange of the Ohio Turnpike (I-80) and I-271 southeast of Cleveland, and would follow I-271 to I-90 on east side of Cleveland. Moving east, the ETLs would link I-271 to the New York Thruway, traversing a short distance in Pennsylvania near Erie. The primary reason in following I-271, instead of I-90 from its junction with the Ohio Turnpike, is cost savings provided by the existing I-271 highway envelope versus the I-90 right-of-way. Specifically, the I-271 right-of-way is generally more expansive than I-90 in metropolitan Cleveland; slightly reducing the potential land acquisition costs to accommodate the exclusive truck lanes cross section. Figure 3.1 illustrates the geography of the connection. Figure 3.1 I-90 Corridor Map With Staging Areas and Access Points
DesignThe exclusive truck lane facilities developed on this section would consist of the following physical attributes:
Access and Staging AreasThe hypothetical locations for access points and staging areas are identified in Figure 3.1. These hypothetical locations were chosen to provide linkages to existing highway facilities, and to serve local shipping communities. 3.2 Highway OperationsThe following figures (Figures 3.2 to 3.4) illustrate the typical configurations expected on the new exclusive truck lane. Figure 3.2 illustrates a typical semi-trailer combination unit, typically limited to 80,000 pounds gross vehicle weight (GVW), but capable of carrying a heavier load. The double-trailer configurations operate on all sections of the I-90 between Indiana and New York/Massachusetts, except for the gap in Northeast Ohio and the Pennsylvania Panhandle. The triple-trailer configuration operates exclusively on the Indiana and Ohio Turnpikes. Axle weights on all configurations must conform to Federal Bridge Formula B. Figure 3.2 Single 53-Foot Tandem
Figure 3.3 Twin 48-Foot (or 53-Foot) Trailers
Figure 3.4 Triple 28-Foot Trailers
Tolling and Technology ConsiderationsTollingIn addition to these LCV configurations, the ETL facility would be open to all commercial vehicle traffic, but would exclude other vehicle traffic. Generally, the facility would convey LCVs and some semi-trailer trucks, especially when congested conditions on the general purpose lanes made the ETLs more attractive. The next section, which provides utilization and toll estimates, includes a scenario in which all commercial vehicles with five or more axles (semi-tractor trailers and LCVs) choose to utilize the ETLs to provide an illustrative upper bound of potential ETL traffic. Toll collection would likely rely on current and emerging technologies to automatically collect tolls through overhead gantries using existing transponder systems such as E-ZPass. Safety TechnologiesSeparation of trucks from the general traffic stream provides safety benefits by reducing the number of potential truck-auto crashes. Section 5.0 estimates the results of these safety performance improvements. The safe operation of the facility could be further enhanced through the requirement of on-board safety technologies. The trucking industry representatives participating in this study extolled the ability of collision detection systems, rollover stability, and other technologies to greatly improve the safety performance of their fleets. The body of research on the safety impacts of technologies for LCVs continues to grow, but does not yet provide any usable factors to estimate the change in crash reductions from shifting loads from semi-trailer to LCV configurations. Based on observed experience, the technologies with the greatest safety mitigation potential for commercial vehicle operations – including LCVs – include at least the following:
While these technologies show great promise, researchers have not yet developed per-mile rates of crash avoidance and crash reduction for LCV fleets. As such, this study focuses on the crash reduction provided by separating trucks from the general purpose lanes. PlatooningAnother much discussed technology application with respect to truck lanes is “platooning.” This study does not estimate the effect of platooning, but the concept has garnered recent attention. Platooning would use connected vehicle technologies (Connected vehicle technologies, formerly known as Vehicle Infrastructure Integration (VII), utilize telematic devices and applications to link some of the operating characteristics of vehicles, and to exchange real-time information between vehicles and roadway infrastructure. In the case of platooning, connected vehicle technologies would enable a string of multiple LCVs to nearly operate as a single vehicle because of linked and synchronized acceleration, steering, and breaking.) to allow a lead tractor combination to simultaneously control or coordinate acceleration, braking, and steering to gain energy and emissions efficiencies by cutting air resistance. Research by Shladover and others indicates platooning could further reduce fuel consumption and tailpipe emissions by 10 to 20 percent beyond the efficiencies already realized by converting semi-trailer trucks to LCVs. In order for the platooning concept to produce these benefits, the freight corridor would require a critical mass of vehicles with common origins and destinations. Because the potential carriers using the study portion of the I-90 corridor serve a broad mix of origin and destination pairs, this study does not apply the platooning concept because it would affect a relatively small segment of the LCVs using the proposed ETL. Further reducing the likelihood of platooning on this corridor is the relatively short length of the ETL facility relative to the costs (time and labor) to assemble the platoons. 3.3 Capital Improvement CostsTaking into consideration the physical and operational characteristics of the corridor, this section provides planning-level estimates the capital costs to build the facility. Capital improvement cost data were derived from the FHWA’s HERS, and were applied to available highway segment data from the FHWA’s HPMS.
Keep in mind that all the costs and assumptions are at the sketch planning level of detail, and would require a more detailed engineering assessment to enhance accuracy. Per-mile cost estimates are based on the following assumptions in Table 3.1 based on HPMS network attributes. The following paragraphs explain the content of the table. In Table 3.1, the HPMS attributes include the following:
Based on these physical design characteristics, the final two columns of Table 3.1 indicate the expected changes to the highway, including the following:
After identifying the segment characteristics using HPMS data, the study team developed per-mile cost estimates using the HERS model. HERS per-mile cost estimates vary based on improvement definitions for urban and rural segments. For example:
Based on the assumptions identified above, Table 3.2 presents the total construction costs by applying lane-mile improvement costs from HERS to the HPMS characteristics of the highway segments. The costs include new lanes, ramps, new bridges and bridge upgrades, pavement reconstruction (where identified), and staging areas. Capital Cost SummaryBased on this analysis, the order-of-magnitude capital costs for this facility are more than $5 billion, consisting of the following major categories, all expressed in 2008 dollars:
Financing CostsTo pay for the capital costs of infrastructure, the project would likely require debt service payments to secure at least a portion of the financing. The market rate for toll facilities currently hovers around 5 percent. For example, the New Jersey Turnpike Authority bonds that mature in 2040 are yielding 5.25 percent. The possibility of public financing through the Transportation Infrastructure Finance and Innovation Act (TIFIA) program of the U.S. DOT could provide a lower-than-market rate (currently at 4.25 percent) for a portion of the investment. Assuming a mix of lower interest public financing and market rate bonds, at 5 percent the annual debt service for this investment would be $365.8 million (expressed as 2008 dollars). For this estimate a 30-year term is used to match the 30-year bonds traditionally issued by the Ohio Turnpike Commission and the Pennsylvania Turnpike Authority. 3.4 Maintenance and Operations CostsAnother important consideration is the costs associated with continued operations and maintenance of the facility. The estimating procedure from the recent GDOT study assumes annual operations and maintenance costs for a truck-only-toll lane corridor at 0.5 percent of total initial project capital cost plus 3 percent inflation per year. Applying this assumption to the I-90/I-271 corridor results in an average annual maintenance and operations cost estimate of $45.72 million from 2010 to 2040. 3.5 Cost SummaryCollectively, the annual capital and operating costs total $411.5 million (2008 dollars). Subsequent sections of this report estimate the potential toll revenues and benefits to public and private stakeholders to offset these costs. |