We located and estimated truck hours of delay for 14 types of highway truck bottlenecks. Table 5.1 lists the types of bottlenecks and the annual truck hours of delay associated with each type. The bottleneck types are sorted in descending order of truck hours of delay by constraint type (e.g., interchange, geometry, intersection, and capacity) and then within each group by the truck hours of delay for each bottleneck type.
| Bottleneck Type | National Annual Truck Hours of Delay, 2004 (Estimated) | ||
|---|---|---|---|
| Constraint | Roadway | Freight Route | |
| Interchange | Freeway | Urban Freight Corridor | 123,895,000 |
| Subtotal 123,895,000* | |||
| Steep Grade | Arterial | Intercity Freight Corridor | 40,647,000 |
| Steep Grade | Freeway | Intercity Freight Corridor | 23,260,000 |
| Steep Grade | Arterial | Urban Freight Corridor | 1,509,000 |
| Steep Grade | Arterial | Truck Access Route | 303,000 |
| Subtotal 65,718,000‡ | |||
| Signalized Intersection | Arterial | Urban Freight Corridor | 24,977,000 |
| Signalized Intersection | Arterial | Intercity Freight Corridor | 11,148,000 |
| Signalized Intersection | Arterial | Truck Access Route | 6,521,000 |
| Signalized Intersection | Arterial | Intermodal Connector | 468,000 |
| Subtotal 43,113,000‡ | |||
| Lane Drop | Freeway | Intercity Freight Corridor | 5,221,000 |
| Lane Drop | Arterial | Intercity Freight Corridor | 3,694,000 |
| Lane Drop | Arterial | Urban Freight Corridor | 1,665,000 |
| Lane Drop | Arterial | Truck Access Route | 41,000 |
| Lane Drop | Arterial | Intermodal Connector | 3,000 |
| Subtotal 10,622,000‡ | |||
| Total 243,032,000 | |||
The bottlenecks accrue 243 million hours of delay annually. At a delay cost of $32.15 per hour, the conservative value used by the FHWA's Highway Economic Requirements System model for estimating national highway costs and benefits, the direct user cost of the bottlenecks is about $7.8 billion per year.1
The individual bottlenecks in each category are unique and assigned to only one bottleneck type or category. Bottlenecks are not double counted across categories.
We located 227 interchange bottlenecks on freeways serving as urban freeway corridors. Most of these bottlenecks were at urban Interstate interchanges. The interchange bottlenecks include freeway-to-freeway interchanges and freeway-to-arterial interchanges. The bottlenecks were located by scanning the HPMS Universe database and represent a reasonably complete national inventory of this type of bottleneck. The total delay associated nationally with these bottlenecks in 2004 was estimated at about 124 million truck hours or 51 percent of the estimated total. At a delay cost of $32.15 per hour, the direct user cost of the bottlenecks is about $4 billion per year. The truck hours of delay were estimated using truck volumes and highway capacity calculations drawn from the FHWA's Freight Analysis Framework (FAF) database by Battelle.
Figure 5.1 shows the location of all highway interchange bottlenecks for trucks. The bottleneck locations are indicated by a solid dot. Most are located on urban Interstate interchanges. The size of the open circles accompanying each dot indicates the relative annual truck hours of delay associated with the bottleneck.
Figure 5.1 Interchange Capacity Bottlenecks on Freeways Used as Urban Truck Corridors
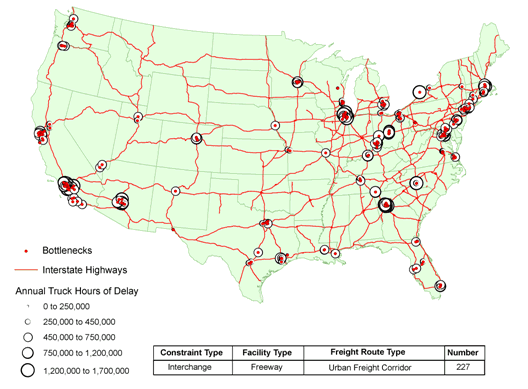
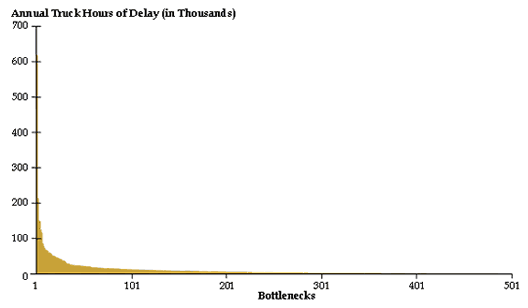
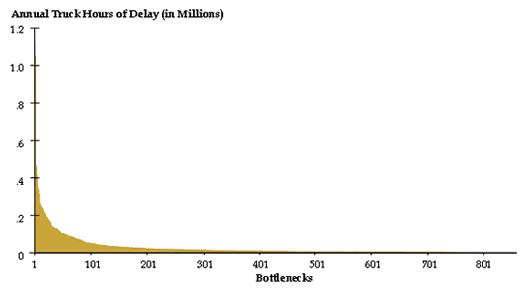
Figure 5.2 is a histogram showing the distribution of truck hours of delay for all highway interchange bottlenecks for trucks. The individual bottlenecks, each represented on the horizontal axis by an identification number, are sorted in descending order of annual truck hours of delay, which are measured on the vertical axis. Of the 227 highway interchange bottlenecks, 173 cause more than 250,000 truck hours of delay annually (equivalent to a direct user cost of about $8 million per year). By comparison only a few dozen of all the other truck bottlenecks cause more than 250,000 truck hours of delay annually.
Figure 5.2 Distribution of Annual Truck Hours of Delay at Highway Interchange Bottlenecks, 2004
The delay estimation methodology calculated truck delay resulting from queuing on the critically congested roadway of the interchange (as identified by the scan) and the immediately adjacent highway sections. It did not calculate delay on the other roadway at the interchange. This means that truck hours of delay were calculated on only one of the two intersecting highways or two of the four legs on a interchange, potentially underreporting total delay at the interchange. The bottleneck delay estimation methodology also did not account for the effects of weaving and merging at interchanges, which aggravates delay, but could not be calculated from the available HPMS data.
The next two tables list the top highway interchange bottlenecks for trucks. Table 5.2 lists the top 25 interchange bottlenecks ranked by annual hours of delay for all trucks. Table 5.3 lists the top 25 interchange bottlenecks ranked by annual hours of delay for large trucks making trip greater than 500 miles.
There is overlap between the tables, but the ranking by all trucks tends to flag interchanges in the nation's major freight hubs and trade gateways that serve high volumes of metropolitan and intercity truck traffic. The ranking by large trucks making trips greater than 500 miles tends to flag interchange bottlenecks that sit astride many of the key intersections of the nation's long-haul and transcontinental freight corridors.
In the tables, AADT is the abbreviation for Annual Average Daily Traffic, the number of vehicles, including automobiles and trucks of all sizes, traveling the critically congested roadway each day. AADTT is the abbreviation for Annual Average Daily Truck Traffic, the number of trucks of all sizes traveling the critically congested roadway each day. For comparison, Table 5.4 lists the top 25 most congested highway interchanges as identified in the American Highway Users Alliance study. These bottlenecks are ranked in descending order of annual hours of delay for all vehicles, including trucks.
Appendix A provides the full set of tables—as listed in Table 5.5—along with detailed definitions of each of the column headings and information about the sources of the data reported in the tables.
| Bottleneck | All Vehicles-2004 | All Trucks-2004 | "Large Trucks Making Longer Distance Trips"-2004 | ||||||||||||
|---|---|---|---|---|---|---|---|---|---|---|---|---|---|---|---|
| Location | Urban Area | Critically Congested Route No. | No. of Lanes | AADT | Daily Minutes of Delay per Vehicle | AADTT | Percent of All Vehicles | Annual Hours of Delay All Trucks | All Trips | Trips Greater Than 500 Miles | |||||
| AADTT | Percent of All Trucks | Annual Hours of Delay | Annual Commodity Tons | Annual Commodity Value | Percent of Large Truck Trips | Annual Hours of Delay | |||||||||
| I-90 @ I-290 | Buffalo-Niagara Falls | 90 | 4 | 136,500 | 8.3 | 33,100 | 24% | 1,661,900 | 7,300 | 22% | 367,000 | 2,632,500 | $2,968,000 | 58% | 212,900 |
| I-285 @ I-85 Interchange ("Spaghetti Junction") | Atlanta | 285 | 8 | 265,300 | 10.0 | 27,100 | 10% | 1,641,200 | 7,800 | 29% | 472,600 | 2,943,700 | $3,262,000 | 52% | 245,800 |
| I-17 (Black Canyon Fwy): I-10 Interchange (the "Stack") to Cactus | Phoenix | 17 | 6 | 217,300 | 9.2 | 28,900 | 13% | 1,608,500 | 9,000 | 31% | 501,600 | 3,326,700 | $3,792,000 | 48% | 240,800 |
| I-90/94 @ I-290 Interchange ("Circle Interchange") | Chicago-Northwestern IN | 90 | 8 | 305,800 | 9.7 | 26,300 | 9% | 1,544,900 | 9,200 | 35% | 540,400 | 3,718,000 | $4,218,000 | 53% | 286,400 |
| San Bernardino Fwy | Los Angeles | 10 | 8 | 268,700 | 7.2 | 34,900 | 13% | 1,522,800 | 11,200 | 32% | 488,700 | 4,094,500 | $4,780,000 | 31% | 151,500 |
| I-94 (Dan Ryan Expwy) @ I-90 Skyway Split (Southside) | Chicago-Northwestern IN | 94 | 8 | 271,700 | 7.9 | 31,600 | 12% | 1,512,900 | 11,100 | 35% | 531,500 | 4,485,900 | $5,089,000 | 53% | 281,700 |
| I-285 @ I-75 Interchange | Atlanta | 285 | 6 | 226,300 | 9.6 | 25,700 | 11% | 1,497,300 | 7,400 | 29% | 431,500 | 2,792,800 | $3,095,000 | 52% | 224,400 |
| SR 134 @ SR 2 Interchange | Los Angeles | 134 | 8 | 247,900 | 8.3 | 29,600 | 12% | 1,489,400 | 9,500 | 32% | 477,500 | 3,473,000 | $4,054,000 | 31% | 148,000 |
| I-77 @ Tryon Rd | Charlotte | 77 | 6 | 170,500 | 8.3 | 29,600 | 17% | 1,487,100 | 7,300 | 25% | 367,000 | 2,700,200 | $2,983,000 | 45% | 165,200 |
| Long Beach Fwy | Los Angeles | 710 | 8 | 246,100 | 8.3 | 27,500 | 11% | 1,380,300 | 8,800 | 32% | 442,400 | 3,217,100 | $3,756,000 | 31% | 137,100 |
| I-20 @ I-285 Interchange | Atlanta | 20 | 6 | 187,200 | 8.3 | 27,000 | 14% | 1,359,400 | 7,800 | 29% | 392,100 | 2,943,700 | $3,262,000 | 52% | 203,900 |
| I-80/I-94 split (Southside) | Chicago-Northwestern IN | 80 | 4 | 139,600 | 8.6 | 25,600 | 18% | 1,343,600 | 9,000 | 35% | 472,400 | 3,637,200 | $4,127,000 | 53% | 250,400 |
| SR 60 @ I-605 Interchange | Los Angeles | 60 | 8 | 233,000 | 8.3 | 26,100 | 11% | 1,314,200 | 8,400 | 32% | 422,300 | 3,070,900 | $3,585,000 | 31% | 130,900 |
| Pulaski Rd @ I-55 | Chicago-Northwestern IN | 55 | 6 | 197,200 | 7.5 | 28,700 | 15% | 1,300,400 | 10,000 | 35% | 453,700 | 4,041,300 | $4,585,000 | 53% | 240,500 |
| I-75 @ I-85 Interchange | Atlanta | 75 | 10 | 339,600 | 9.1 | 23,400 | 7% | 1,288,800 | 6,800 | 29% | 374,900 | 2,566,300 | $2,844,000 | 52% | 194,900 |
| I-93 @ I-95 Interchange | Boston | 93 | 6 | 188,400 | 8.3 | 25,500 | 14% | 1,280,100 | 2,800 | 11% | 140,800 | 1,020,000 | $1,220,000 | 36% | 50,700 |
| I-290 @ I-355 | Chicago-Northwestern IN | 290 | 6 | 223,100 | 8.3 | 24,800 | 11% | 1,246,200 | 8,700 | 35% | 437,300 | 3,515,900 | $3,989,000 | 53% | 231,800 |
| I-405 (San Diego Fwy) @ I-605 Interchange | Los Angeles | 405 | 10 | 331,700 | 9.8 | 20,900 | 6% | 1,245,500 | 6,700 | 32% | 398,600 | 2,449,400 | $2,859,000 | 31% | 123,600 |
| I-80 @ Central St. | San Francisco-Oakland | 80 | 8 | 270,200 | 8.3 | 23,800 | 9% | 1,196,700 | 7,800 | 33% | 392,100 | 2,851,500 | $3,329,000 | 29% | 113,700 |
| San Gabriel River Fwy | Los Angeles | 91 | 10 | 295,700 | 8.1 | 24,100 | 8% | 1,194,300 | 7,700 | 32% | 381,100 | 2,815,000 | $3,286,000 | 31% | 118,100 |
| I-20 @ Fulton St. | Atlanta | 20 | 6 | 207,300 | 8.1 | 23,700 | 11% | 1,172,700 | 6,800 | 29% | 336,500 | 2,566,300 | $2,844,000 | 52% | 175,000 |
| Bottleneck | All Vehicles-2004 | All Trucks-2004 | "Large Trucks Making Longer Distance Trips"-2004 | ||||||||||||
|---|---|---|---|---|---|---|---|---|---|---|---|---|---|---|---|
| Location | Urban Area | Critically Congested Route No. | No. of Lanes | AADT | Daily Minutes of Delay per Vehicle | AADTT | Percent of All Vehicles | Annual Hours of Delay All Trucks | All Trips | Trips Greater Than 500 Miles | |||||
| AADTT | Percent of All Trucks | Annual Hours of Delay | Annual Commodity Tons | Annual Commodity Value | Percent of Large Truck Trips | Annual Hours of Delay | |||||||||
| I-24 @ I-440N Interchange | Chattanooga (TN-GA) | 24 | 4 | 118,200 | 8.3 | 18,500 | 16% | 927,500 | 9,200 | 50% | 462,500 | 3,330,000 | $3,750,000 | 85% | 393,100 |
| U.S. 95 @ I-15 Interchange ("Spaghetti Bowl") | Las Vegas | 95 | 6 | 199,900 | 9.8 | 11,300 | 6% | 670,400 | 5,600 | 50% | 333,100 | 1,992,500 | $2,286,000 | 90% | 299,800 |
| I-90/94 @ I-290 Interchange ("Circle Interchange") | Chicago-Northwestern IN | 90 | 8 | 305,800 | 9.7 | 26,300 | 9% | 1,544,900 | 9,200 | 35% | 540,400 | 3,718,000 | $4,218,000 | 53% | 286,400 |
| I-94 (Dan Ryan Expwy) @ I-90 Skyway Split (Southside) | Chicago-Northwestern IN | 94 | 8 | 271,700 | 7.9 | 31,600 | 12% | 1,512,900 | 11,100 | 35% | 531,500 | 4,485,900 | $5,089,000 | 53% | 281,700 |
| I-75 @ I-74 Interchange | Cincinnati (OH-KY) | 75 | 6 | 193,100 | 9.7 | 19,200 | 10% | 1,128,900 | 6,900 | 36% | 405,300 | 2,735,200 | $3,044,000 | 63% | 255,300 |
| I-10 @ I-110 Interchange | Baton Rouge | 10 | 6 | 150,400 | 7.2 | 15,200 | 10% | 665,000 | 8,600 | 57% | 375,200 | 3,163,900 | $3,591,000 | 68% | 255,100 |
| I-80/I-94 split (Southside) | Chicago-Northwestern IN | 80 | 4 | 139,600 | 8.6 | 25,600 | 18% | 1,343,600 | 9,000 | 35% | 472,400 | 3,637,200 | $4,127,000 | 53% | 250,400 |
| I-285 @ I-85 Interchange ("Spaghetti Junction") | Atlanta | 285 | 8 | 265,300 | 10.0 | 27,100 | 10% | 1,641,200 | 7,800 | 29% | 472,600 | 2,943,700 | $3,262,000 | 52% | 245,800 |
| I-17 (Black Canyon Fwy): I-10 Interchange (the "Stack") to Cactus | Phoenix | 17 | 6 | 217,300 | 9.2 | 28,900 | 13% | 1,608,500 | 9,000 | 31% | 501,600 | 3,326,700 | $3,792,000 | 48% | 240,800 |
| Pulaski Rd @ I-55 | Chicago-Northwestern IN | 55 | 6 | 197,200 | 7.5 | 28,700 | 15% | 1,300,400 | 10,000 | 35% | 453,700 | 4,041,300 | $4,585,000 | 53% | 240,500 |
| I-290 @ I-355 | Chicago-Northwestern IN | 290 | 6 | 223,100 | 8.3 | 24,800 | 11% | 1,246,200 | 8,700 | 35% | 437,300 | 3,515,900 | $3,989,000 | 53% | 231,800 |
| I-40 @ I-24 Interchange | Nashville | 40 | 4 | 147,600 | 8.3 | 14,600 | 10% | 735,200 | 5,800 | 40% | 291,600 | 2,099,300 | $2,364,000 | 77% | 224,500 |
| I-285 @ I-75 Interchange | Atlanta | 285 | 6 | 226,300 | 9.6 | 25,700 | 11% | 1,497,300 | 7,400 | 29% | 431,500 | 2,792,800 | $3,095,000 | 52% | 224,400 |
| I-35 @ Martin Luther King Jr | Austin | 35 | 6 | 229,500 | 8.3 | 12,600 | 5% | 635,000 | 11,200 | 89% | 563,000 | 4,123,900 | $4,768,000 | 39% | 219,600 |
| I-15 between Tropicana and Flamingo | Las Vegas | 15 | 6 | 165,900 | 6.4 | 12,400 | 7% | 486,700 | 6,200 | 50% | 242,800 | 2,206,000 | $2,530,000 | 90% | 218,500 |
| I-12 @ Amite River, Baton Rouge | Baton Rouge | 12 | 4 | 105,000 | 6.4 | 14,400 | 14% | 561,900 | 8,100 | 57% | 317,200 | 2,980,000 | $3,383,000 | 68% | 215,700 |
| I-75 @ U.S. 35 Interchange | Dayton | 75 | 4 | 127,400 | 8.3 | 18,400 | 14% | 923,100 | 7,900 | 43% | 397,100 | 3,131,600 | $3,485,000 | 54% | 214,400 |
| I-90 @ I-290 | Buffalo-Niagara Falls | 90 | 4 | 136,500 | 8.3 | 33,100 | 24% | 1,661,900 | 7,300 | 22% | 367,000 | 2,632,500 | $2,968,000 | 58% | 212,900 |
| I-20 @ I-285 Interchange | Atlanta | 20 | 6 | 187,200 | 8.3 | 27,000 | 14% | 1,359,400 | 7,800 | 29% | 392,100 | 2,943,700 | $3,262,000 | 52% | 203,900 |
| I-75 @ I-85 Interchange | Atlanta | 75 | 10 | 339,600 | 9.1 | 23,400 | 7% | 1,288,800 | 6,800 | 29% | 374,900 | 2,566,300 | $2,844,000 | 52% | 194,900 |
| I-264 @ I-64 Interchange | Louisville (KY-IN) | 264 | 6 | 181,100 | 8.3 | 16,400 | 9% | 825,500 | 5,400 | 33% | 271,400 | 1,990,200 | $2,218,000 | 69% | 187,300 |
| I-55 (Stevenson Expwy) @ I-294 Interchange | Chicago-Northwestern IN | 55 | 6 | 172,600 | 9.6 | 17,200 | 10% | 1,001,600 | 6,000 | 35% | 349,900 | 2,424,800 | $2,751,000 | 53% | 185,400 |
| I-80 @ I-480 Interchange | Omaha (NE-IA) | 80 | 5 | 173,600 | 7.9 | 13,800 | 8% | 658,500 | 4,500 | 32% | 215,500 | 1,638,000 | $1,856,000 | 86% | 185,300 |
| I-76 @ SR 77 Interchange+J179 | Akron | 76 | 4 | 122,600 | 8.3 | 14,000 | 11% | 705,200 | 7,000 | 50% | 351,900 | 2,774,800 | $3,088,000 | 52% | 183,000 |
| I-15 @ I-215 Interchange (the "Fishbowl") | Las Vegas | 15 | 6 | 165,600 | 6.6 | 10,100 | 6% | 403,200 | 5,000 | 50% | 200,300 | 1,779,100 | $2,041,000 | 90% | 180,300 |
| Rank | City | Freeway | Location | Annual Hours of Delay (Hours in Thousands) |
|---|---|---|---|---|
| 1 | Los Angeles | U.S. 101 | U.S. 101 (Ventura Freeway) at I-405 Interchange | 27,144 |
| 2 | Houston | I-610 | I-610 at I-10 Interchange (West) | 25,181 |
| 3 | Chicago | I-90 | I-90/94 at I-290 Interchange ("Circle Interchange") | 25,068 |
| 4 | Phoenix | I-10 | I-10 at SR 51/SR 202 Interchange ("Mini-Stack") | 22,805 |
| 5 | Los Angeles | I-405 | I-405 (San Diego Freeway) at I-10 Interchange | 22,792 |
| 6 | Atlanta | I-75 | I-75 south of the I-85 Interchange | 21,045 |
| 7 | Washington (DC-Maryland-Virginia) | I-495 | I-495 at I-270 Interchange | 19,429 |
| 8 | Los Angeles | I-10 | I-10 (Santa Monica Freeway) at I-5 Interchange | 18,606 |
| 9 | Los Angeles | I-405 | I-405 (San Diego Freeway) at I-605 Interchange | 18,606 |
| 10 | Atlanta | I-285 | I-285 at I-85 Interchange ("Spaghetti Junction") | 17,072 |
| 11 | Chicago | I-94 | I-94 (Dan Ryan Expressway) at I-90 Skyway Split (Southside) | 16,713 |
| 12 | Phoenix | I-17 | I-17 (Black Canyon Freeway) at I-10 Interchange (the "Stack") to Cactus Road | 16,310 |
| 13 | Los Angeles | I-5 | I-5 (Santa Ana Freeway) at SR 22/SR 57 Interchange ("Orange Crush") | 16,304 |
| 14 | Providence | I-95 | I-95 at I-195 Interchange | 15,340 |
| 15 | Washington (DC-Maryland-Virginia) | I-495 | I-495 at I-95 Interchange | 15,035 |
| 16 | Tampa | I-275 | I-275 at I-4 Interchange ("Malfunction Junction") | 14,371 |
| 17 | Atlanta | I-285 | I-285 at I-75 Interchange | 14,333 |
| 18 | Seattle | I-5 | I-5 at I-90 Interchange | 14,306 |
| 19 | Chicago | I-290 | I-290 (Eisenhower Expressway) Between Exits 17b and 23a | 14,009 |
| 20 | Houston | I-45 | I-45 (Gulf Freeway) at U.S. 59 Interchange | 13,944 |
| 21 | San Jose | U.S. 101 | U.S. 101 at I-880 Interchange | 12,249 |
| 22 | Las Vegas | U.S. 95 | U.S. 95 west of the I-15 Interchange ("Spaghetti Bowl") | 11,152 |
| 23 | San Diego | I-805 | I-805 at I-15 Interchange | 10,992 |
| 24 | Cincinnati | I-75 | I-75, from Ohio River Bridge to I-71 Interchange | 10,088 |
| Appendix A Table Number | Bottlenecks | Ranked in Descending Order of Annual Truck Hours of Delay for … |
|---|---|---|
| Table A.1 | Top 25 | All Trucks |
| Table A.2 | Top 25 | Large Trucks Making Longer Distance Trips ("FAF Trucks") |
| Table A.3 | Top 25 | Large Trucks Making Longer Distance Trips ("FAF Trucks") Greater Than 500 Miles |
| Table A.4 | All top-ranked bottlenecks as identified in Tables 6.1, 6.2, and 6.3, eliminating duplicate listings | Large Trucks Making Longer Distance Trips ("FAF Trucks") Greater Than 500 Miles |
| Table A.5 | All | All Trucks |
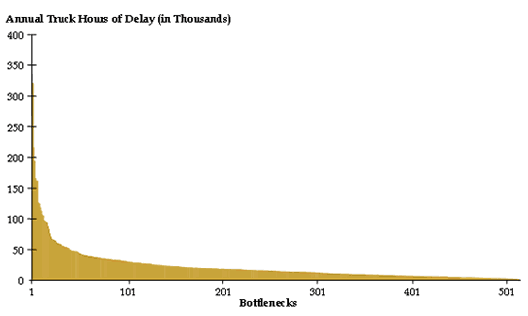
We located 859 bottlenecks created by steep grades on freeways and arterials. These bottlenecks were located by scanning the HPMS Sample database for roadway sections with grades greater than 4.5 percent and more than a mile long. These bottlenecks represent a partial inventory of this type of bottleneck. Using HPMS expansion factors, we estimate that the total delay associated nationally with this type of bottleneck in 2004 was about 66 million truck hours or 27 percent of the total truck hours of delay. At a delay cost of $32.15 per hour, the direct user cost of the bottlenecks is about $2.1 billion per year.
The estimates were made by applying the sample expansion factors provided in the HPMS Sample database to truck hours of delay for each the identified bottlenecks. The statistical framework for the HPMS makes it possible to estimate the total truck hours of delay associated nationally with freight bottlenecks on these roadway but not to estimate the actual number of bottlenecks or pinpoint all their locations.2 The truck volumes and highway capacity calculations were based on the HPMS Sample statistics.
Steep-grade bottlenecks on arterial roadways serving as intercity freight corridors accounted for 40 million of the 66 million truck hours of delay attributed to steep-grade bottlenecks. Figure 5.3 shows the location of the steep-grade bottlenecks on arterial roadways serving as intercity freight corridors. The bottleneck locations are indicated by a solid dot. Most are located on urban Interstate interchanges. The size of the open circles accompanying each dot indicates the relative annual truck hours of delay associated with the bottleneck. Again, because of the constraints of the HPMS Sample database, the map does not identify all bottlenecks of this type.
Figure 5.3 Steep Grade Bottlenecks on Arterials Used As Intercity Truck Corridors
HPMS Sample Sections Only
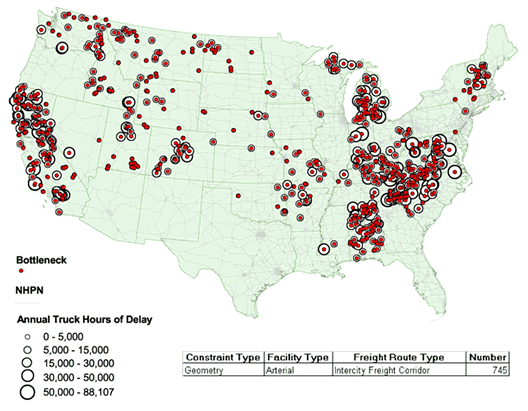
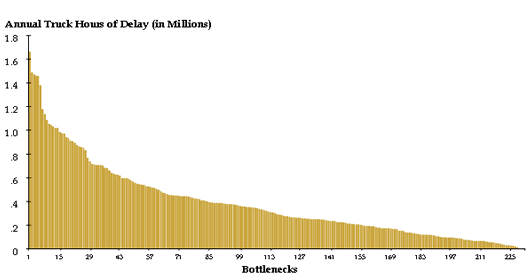
Figure 5.4 shows the distribution of truck hours of delay by bottleneck for all steep-grade bottlenecks. The vertical-axis scale has been adjusted downward to the highest delay value in the chart. The figure shows only those bottlenecks identified from the HPMS Sample database and therefore undercounts the actual number of these bottlenecks. The delay hours shown are the unexpanded estimates for the individual bottlenecks.
Figure 5.4 Distribution of Annual Truck Hours of Delay at Steep Grade Bottlenecks
2004, HPMS Sample Sections Only
We located 517 bottlenecks caused by signalized intersections on arterials. These bottlenecks were located by scanning the HPMS Sample database for signalized roadway sections with a volume-to-capacity ratio greater than 0.925. These bottlenecks also represent a partial inventory of this type of bottleneck. Expanding the sample, we estimate that the total delay associated nationally with this type of bottleneck in 2004 was about 43 million truck hours of delay. At a delay cost of $32.15 per hour, the direct user cost of the bottlenecks is about $1.4 billion per year. The truck volumes and highway capacity calculations were based on the HPMS Sample statistics.
Signalized-intersection bottlenecks on arterials serving as urban freight corridors accounted for 25 million truck hours of delay or 58 percent of the total for Signalized-intersection bottlenecks. Figure 5.5 shows the location of signalized-intersection bottlenecks on arterials serving as urban freight corridors. The bottleneck locations are indicated by a solid dot. Most are located on urban Interstate interchanges. The size of the open circles accompanying each dot indicates the relative annual truck hours of delay associated with the bottleneck.
Figure 5.5 Signalized Intersection Bottlenecks on Arterials Used As Urban Truck Corridors
HPMS Sample Sections Only
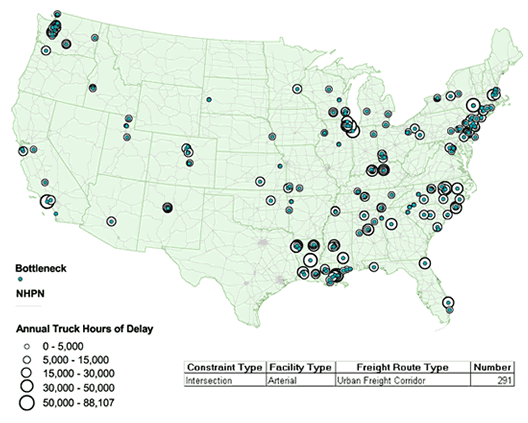
Figure 5.6 shows the distribution of truck hours of delay by bottleneck for all signalized-intersection bottlenecks for trucks. Again, the vertical-axis scale has been adjusted downward to the highest delay value in the chart. The figure shows only those bottlenecks identified from the HPMS Sample database and therefore undercounts the actual number of these bottlenecks. The delay hours shown are the unexpanded estimates for the individual bottlenecks.
Figure 5.6 Distribution of Truck Hours of Delay at Signalized Intersection Bottlenecks
2004, HPMS Sample Sections Only
Finally, we located 507 bottlenecks created by lane drops and restricted capacity on arterials and freeways, typically locations where a roadway necks down from three lanes to two or two lanes to one and the volume-to-capacity ratio is greater than 0.925. These bottlenecks were located by scanning the HPMS Sample database. Expanding the sample, we estimated that the total delay from this type of bottleneck nationally in 2004 was about 11 million truck hours of delay or 5 percent of the total. At a delay cost of $32.15 per hour, the direct user cost of the bottlenecks is about $354 million per year. The truck volumes and highway capacity calculations were based on the HPMS Sample statistics.
Lane-drop bottlenecks on freeways serving intercity freight corridors accounted for 5.6 million annual truck hours of delay or about 53 percent, Figure 5.8 shows the location of lane-drop bottlenecks on freeways serving intercity freight corridors. The bottleneck locations are indicated by a solid dot. Most are located on urban Interstate interchanges. The size of the open circles accompanying each dot indicates the relative annual truck hours of delay associated with the bottleneck.
Figure 5.7 Capacity Bottlenecks on Freeways Used As Intercity Truck Corridors
HPMS Sample Sections Only
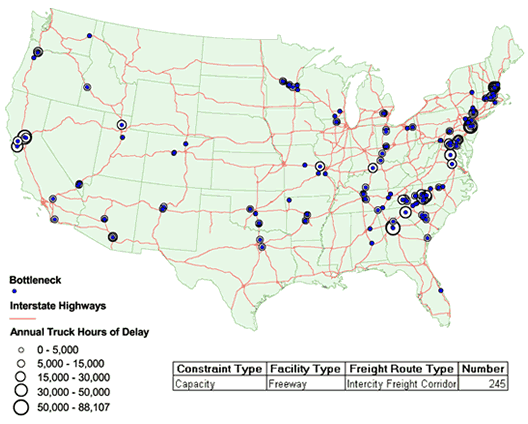
Figure 5.9 shows the distribution of truck hours of delay by bottleneck for all lane-drop bottlenecks for trucks. The vertical-axis scale has been adjusted downward to the highest delay value in the chart. The figure shows only those bottlenecks identified from the HPMS Sample database and therefore undercounts the actual number of these bottlenecks. The delay hours shown are the unexpanded estimates for the individual bottlenecks.
Figure 5.8 Distribution of Annual Truck Hours of Delay at Lane-Drop Bottlenecks
2004, HPMS Sample Sections Only