Railroads, motor carriers, barge, and pipeline are the major modes of transportation for moving intercity freight throughout the nation. Rail and motor carriage account for the greatest share of total freight tons and revenues, with motor carriers accounting for 90 percent of the combined rail and truck revenue share.40 Railroads handle significantly more bulk traffic such as coal and chemicals than trucks, but compete with trucks for certain high value commodities, primarily through intermodal service offerings.
As discussed in the Department's Comprehensive Truck Size and Weight (CTS&W) Study, increases in truck sizes and weights change the economics of truck-rail competition by providing new opportunities for truck productivity improvements. Allowing heavier payloads reduces truck transportation and other logistics costs facing the shipper. To the extent that the trucking industry is able to offer shippers lower total logistics costs, shippers will tend to shift freight that currently moves by rail to the larger, heavier trucks. Because rail is a decreasing cost industry (See Figure X-1) with high fixed costs, loss of traffic will necessarily require spreading those costs across a smaller traffic base, increasing the rail unit cost for handling the remaining traffic. Consequently, shippers remaining on the railroad may face higher rail rates, and to the extent that is the case the net national shipper cost saving attributable to productivity improvements of larger trucks will be reduced.
|
Railroads are a decreasing cost industry because they face high fixed and common costs to maintain an extensive network, including the costs of right-of-way acquisition, roadbed preparation, installation of track and signals, etc. This network must be in place before any freight can move. Once an initial investment has been made to provide a given level of capacity, per-unit-costs decline as production increases up to capacity. As output increases to that point, per unit fixed costs and common costs decrease because they are spread over more and more units. Conversely, as railroad traffic shrinks, fixed and common costs are spread over a smaller traffic base, resulting in higher costs per unit |
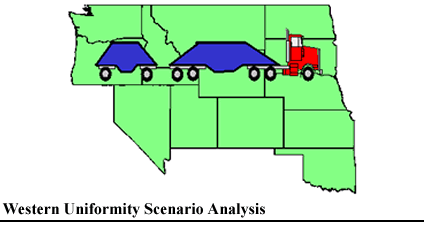
The Western Uniformity Scenario studied in this report is analyzed in this chapter by estimating the effects on railroads' financial condition when new LCV configurations, TPDs, RMDs, and triples are more generally permitted in the identified Western States.41 The analysis measures the financial impact on the nation's Class I rail industry as a whole, and separately on the two western carriers that would be affected the most - the Burlington Northern and Santa Fe Railway Company (BNSF) and the Union Pacific Railroad Company (UP). The analysis considers both the shorter doubles (low-cube case) and the longer doubles (high-cube case) - triples are permitted in both cases.
In 2000, the data year for this study, the freight railroad industry produced a record 1.47 trillion ton-miles that generated revenue of $34.1 billion, despite the fact that revenue yield fell to 2.26 cents per ton-mile - a level 15.1 percent lower in nominal dollars, and 30.7 percent lower in real dollars than in 1990.43 Eight major railroad systems accounted for 91 percent of the industry's total revenue.
The Class I railroad industry is in comparatively better financial condition today than in previous decades, having addressed serious structural problems, upgraded plant and facilities, and taken advantage of technological improvements to better serve customers. Net revenues after operating expenses reached $5.1 billion in 2000, and net income, a measure of profitability, totaled $3.9 billion. The industry operating ratio (expense/revenue) was 85.2, providing an indicator of how efficiently costs were managed. Nevertheless, the industry's return on investment (ROI) was only 6.5 percent, reflecting a continuing decline in ROI since registering a high of 9.4 percent in 1996.
As noted above, the principal carriers affected by the Western Uniformity Scenario are the BNSF and the UP - the two Class I railroads that traverse the geographic region of the study. In 2000, these two rail systems accounted for 55 percent of total industry miles of railroad operated, originated over 51 percent of industry carloads, and generated 58 percent of industry revenues. Principal commodities handled by these carriers are coal, chemicals, grain, and intermodal traffic.
The UP is the larger of the two railroads, owning nearly 29,000 miles of road and operating over an additional 4,000 miles of road through trackage rights. The somewhat smaller BNSF owns close to 26,000 miles of road, but operates over a total of about 33,400 miles with trackage rights included. UP originated nearly 7.4 million carloads and BNSF originated 6.9 million carloads in 2000. This traffic generated more than $10.5 billion in operating revenue for UP, and $9.2 billion for BNSF. BNSF's ROI at 8.1 percent, topped UP's 6.6 percent ROI.
This section describes the procedure for estimating financial impacts on the rail industry, and the two western carriers, due to diverted rail shipments, and carrier rate reductions to retain shippers' traffic on the railroad. The objective of the analysis is to compute revised industry and study railroads' balance sheets for the year 2010 and reflect the effects of the scenario's low-cube and high-cube cases. Measures of impacts on revenues, freight service expense (FSE), contribution to overhead and profit, and ROI are assessed.
The rail impact analysis employed two models - the DOT's Intermodal Transportation and Inventory Cost (ITIC) Model (discussed in Chapter III) and an Integrated Financial Model. Exercising these models required that data for the analysis be extrapolated from the year 2000 to the Study Year 2010. To accomplish this, rail traffic growth rates developed from the Freight Analysis Framework (FAF)44 were applied to the following data sources: 1) Class I railroad financial and operating statistics in the Analysis of Class I Railroads—2000;45 and 2) the 2000 Surface Transportation Board's (STB's) Carload Waybill Sample (CWS).
Traffic and revenue diversions used to assess rail impacts were derived from the ITIC Model. Using the forecast 2010 rail freight flows of the CWS as a base case, the ITIC Model estimates shipper transportation and inventory costs for moving the freight by rail and by the competing truck configurations. The ITIC model assumes that railroads respond to increased truck productivity by reducing their own rates - down to variable cost if necessary - to prevent diversion of rail freight traffic to trucks.46 If motor carriers can offer shippers lower transportation and inventory carrying costs than rail variable cost plus inventory carrying costs, the model predicts that the railroad will lose the traffic and the shipments divert to truck. This assumption produces a conservative estimate of diverted rail traffic.
As truck transportation costs decrease, the rail industry will experience three separate but related post-diversion effects:
It is important to note that for diverted traffic, railroads lose revenue and some costs. When discounting rates to hold traffic, railroads lose revenue but all costs remain. The effects listed above were measured for both low- and high-cube cases using two key ITIC Model outputs: 1) the remaining rail revenues after accounting for losses in revenues from both diversion and from rate discounting to hold traffic; and 2) the remaining post-diversion rail ton-miles. Percent changes from the 2010 base case revenues and ton-miles were calculated using these outputs for each study scenario, and applied to the comparable financial and operating statistics in the Association of American Railroads' (AAR), Analysis of Class I Railroad 2000 (grown to the Year 2010). The adjusted AAR data on revenues and ton-miles were subsequently used as inputs to an Integrated Financial Model. The financial model uses measured changes in income statement variables - revenues, expenses, income, and cash generated and expended to produce revised industry, and study railroad balance sheets that reveal the effect of the lost revenues and ton-miles on the railroads' financial condition.47
The revised Balance Sheets reflect a new rail cost resulting from traffic diversion (freight service expense (FSE) in the AAR data). To calculate the reduction in FSE, the model applies a cost elasticity coefficient that measures the change in cost associated with a change in ton-miles.48 For the rail industry the cost elasticity used is 0.6264, reflecting that as railroads lose traffic, costs do not decrease in a one-to-one relationship with ton-miles. Rather, railroads shed costs much more slowly because of the high fixed and common cost components of total cost that characterize the industry. To illustrate, if there were a 10 percent decline in rail ton-miles, the application of the 0.6264 elasticity coefficient indicates that freight cost (FSE) would only decline by about 6.3 percent. As a consequence, the cost to handle the remaining traffic in terms of cost per ton-mile would increase in the post-diversion case. This increased cost for remaining rail traffic can be thought of as a partial offset to calculated shipper cost savings found for rail shippers shifting to trucks as a result of the two cases, yielding the net national change in shipper costs.
The cost elasticities applied in the analysis for the industry and the Study railroads are noted in the Table X-1.
| Railroad | Elasticity |
|---|---|
| Industry | 0.6264 |
| Burlington Northern Santa Fe | 0.6632 |
| Union Pacific | 0.7113 |
The results of the rail impact analyses are generally plausible but some bias may have been introduced due to data restrictions and, more importantly, because of assumptions made concerning present and future conditions in freight transportation. These assumptions are reflected in the growth rates applied to rail traffic volume.
The railroad industry has experienced large productivity gains since its partial deregulation in 1980. For the purpose of this study, the issue is whether those gains will continue to 2010, and whether the analysis should take account of them. Our review found a consensus among observers of the rail industry that the railroads have virtually exhausted the efficiencies that can be wrung from their existing plant, and significant future productivity gains will require massive infusion of capital investment. Whether, and to what extent that capital investment will be made is highly uncertain, particularly if there is erosion of railroad financial viability. In any case, while stepped up investments will be made to accommodate 2010 traffic (and were included in the Financial Model), efficiency or productivity gain is expected to significantly lag the industry's performance in past decades. Therefore, it can be concluded that the effect on the rail impact results using a static productivity assumption are minor.
As previously noted, the cost elasticity applied to the Class I Railroad industry is 0.6264. It was developed, along with individual railroad elasticities, in an econometric analysis of the industry based on Railroad R-1 Report data from 1978 through 1998. The issue is whether the coefficient can be applied credibly to data for the Year 2010, i.e., to what extent will the coefficient change in the intervening years? While the precise change in the elasticity coefficient is unknown, we believe any change in the Study's impact measurements would be insignificant. Table X-2 shows the results of eight studies stretching from 1974 - 2000, where different researchers calculated the elasticity of cost with respect to changes in rail output. In general, the elasticity coefficients have not changed significantly over a period of more than twenty-five years. Therefore, for the purpose of this Study, and calculation of rail financial impacts, use of the 1998 cost elasticity coefficient is unlikely to have a substantially misleading effect on the outcome.
| Study | Returns to Density** | Cost Elasticity |
|---|---|---|
| Keeler (1974) | 1.79 | 0.5586 |
| Harris (1976) | 1.72 | 0.5813 |
| Harmatuck (1979) | 1.92 | 0.5208 |
| Friedlaender & Spady (1981)*** | 1.16 | 0.8620 |
| Caves, Christensen, Tretheway, & Windle 1985) | 1.76 | 0.5681 |
| Berndt, Friedlanender, Chiang, & Velturo (1993) | 1.57 | 0.6380 |
| McCullough (1993) | 1.64 | 0.6101 |
| Bitzan (2000) | 1.60 | 0.6264 |
* Gerard J. McCullough, A Synthetic Translog Cost Function for Estimating Output Specific Railroad Marginal Costs, p 4, October, 1993. (We have taken the liberty of expanding McCullough's original table by including the elasticities from his study and the most recent elasticities from Bitzan.
** Returns to density for all of the studies except Berndt et al. are reported in Caves et al. (1985). Elasticity of cost with respect to output is the inverse of returns to density.
*** McCullough notes that early work by Friedlanender & Spady (1981)was subsequently revised downward, which corresponds more closely with the other cost elasticities in the table.
Table X-3 illustrates the total freight revenues, FSE, contribution, and ROI for the industry and the two western carriers for the base case. The base case applies the 2000 revenue per ton-mile for CWS shipments to the estimated Year 2010 ton-miles, providing estimates in terms of constant 2000 dollars. For the industry, freight revenues would be $43.2 billion. FSE incurred for moving the traffic would be $37.8 billion. Contribution at less than $5.5 billion is the difference between revenue and freight service expense. It represents the amount available to cover fixed cost, income taxes, shareholder profits, and capital investment to improve and maintain the plant to continue to meet customers' demands. Because contribution is closely linked to ROI, changes in contribution are an important measure of the impact of the scenarios on railroads' financial condition. ROI is the bottom line measure of a railroad's financial health because it affects access to financial markets. An insufficient ROI generally means that a railroad will not be able to marshal sufficient financial resources to replace capital assets over the long run.
| Railroad | Revenue | Freight Service Expense | Contribution | ROI (Percent) |
|---|---|---|---|---|
| Industry | $43,233.86 | $37,755.30 | $5,478.56 | 6.31% |
| Burlington Northern Santa Fe | $11,721.65 | $9,309.85 | $2,411.80 | 8.89% |
| Union Pacific | $13,182.53 | $11,237.39 | $1,945.15 | 6.67% |
Table X-4 illustrates, lost revenues, FSE, and contribution resulting from the analysis of the low-cube case. This case examines the effects on rail when twin 45-foot trailers, Rocky Mountain Doubles, and triple trailers are permitted on a larger continuous network. For the industry, the low-cube case would result in total lost revenues of $38 million, consisting of a $26 million loss from discounting as railroads reduced rail rates to retain traffic (if necessary to a variable cost floor), and $12.1 million lost revenue as traffic diverted to the truck configurations. Rail industry contribution would be depleted by nearly $35 million. Overall, the twin 45-foot trailer LCV accounted for nearly 70 percent of total revenue losses. On the other hand, none of the revenue losses were attributable to broader operation of the triples configuration.
| Railroad | Revenues Lost from Diversion | Revenues Lost from Rail Discounting | Total Lost Revenues | Lost Freight Service Expense | Lost Rail Contribution |
|---|---|---|---|---|---|
| Industry | $12.09 | $25.96 | $38.05 | $3.55 | $34.50 |
| Burlington Northern Santa Fe | $5.77 | $9.94 | $15.71 | $0.99 | $14.72 |
| Union Pacific | $6.12 | $15.51 | $21.62 | $2.16 | $19.46 |
For the industry, the $12.1 million revenue lost to diversion is associated with only a $3.5 million reduction in FSE, illustrating the fact that railroads do not shed costs proportionately as revenues are lost.
Table X-5 shows the losses in ton-miles, revenues, FSE, contribution, and resulting ROI in percentage terms. Clearly, losses are small in each of the categories. For example, contribution only declined by 0.006 percent, while ROI for the industry only fell from 6.31 percent in the base case to 6.27 percent.
As expected, the western railroads experience the bulk of the losses since the cases examined fall entirely within their operating territories. For the low-cube case, BNSF's and UP's revenue losses makeup 98 percent of the total industry loss. The remaining losses would be spread among the other interline carriers. For BNSF, revenue losses total $15.7 million while UP's are down $21.6 million. Reductions in freight service expense for the two carriers are $988,000 and $2.2 million, respectively. For BNSF, contribution declines by 0.006 percent and ROI falls from 8.89 in the base case to 8.83 in the low-cube case. UP's contribution falls 0.01 percent and ROI declines to 6.61 from 6.67 percent.
| Railroad | Ton-miles | FSE | Revenues | Contribution | Post Diversion ROI |
|---|---|---|---|---|---|
| Industry | -0.015% | -0.009% | -0.088% | -0.006% | 6.27 |
| Burlington Northern Santa Fe | -0.016% | -0.011% | -0.134% | -0.006% | 8.83 |
| Union Pacific | -0.027% | -0.019% | -0.164% | -0.010% | 6.61 |
Under this case, twin 48-foot LCVs, Rocky Mountain Doubles, and triple trailers are allowed to operate in the study region. Table X-6 shows the effects to the rail industry and the two western carriers resulting from the study vehicles.
| Railroad | Revenues Lost from Diversion | Revenues Lost from Rail Discounting | Total Lost Revenues | Total Lost Freight Service Expense | Total Lost Rail Contribution |
|---|---|---|---|---|---|
| Industry | $18.30 | $47.85 | $66.15 | $5.20 | $60.94 |
| Burlington Northern Santa Fe | $7.42 | $18.60 | $26.02 | $1.24 | $24.79 |
| Union Pacific | $10.48 | $28.54 | $39.02 | $3.44 | $32.91 |
The inclusion of a longer LCV configuration attracts more traffic off of the railroad, forcing them to discount rates more deeply to retain their current traffic moving in and through the region. For the industry, revenue losses totaled $66 million, with the western carriers losses of $65 million comprising over 98 percent of the total. The twin 48-foot configuration accounts for 80 percent of total revenue losses. Freight service expense dropped by $5.2 million for the industry and $1.2 and $3.4 million for BNSF and UP, respectively. Again, none of the losses were attributable to triples operations.
Table X-7 illustrates the percentage changes in ton-miles, revenues, freight service expense, contribution, and ROI. For the industry and BNSF, contribution fell by 0.01 percent with UP's falling by 0.018 percent. ROI for the industry dropped to 6.25 from 6.31 in the base case. For BNSF, ROI fell from 8.89 to 8.80, and UP's to 6.56 from 6.67 in the base case.
| Railroad | Ton-miles Percent Change | FSE Percent Change | Revenues Percent Change | Contribution Percent Change | Post Diversion ROI |
|---|---|---|---|---|---|
| Industry | -0.022% | -0.014% | -0.153% | -0.011% | 6.25% |
| Burlington Northern Santa Fe | -0.020% | -0.013% | -0.222% | -0.010% | 8.80% |
| Union Pacific | -0.043% | -0.031% | -0.296% | -0.018% | 6.56% |
The analysis above estimates the traffic and financial effects that the low-cube and high-cube cases would have on the financial condition of the railroad industry and the two study carriers. As expected, the industry changes in ROI and loss of contribution are small when compared with the effects of the nation-wide LCV scenario analyzed in the CTS&W Study—where ROI fell from 9.8 to 5.3 percent and contribution fell by $3.1 billion. Most significant, when compared with the CTS&W Study, is the loss in revenues from rail rate discounting to retain traffic, relative to revenue losses from traffic diversion. In the CTS&W Study, the loss in revenues from diversion consistently represented a larger share of the revenue losses—generally running 3.5 times greater than that from rate discounting. Here the results are reversed with revenue losses from rate discounting running over 2.5 times the losses from traffic diversion. While an analysis explaining the difference in these results is beyond the scope of this study, it is hypothesized that the geographic boundaries of the scenario studied are largely responsible. Most of the traffic the two western railroads carry originates, terminates, (or both) outside of the scenario States studied. Competing truck traffic, consequently, originates/terminates outside of the scenario States as well—requiring transloading of cargos at State borders to and from conventional configurations and LCVs. The transloading requirement clearly erodes some of the LCV productivity gains—enough that railroads are forced to discount rates, but not so deeply that a large proportion of the affected traffic is diverted to the LCVs.
Although losses to the carriers appear small, as with any business entity, railroads would attempt to make adjustments to return ROI and contribution to levels that were present in the base case. Most likely this would be accomplished through reduced investment and/or increases in the service adjusted rate to rail shippers, particularly those shippers on the BNSF and the UP.