U.S. Department of Transportation
Federal Highway Administration
1200 New Jersey Avenue, SE
Washington, DC 20590
202-366-4000
Traffic data lays the foundation for highway engineering, ranging from pavement and geometric layout to structures. The topics listed below provide specific information regarding how traffic data support different engineering designs.
Pavement design relies on traffic data associated with both the traditional ESAL method and the new MEPDG method. Quality traffic data ensures pavement is not over or under designed for the desired performance.
The Equivalent Single Axle Load (ESAL) method is a classical pavement design approach. An ESAL is a unit that converts the damaging effect of any axle load and configuration on a pavement into the equivalent number of standard 18,000‑pound (typically 80‑kN) single axle loads. Cumulative ESAL represents the total loads a pavement is expected to carry over its design life. ESALs are calculated by using vehicle classification counts and their corresponding Load Equivalency Factors (LEF). The necessary traffic data are explained below.
Axle Type
Classification of axle configuration (e.g., single, tandem, tridem) for traffic loading purposes.
Axle Load
The weight carried by a single axle converted by axle configuration (single, tandem, tridem, quad).
LEF (Load Equivalency Factor)
A multiplier that converts axle loads to ESALs, representing the equivalent number of 18,000-lb loads based on pavement damage. LEFs vary by axle group, pavement type, and serviceability, and are also called ESAL per-axle factors.
Cumulative Number of Axles
The total forecasted number of axles, by axle load group, expected over the pavement's service life based on traffic forecasting.
ESALs per Vehicle Class
The equivalent single axle loads for each axle load group, calculated by multiplying the load equivalency factor (LEF) by the cumulative number of axles.
W18 (Cumulative ESAL)
Total number of 18-kip equivalent single-axle loads over the pavement design life, summed across both directions. Calculated by multiplying the number of axles (by type and load) by their respective LEFs.
DD (Directional factor)
Directional traffic split of a two-way roadway.
DL (Lane splitting factor)
The % trucks in the design lane.
W18 (Design Lane ESAL)
Total number of 18-kip equivalent single-axle loads applied to the lane with heaviest traffic over the design life. Computed by applying directional and lane distribution factors to the total cumulative two-way ESAL.
Final Computation Equation

(summed over all axle load vehicle classes, in kips)
Where:

Where:
DD = traffic directional factor for a two-way roadway.
DL = The % trucks in the design lane.
W18 (Cumulative) = cumulative two-way ESAL projected for a roadway segment.
The AASHTO Mechanistic-Empirical Pavement Design Guide (MEPDG) is the latest FHWA recommended pavement design method, where pavement performance can be modeled with very specific traffic-related parameters. The MEPDG method requires traffic data from both demand forecasting and field monitoring covering both vehicle classification and axle weight. Specific traffic data and traffic input are presented below.
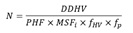
Directional Design-Hour Volume (DDHV)
DDHV is the proportion of AADT in the peak hour and predominant traffic direction, calculated as AADT × K-factor × D-factor. It helps estimate needed capacity for a desired LOS, balancing cost and adequacy.
Peak Hour Factor (PHF)
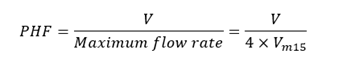
PHF measures variation in traffic demand within an hour, calculated as hourly volume divided by four times the peak 15-minute flow. The 15-minute period is used as it reflects stable flow. PHF influences the lanes needed to maintain the desired LOS.
MSFi
Maximum service flow rate for level of service i.
fHV
Heavy vehicle adjustment factor.
fp
Road user familiarity adjustment factor.
Annual Average Daily Truck Traffic
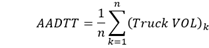
The average daily volume of truck traffic on a road segment for a year. Trucks are defined as vehicles of classes 4 through 13 in the FHWA's 13-category vehicle classification system. AADTT can be computed in two ways, i.e., the simple average and AASHTO methods shown below.
Simple Average Method Formula
AASHTO Method Formula

Where:
TruckVOLk = daily truck volume on the kth day of the year.
Truck VOLijm = daily truck volume for ith occurrence of the jth day of week within the mth month.
n = number of days in a year (365 or 366).
i = occurrences of day j in month m for which truck traffic data are available.
j = day of week (1 to 7).
m = month of year (1 to 12).
njm = number of occurrences of day j in month m for which truck traffic data are available.
Note:
Percent of Truck
Traffic in Design Direction =Percentage of truck traffic in the design
direction. Unless a roadway has an unbalanced travel for trucks, it should
always be 50%.
Percent of Truck Traffic in Design Lane
This is the percentage of truck traffic for the design lane. The design lane is typically the outside lane in a multilane highway (more than one lane in each travel direction).
Monthly Adjustment Factor
Seasonal variations in truck volumes. For each FHWA vehicle class (Classes 4–13), 12 monthly factors are computed by dividing the average daily truck traffic for each month (MADTT) by the total MADTT for the year, then multiplying by 12. This results in a total of 120 factors representing seasonal distribution across all vehicle classes.
Vehicle Class Distribution
AADTT distribution among the 10 vehicle types (FHWA vehicle class 4 to 13), expressed in percentages.
Hourly Adjustment Factor
Truck hourly distribution factor refers to the percentage of hourly AADTT among a 24-hour period starting at midnight.
Axle Load Distribution Factors
Percentage of axle counts within specific load bins (i.e. a weight range 0 to 3,000 lbs.) for FHWA vehicle classes 4–13 by axle type (single, tandem, tridem, quad). They are developed monthly based on axle load data if at least 7 days of data are available; otherwise, adjacent month averages or annual summaries are used.
Number of Axles per Truck Class for Each Axle Group
The number of axles per vehicle class for a given axle configuration is an annual average number of axles per vehicle category (per vehicle class and vehicle axle configuration).
Axle Spacing
The distance between two consecutive tandem, tridem, and quad axles.
Average Axle Width
The distance between the two outside edges of an axle.
Wheelbase
The distance between the steering and the first device axle of a tractor or a heavy single unit.
Annual Average Daily Traffic (AADT)
AADT estimates the average daily traffic volume for a location over an entire year. It measures how busy a road is, serves as a key input for transportation planning, and is used for funding allocation.
K-Factor
Proportion of AADT in the design hour volume (DHV). K-30, K-50, and K-100 are the 30th, 50th, and 100th highest hourly volumes as a percentage of AADT. K-30 is often used for design, but not always.
D-Factor
Directional Factor (D-factor) is the percentage of traffic in the peak direction during the peak hour. D-30 uses the 30th highest hourly volume of the year for design capacity analysis, while D-100 uses the 100th for LOS calculations.
Geometric design refers to the determinations of lane width, number of lanes, turning lanes, intersection layout, truck climbing lanes, and other horizontal and vertical alignment related design elements.
Lane widths influence driver comfort, operations, and crash likelihood.
Typical widths range from 9 to 12 ft, with 12 ft predominant on high-speed, high-volume highways.
Auxiliary lanes at intersections and interchanges should match through-lane width and not be less than 10 ft.
Continuous two-way left-turn lanes should be 10 to 16 ft. For local and collector roads carrying fewer than 2,000 AADT, alternative criteria may be appropriate on very low-volume roads.
When AADT exceeds 10,000, the highway is often considered as a high-volume roadway with an implied speed over 45 MPH.
The number of lanes is determined by a design-hour analysis that uses directional peak-hour demand.
The directional design-hour volume often called the peak-hour volume in the predominant direction is derived from AADT using K and D factors.
The typical HCM based steps and traffic data involved are illustrated below.
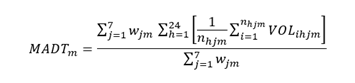
Monthly Average Daily Traffic (MADT) Formula
Where:
VOLihjm = total traffic volume for ith occurrence of the hth hour of day within jth day of week during the mth month.
i = occurrence of a particular hour of day within a particular day of the week in a particular month (i=1,… nhjm) for which traffic volume is available.
h = hour of the day (h=1,2,…24) – or other temporal interval.
j = day of the week (j=1,…7).
nhjm = the number of times the hth hour of day within the jth day of week during the mth month has available traffic volume (nhjm ranges from 1 to 5 depending on hour of day, day of week, month, and data availability).
wjm = the weighting for the number of times the jth day of week occurs during the m^th month (either 4 or 5); the sum of the weights in the denominator is the number of calendar days in the month (i.e., 28, 29, 30, or 31).
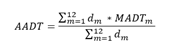
Annual Average Daily Traffic (AADT) Formula
Where:
MADTm = monthly average daily traffic for month m
m = month (m=1,…12).
dm = the weighting for the number of days (i.e., 28, 29, 30, or 31) for the mth month in the particular year.
K-Factor

Peak Hour Factor (PHF)
Where:
V = hourly volume in vehicles/h.
Vm15 = maximum volume during the peak 15-min of the analysis period (vehicles/15-min).
D-Factor

Directional Design-Hour Volume (DDHV)

Where:
K = the proportion of AADT occurring in the peak hour, i.e., the K-factor.
D = peak-hour volume proportion in the major direction, i.e., the D-factor.
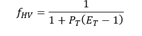
Heavy Vehicle Adjustment Factor ( fHV )
Where:
PT = proportion of SUTs and TTs in the traffic stream (decimal).
ET = passenger car equivalent to one heavy vehicle in the traffic stream (PCEs).
Number of Lanes (N) Computation
Climbing lanes on uphill sections of two-lane highways are a comparatively inexpensive way to restore capacity and improve operations when slow trucks and higher volumes cause congestion on grades. They are applied where truck speeds or LOS on the grade are substantially worse than on the approach.
According to AASHTO's Policy on Geometric Design of Highways and Streets (AASHTO's "Green Book"), a climbing lane is warranted when the following three criteria are satisfied:
Continuous two-way left-turn lanes (COTWLTL) can be used to reduce midblock left-turn conflicts on suburban and urban arterials where driveway spacing and turning volumes make conventional turn lanes or full access restrictions impractical. Left-turn movements can create congestion and safety issues by conflicting with both opposing and same-direction traffic, but COTWLTLs provide access to roadside properties while improving operations in a cost-effective manner, according to NCHRP Report 279: Intersection Channelization Design Guide. The traffic data used in Report 279 regarding such needs are listed below.
Vehicle Speed
Posted speeds should be under 45 mph to warrant a TWLTL, with design guidance applying to highways operating at 50 mph or less.
Turning Volumes / Peak Hour Traffic Volumes
70 midblock left turns per 1,000 ft during peak hour left-turn peak-hour volume of 20 percent or more of total volume.
Vehicle Mix / Proportion of heavy vehicles (HVs)
Wider lanes of 15–16 ft may be appropriate where heavy left-turn truck volumes are present, but these widths can encourage side-by-side opposing use, which is hazardous.
Dedicated right turning (RT) lanes typically improve through motorized traffic capacity significantly by reducing conflicts between through and turning vehicles. However, dedicated RT lanes may increase the time pedestrians need to cross the street. While no exact turning traffic volume is defined as the “sole” criterion for implementing a dedicated RT lane, the following traffic flows are on state DOT practices throughout the nation.
In the U.S., bridge design is primarily governed by Load and Resistance Factor Design (LRFD) methodology (via traffic loading model HL-93) to ensure structural integrity and longevity. Weigh-in-Motion (WIM) data can be used to refine these models under specific conditions.
New Design (23 CFR 625): With the proper approval, WIM data may be used to modify codified provisions, typically reserved for high-traffic sites.
In-Service Evaluation (23 CFR 650): The Manual for Bridge Evaluation (MBE) more broadly permits WIM data to assess existing structures, subject to approval.
For both design and evaluation, the following WIM parameters are required:
A summary of what traffic data are used in LRFD is provided below.
Traffic Data Needed for Fatigue Design
LRFD fatigue design evaluates the cumulative stress effects from repeated truck passages to prevent fatigue failure in steel bridges. It uses a calibrated fatigue truck model (HS-20 with fixed axle spacing of 30 ft. Its weight is 72 kips.) to estimate typical repetitive stress cycles. LRFD Article 3.6.1.4 suggests that designers consult traffic engineers.
Traffic Data Needed for Deck Design
LRFD specifications rely on standard axle groups. While Empirical and yield-line methods are still used, standard models may miss side-by-side axle effects and state-specific load limits.





