U.S. Department of Transportation
Federal Highway Administration
1200 New Jersey Avenue, SE
Washington, DC 20590
202-366-4000
May 2016
Office of Highway Policy Information
FHWA-HPL-16-026
This document is disseminated under the sponsorship of the U.S. Department of Transportation in the interest of information exchange. The U.S. Government assumes no liability for the use of the information contained in this document. This report does not constitute a standard, specification, or regulation.
The U.S. Government does not endorse products or manufacturers. Trademarks or manufacturers’ names appear in this report only because they are considered essential to the objective of the document.
The Federal Highway Administration (FHWA) provides high-quality information to serve Government, industry, and the public in a manner that promotes public understanding. Standards and policies are used to ensure and maximize the quality, objectivity, utility, and integrity of its information. FHWA periodically reviews quality issues and adjusts its programs and processes to ensure continuous quality improvement.
| 1. Report No. FHWA-HPL-16-026 | 2. Government Accession No. | 3. Recipient’s Catalog No. | ||||
| 4. Title Exploring Pedestrian Counting Procedures |
5. Date May 2016 |
|||||
| 6. Performing Organization Code: | ||||||
| 7. Author(s) Krista Nordback (PSU), Sirisha Kothuri (PSU), Theodore Petritsch (Sprinkle), Peyton McLeod (Sprinkle), Eliot Rose (ICF), and Hannah Twaddell (ICF) |
8. Performing Organization Report No. | |||||
| 9. Performing Organization Name and Address ICF International (ICF) 9300 Lee Highway, Fairfax, VA 22031 Portland State University (PSU) P.O. Box 751, Portland, OR 97207 Sprinkle Consulting, Inc.(Sprinkle) 18115 U.S. Highway 41 North Suite 600, Lutz, FL 33549 |
10. Work Unit No. | |||||
| 11. Contract or Grant No. DTFH61-13-D-00016 |
||||||
| 12. Sponsoring Agency Name and Address Office of Highway Policy Information Federal Highway Administration 1200 New Jersey Avenue, SE, Washington, DC 20590 David Jones, Project Manager |
13. Type of Report and Period Covered Research Result and Conclusion |
|||||
| 14. Sponsoring Agency Code HPPI |
||||||
| 15. Supplementary Notes None |
||||||
| 16. Abstract Clear and comprehensive information about pedestrian travel patterns is critical to multimodal transportation planning, programming, and management. This report covers existing guidance and best practices to recommend strategies for accurate, timely, and feasible measurement of pedestrian travel. Recommendations include: 1) expand the use of multi-day/multi-week counts to reduce estimation error rates, and rotate counts around the network; 2) validate equipment at installation and regularly thereafter; 3) tailor quality checks appropriate for low volume versus high volume locations; 4) compute bias compensation factors (e.g., occlusion adjustment factors) to account for limitations related to equipment and locations; and 5) conduct both short-duration and continuous counts to fully consider temporal and spatial aspects of pedestrian traffic patterns. |
||||||
| 17. Key Words Pedestrian, count, Annual Average Daily Pedestrians, short duration count, continuous count, data quality, data format, travel monitoring, non-motorized travel |
18. Distribution Statement No restrictions. This document is available to the public through the National Technical Information Service, Springfield, VA 22161. |
|||||
| 19. Security Classif. (of this report) Unclassified |
20. Security Classif. (of this page) Unclassified |
21. No. of Pages | 22. Price | |||
Form DOT F 1700.7 (8-72) Reproduction of completed
| Symbol | When You Know | Multiply By | To Find | Symbol |
|---|---|---|---|---|
| Length | ||||
| in | inches | 25.4 | millimeters | mm |
| ft | feet | 0.305 | meters | m |
| yd | yards | 0.914 | meters | m |
| mi | miles | 1.61 | kilometers | km |
| Area | ||||
| in2 | square inches | 645.2 | square millimeters | mm2 |
| ft2 | square feet | 0.093 | square meters | m2 |
| yd2 | square yard | 0.836 | square meters | m2 |
| ac | acres | 0.405 | hectares | ha |
| mi2 | square miles | 2.59 | square kilometers | km2 |
| Volume | ||||
| fl oz | fluid ounces | 29.57 | milliliters | mL |
| gal | gallons | 3.785 | liters | L |
| ft3 | cubic feet | 0.028 | cubic meters | m3 |
| yd3 | cubic yards | 0.765 | cubic meters | m3 |
NOTE: volumes greater than 1000 L shall be shown in m3 |
||||
| Mass | ||||
| oz | ounces | 28.35 | grams | g |
| lb | pounds | 0.454 | kilograms | kg |
| T | short tons (2000 lb) | 0.907 | megagrams (or "metric ton") | Mg (or "t") |
| Temperature (exact degrees) | ||||
| oF | Fahrenheit | 5 (F-32)/9 or (F-32)/1.8 |
Celsius | oC |
| Illumination | ||||
| fc | foot-candles | 10.76 | lux | lx |
| fl | foot-Lamberts | 3.426 | candela/m2 | cd/m2 |
| Force and Pressure or Stress | ||||
| lbf | poundforce | 4.45 | newtons | N |
| lbf/in2 | poundforce per square inch | 6.89 | kilopascals | kPa |
| Symbol | When You Know | Multiply By | To Find | Symbol |
|---|---|---|---|---|
| Length | ||||
| mm | millimeters | 0.039 | inches | in |
| m | meters | 3.28 | feet | ft |
| m | meters | 1.09 | yards | yd |
| km | kilometers | 0.621 | miles | mi |
| Area | ||||
| mm2 | square millimeters | 0.0016 | square inches | in2 |
| m2 | square meters | 10.764 | square feet | ft2 |
| m2 | square meters | 1.195 | square yards | yd2 |
| ha | hectares | 2.47 | acres | ac |
| km2 | square kilometers | 0.386 | square miles | mi2 |
| Volume | ||||
| mL | milliliters | 0.034 | fluid ounces | fl oz |
| L | liters | 0.264 | gallons | gal |
| m3 | cubic meters | 35.314 | cubic feet | ft3 |
| m3 | cubic meters | 1.307 | cubic yards | yd3 |
| Mass | ||||
| g | grams | 0.035 | ounces | oz |
| kg | kilograms | 2.202 | pounds | lb |
| Mg (or "t") | megagrams (or "metric ton") | 1.103 | short tons (2000 lb) | T |
| Temperature (exact degrees) | ||||
| oC | Celsius | 1.8C+32 | Fahrenheit | oF |
| Illumination | ||||
| lx | lux | 0.0929 | foot-candles | fc |
| cd/m2 | candela/m2 | 0.2919 | foot-Lamberts | fl |
| Force and Pressure or Stress | ||||
| N | newtons | 0.225 | poundforce | lbf |
| kPa | kilopascals | 0.145 | poundforce per square inch | lbf/in2 |
Clear and comprehensive information about pedestrian travel patterns is a critical component of multimodal transportation planning, programming, and management. Sound data on pedestrian system usage is needed by a wide variety of practitioners, including state and local agency staff responsible for traffic safety, operations, maintenance, planning, design, and construction, as well as system user outreach and education. Pedestrian travel has unique characteristics that affect the design and operation of data collection systems and analyses related to pedestrian facility usage and safety issues. Because of the unique characteristics of pedestrian travel, pedestrian counts require a distinct, valid, and replicable methodology that enables transportation agencies to assess pedestrian travel trends and needs on par with the established existing methods for monitoring motor vehicle travel.
The practice of monitoring motor traffic volumes has been a routine task for State Departments of Transportation (DOTs) since the 1950s. A federal mandate issued in 19971 spurred the development of DOT-operated traffic monitoring programs across the country. These programs have provided the transportation community, unified and consistent approaches in collecting and processing traffic data and the monthly motorized traffic volume data to Federal Highway Administration (FHWA). DOT staff from all states routinely avail themselves of relevant federally-sponsored training programs and resources, such as the FHWA Traffic Monitoring Guide (TMG), which provide ample information to support development and operation of vehicle traffic monitoring systems.
While motorized traffic monitoring systems are now ubiquitous across the nation, most transportation agencies do not collect data on nonmotorized traffic trends. The state of the practice has been defined by a relatively small group of DOTs and local transportation agencies that have chosen to take on the task of counting nonmotorized traffic, including pedestrians, for a variety of purposes, such as the following:
Each purpose involves specific data needs and requirements. For example, data on the number of pedestrian crossings at intersections are needed for signal timing and safety studies, but data on total pedestrians traveling through intersections may better support policy decisions. The pedestrian monitoring programs developed by these leading agencies were designed around individual needs and resources, and collectively do not represent a replicable, valid methodology than can be applied nationally. A national approach to pedestrian data collection includes standardization to the extent possible while acknowledging the unique data needs for different purposes.
Recognizing the importance of providing guidance on the collection of nonmotorized counts, FHWA updated the TMG in 2013 to include a new chapter on counting nonmotorized traffic. The new edition includes information on counting pedestrians, bicyclists, and other nonmotorized road and trail users. Even though both of these modes preceded the automobile, the counting of nonmotorized traffic has not been systematic or widespread in the U.S. and, even today, is not nearly as comprehensive as motorized traffic monitoring.
This report reviews, analyzes the issue, and provides a potential resource for moving toward the creation of a nationally applicable pedestrian counting methodology by combing existing guidance and best practices in order to identify key issues and recommend creative strategies for developing accurate, timely, and feasible approaches for measuring pedestrian travel. By incorporating findings from this project and related initiatives into national traffic monitoring training programs and resources, jurisdictions may advance the state of the transportation planning and design practice to support multimodal analyses that can help planners and engineers to identify strategic pedestrian investments that will improve safe, efficient multimodal accessibility for Americans of all ages, abilities, and economic levels.
This report discusses several aspects of pedestrian traffic counting elements, including:
For the purposes of this report, we use the following definitions for the above terms:
Automated counts refer to counts collected by machine, including automated counts from video using video-image recognition software. Manual counts are those collected by a human being either in person at the site or by watching video of the site later.
Short-duration counts include counts less than 24-hours in duration, often collected manually, and Mid-term counts collected by mobile automated equipment for multi-day or multi-week time periods.
Continuous counts are automated counts collected 24 hours a day, 365 days a year at permanent count stations over at least a one-year period.
Intersections refer to any road or path junction, including roundabouts and traffic circles. Segments are road or path segments between intersections. We use the term “segment” instead of the term “screenline,” which is used in the TMG, to avoid confusion with the alternative definition of “screenline” commonly applied to cordon counts around a city or region.
This report is organized into six main sections, as described below.
Sections 2 through 5 each begin with an introduction, followed by insights from reviews of literature and other resources, and a concluding summary of findings and recommendations.
Over the last decade, there has been increased emphasis on no motorized travel at the national as well as local level. As a result, agencies are investing in the collection and storage of nonmotorized count data. These count data are critical for conducting safety analyses, monitoring trends, prioritizing projects, predicting future demands on a facility, planning and infrastructure design, and calibrating and validating travel demand models.
While motorized travel counting methods and data collection technologies are well established, methods and technologies to collect nonmotorized data are fairly new and have been continuously evolving over the last few years. In 2014, the Transportation Research Board (TRB) bicycle and pedestrian data subcommittee published a research circular that detailed the state of research and practice with respect to nonmotorized travel and behavior.2 In the same year, the National Highway Cooperative Research Program (NCHRP) Report 797 Guidebook on Pedestrian and Bicycle Volume Data Collection and companion Web-only Document 205, provided a comprehensive overview of methods and technologies for collecting bicycle and pedestrian data and guidance for agencies seeking to establish count programs.3
The purpose of this chapter is to review existing academic literature on the various elements associated with nonmotorized counting programs as well as to document insights from practitioners. Practitioner input was solicited through two means: a nationally distributed webinar open to all interested staff and members of the public, and individual telephone interviews with a small representative sample of transportation professionals. This chapter is organized in the following manner: a review of the academic literature, a summary of input from the webinar and interviews, and key findings.
The project team conducted an academic literature search to identify literary sources for pedestrian travel counting using the TRB TRID database to conduct the search. In addition to TRID, we drew on sources identified in the TMG, NCHRP Report 797 Guidebook on Pedestrian and Bicycle Volume Data Collection, the TRB Bicycle and Pedestrian Data Subcommittee’s 2014 research circular, and a 2011 report on pedestrian and bicycle data collection by AMEC E&I Inc. and Sprinkle Consulting4. The academic literature search revealed studies in the following areas: Counting Programs, Count Duration and Timing, Count Site Selection, Technologies and Managing Count Data. Each of these is described further below. The Appendix contains summaries of the relevant studies in each category.
There are a number of elements associated with planning and implementing nonmotorized data collection programs. NCHRP 797 outlines the following steps necessary to establish a counting program.
Planning a count program is a critical step prior to implementation. Steps involved in planning a count program are as follows:
NCHRP 797 outlines the following steps for implementing a continuous counting program.
Although there is a growing consensus on the importance of collecting nonmotorized data, only a few states have started to institutionalize data collection procedures and policies, drawing upon limited existing guidance. The lack of widespread count programs is often due to a combination of lack of resources, lack of guidance, and perceived need and program and project priority.
The first effort to design a nationwide counting program, undertaken by Alta Planning and Design and the Institute of Transportation Engineers in 2004, was titled the National Bicycle and Pedestrian Demonstration Project (NBPDP)5. Since then a few states, as well as some cities and counties, have established both continuous and short-duration count programs. The Appendix provides a table of relevant literature and key takeaways from research on these efforts; the following paragraphs highlight key findings.
Baker et al. reviewed various state counting programs.6 Their 2012 review revealed that 16 states had established bicycle and pedestrian programs with some travel monitoring, 18 states had programs but did not perform any counting, and 16 states had no programs and did not conduct any nonmotorized counting. Baker et al. identified the states of Colorado, Vermont and Washington as leaders with respect to counting nonmotorized traffic, but did not provide specific detail on the type and extent of pedestrian counting programs. In a related study, Lindsey et al. outlined the progress made by Colorado, Oregon and Minnesota in establishing counting programs and suggested more research to determine the appropriate number of locations for continuous and short-duration counts necessary to characterize flows on a network, as well as the resources needed to institutionalize such programs.7 Minge et al. also provided recommendations for setting up a count program in Minnesota8.
Schneider et al. performed case studies of 29 communities engaged in nonmotorized data collection.9 The communities studied use nonmotorized data to determine trends in activity, safety and facility usage; estimate peak hour and temporal adjustment factors; identify locations for facility improvements, conduct bicycle and pedestrian planning; and integrate nonmotorized modes into multimodal models and analyses.10 Some of the reasons cited for not collecting nonmotorized data included limited budget, staff and resources; an institutional culture that does not consider bicyclists and pedestrians as part of traffic; and the low usage of pedestrian and bicycle facilities.11
Continuous counts capture temporal variation in pedestrian activity, whereas short-duration counts do not. However, since continuous counts require more resources, agencies often use short-duration counts to capture spatial variation. Both types of counts are needed to understand pedestrian travel. While continuous counts are preferred, they are not feasible at all locations because of the higher cost associated with counter procurement and maintenance. Therefore, agencies can institute continuous counts, short-duration counts or a mixture of both. Using factors derived from continuous count stations, short-duration counts are adjusted to derive performance metrics such as annual average daily bicyclists.
A 2003 TRB report by Cottrell et al. provided a pedestrian data framework that could be used to establish a pedestrian data counting program.12 Chapter 4 of the 2013 TMG built upon reports such as these to outline the steps needed to establish both continuous as well as short-duration data programs. For continuous counts, the steps are as follows:
Elements of short-duration data program are as follows:
There is research on the optimal length of short-duration bicycle counts, but the project team is not aware of any studies on the length of pedestrian counts. According to the literature on bicycle counting, purpose and available resources often dictate the length of short-duration counts, which are often collected manually.14 Many agencies conduct two-hour counts, however that is changing based on recent findings. The NBPDP suggests taking a series of two-hour counts over up to three consecutive days or weeks at locations with higher activity levels, and over up to two consecutive days or weeks at locations with lower activity levels15. The TMG states that while two-hour data is better than no data, the error rates obtained when factoring two-hour counts may be high, and recommends using 12-hour counts to create a time of day profile.16 Nordback et al. showed that counting for one full week would minimize error for AADB estimation, and Hankey et al. also recommended week-long counts.17,18 El Elsawey found that counting for one month significantly improved estimation activity.19
Deciding when to conduct counts is another important element in the process of designing a nonmotorized travel counting program. Short-duration counts are typically performed during months that represent average use, which can be identified by studying continuous count data.20 NBPDP recommends taking counts in mid-May and mid-September. Nordback et al. recommend counting in May-October in climates with winter weather to minimize the effects of seasonal variability,21 and Hankey et al. recommend counting during April-October for the same reason.22 El Elsawey found that counting during the summer months produced the lowest estimation error.23 Pertinent research on the length of counting is presented in the table in the Appendix.
Choice of count site locations for continuous and short-duration counts is an important element of the counting program. Site selection criteria often dictate where counts should be collected but they are often not concrete. The TMG provides guidance on continuous site selection.
According to the TMG, site selection for continuous counts is often dictated by criteria such as the degree to which locations are important to system users, and the need to differentiate bicyclists from pedestrians.24 Jackson et al. provide the following objectives for continuous counter site selection based on research conducted for North Carolina DOT:
They also provide a list of site selection steps based on the objectives above.
Research and guidance suggests that transportation agencies are less systemic about selecting sites for short-duration counts than for continuous ones. According to the TMG, the current practice for site selection of short-duration counts is based on practitioner interest and locations with high activity levels.27 Jackson et al. suggest that short-duration count site selection is a byproduct of the continuous site selection process, as sites that are deemed not suitable for continuous counter placement can be used for short-duration counts.28 However, locations chosen in such a manner may be biased and not statistically representative.
According to NBPDP, locations for short-duration counts should be selected with the following criteria in mind.29
NCHRP 797 outlines four approaches for selecting count locations: random, representative, targeted and control.30 In random sampling, sites are chosen randomly, with no consideration of appropriateness of the location for technologies. The risk with simple random sampling is that it may result in sites with high variability, which could lead to high margins of error when estimating volumes. Representative locations are chosen based on available resources as well as spatial coverage. NCHRP 797 suggests the following criteria for representative locations:
Targeted locations are chosen based on association with a particular project, facility type or other specific characteristics. Examples of such locations are sites with high number of crashes, locations where certain projects have been implemented, and pinch points. Control locations are those that have been unaltered and are typically chosen for comparison with targeted locations.
While there are a number of established technologies to count motor vehicles, technologies to count nonmotorized travel are continuously evolving. Many of these technologies have been previously used to count motor vehicles and are being adapted to count bicyclists and pedestrians. Nonmotorized counts, especially counts of pedestrians, are often challenging to conduct because pedestrians are not confined to a particular path or direction and often travel in groups, which makes it hard for a device to distinguish the actual number of travelers. Occlusion, which occurs when two or more people cross the path of the counter simultaneously and the counter only records the person closest to the sensor,32 is a common risk for pedestrian counting technologies.
A limited number of technologies are available for counting pedestrians, including the following:
The choice of technology for counting pedestrians often depends on the purpose, duration of counting (short term vs. continuous), location (sidewalk, path, crosswalk etc.) and available resources (cost, personnel etc.). TMG states that the choice of the equipment often rests on two questions: What is being counted and for how long?
The most commonly used technologies are manual counts in-field, manual counts via video or passive and active infrared sensors in combination with other equipment. A table containing pertinent references along with key takeaways for each of the available technologies for counting pedestrians is presented in the Appendix, and more information on technologies for counting pedestrians can be found in NCHRP 79733. Below we summarize the key advantages and disadvantages of each counting technology:
Data must be managed so that it can be analyzed and shared. Managing count data requires a repository to store the data and quality checks on the data to ensure validity. Various options are available to manage count data, including spreadsheets, databases, general data management software, vendor supplied software, and cloud-based systems. Many agencies already use databases to manage their motorized counts. Integrating nonmotorized counts into a motorized database can enable agencies to make use of an existing framework and to consolidate all counts into a single database. The 2013 TMG defines a standard data format, which includes critical and optional fields for nonmotorized data, with the intent that data collected in this format could be compared and contrasted with others and submitted to the FHWA Travel Monitoring Analysis System and National Travel Database.
QA/QC procedures on nonmotorized data are still evolving and have not been standardized yet. The TMG provides an overview of the quality control checks that are used on motorized data in FHWA’s Travel Monitoring Analysis System (TMAS) and outlines four types of possible errors: Fatal, Critical, Caution and Warning58. Fatal errors occur when the data is in the wrong format, Critical errors occur when critical columns are missing data, Caution flags are used when records are missing optional data or unexpected data are encountered, and Warning flags are used when duplicate records are submitted.
Tuner and Lasley define three types of error checks: Quality Control Checks, Validity Checks, and Business Rules59. NCHRP 797 lists several possible error sources with automated technology and recommends proper validation of the data from the counters and calibration of the counters themselves to reduce erroneous data. NCHRP 797 recommends both cleaning as well as correcting count data before it is used. Cleaning refers to the clearing the database of unusual or incorrect data, whereas correcting count data refers to the development of factors to account for systematic undercounting or overcounting based on the technology and site characteristics.60
The NBPDP was the first effort to create a national repository for nonmotorized data. Since its inception in 2005, the NBPDP has provided guidance on how to conduct manual short-duration counts, and has accepted and stored nonmotorized data submitted via email. The biggest drawbacks of the NBPDP are that there is no standardized process for storing and archiving data, quality checks are not performed on the accepted data, and the system does not allow electronic access to the data. This means that NBPDP data are not very useful to researchers and other potential users. The TMG formats and associated methods to quality control and store the data through TMAS will provide standardized processes and better data availability.
Los Angeles County created its own online clearinghouse for bicycle count data, but this database does not include pedestrian data, nor can it accommodate continuous counts.61 Other transportation agencies, including the Delaware Valley Regional Planning Commission62 and Arlington County, Virginia,63 also make their data available online. Portland State University’s Bike-Ped Portal is the first national effort to create an online archive that is capable of accepting and storing nonmotorized data from a variety of sources while providing easy electronic access to the data and the ability to export the data in different format.64 This archive is currently in development and is expected to be online in 2016.
A nationally advertised webinar titled “Pedestrians Count! How to Measure Foot Traffic” was conducted by the Institute for Bicycle and Pedestrian Innovation (IBPI) housed at Portland State University (PSU) to support the development of this report by eliciting voluntarily contributed insights on pedestrian travel counting practices from practitioners across the country. The 90-minute webinar was conducted on August 27th, 2015 In addition to the moderator, a panel of five speakers presented material on pedestrian travel counting techniques. Topics included pedestrian count counting, technologies and sites, count duration and factoring, data management, and counting programs. A portal to gather voluntary feedback from participants was set up in Google Sheets, an online collaborative spreadsheet platform. The link to the Google Sheet was emailed to the registrants prior to the webinar and was also shared often throughout the webinar. Figure 2‑1 shows a screenshot of the sharing document.
Figure 2‑1. Webinar Sharing Document

Over 300 people attended, with 25 percent reporting that they had multiple people viewing the webinar at their site. Participants represented a broad cross-section of practitioners, from planners and engineers to researchers and citizen advocates. 67% of attendees indicated that they were unfamiliar with the TMG.
Throughout the webinar, we posed five questions to the participants and received a total of 76 responses across all five questions. We summarized responses to each of questions below.
We asked the attendees, “What problems have you encountered in trying to count pedestrians?” Attendees’ responses are summarized below. A total of 14 responses were received for this question.
Cost was identified as a common and significant barrier to counting by participants. Other challenges that were identified by the webinar participants include technology limitations and identifying a reliable technology to perform continuous counts. Another well-known challenge identified by the webinar participants is that pedestrians do not follow well defined routes, thus making it very hard to count them accurately.
The second question we posed to the attendees was, “Tell us about your pedestrian counting practices, including technologies and locations.” A total of 31 responses were received and are summarized below.
Many respondents reported using infrared sensors to count pedestrians at sidewalks and along paths, and automated video and manual counts were also popular. With respect to locations, webinar attendees reported counting along sidewalks, crosswalks, shared use paths and greenways. Some respondents also reported on the types of counts conducted, for example segment versus intersection turning movement counts.
Next, we asked attendees to “Describe your short-duration and continuous pedestrian count programs.” 12 responses were received for this question. The responses are summarized below.
For the short-duration counts, the responses ranged from not having a defined pedestrian counting strategy to counting for one week. Some jurisdictions reported having continuous counts. Some jurisdictions also reported counting pedestrians only during intersection turning movement counts.
We asked participants to “Tell us about your pedestrian count data management. How do you manage and share your data?” The 12 responses received from the attendees are summarized below.
The webinar attendees reported using a variety of methods for storing count data, including a national archive, central traffic management system, custom software, access database and individual project files. Data sharing was also prevalent among the attendees, who reported sharing data with local and regional partners.
Finally, we asked attendees, “What recommendations would you provide give others that are just starting a pedestrian counting traffic program?” The 8 responses received are summarized below.
Some attendees recommended justifying the purpose of the data collection by linking it to performance measures. Other recommendations include researching available technologies and locations, developing a strategic plan for data collection, documenting the process and communicating with stakeholders.
The webinar responses provided useful insights into the range of pedestrian counting techniques deployed by various agencies around the country. Many agencies reported significant challenges with counting pedestrians including cost, equipment, resources and lack of defined paths on which to count. In spite of these challenges, many agencies were still conducting counts. Commonly-used technologies included manual methods, infrared devices, and automated video processing technology, and attendees reported conducting counts along sidewalks, paths, crosswalks, trails, corners and neighborhood greenways. Agencies also reported performing both short-duration and continuous counts, with the short-duration counts ranging anywhere from peak periods to one week. There did not appear to be a standard approach to data storage, with agencies storing data either locally or using a data archive. They also reported sharing data with local and regional partners. Attendees had a number of recommendations for others who were just starting a pedestrian counting program. The recommendations included researching available technologies, methods and locations, developing a strategic plan, tying it back to performance measures, and communicating with stakeholders.
Interviews With Practitioners
In addition to holding a webinar the webinar, the research team also conducted telephone interviews to elicit best practice information from a small group of experts across the country. The research team drew the interviewees from various groups likely to be involved and knowledgeable with pedestrian travel counting practices, including academics, vendors, bicycle and pedestrian coordinators, and travel monitoring staff. Figure 2‑1 shows the interviewee list.
| Category | Respondent | Organization |
|---|---|---|
| Academics | Dr. Robert Schneider | University of Wisconsin, Milwaukee |
| Dr. Greg Lindsey | University of Minnesota | |
| Dr. Luis Miranda-Moreno | McGill University | |
| State Traffic Monitoring Staff | Steve Abeyta | Colorado Department of Transportation |
| State Bike-Ped Coordinator | Kenneth Brubaker | Colorado Department of Transportation |
| State Bike-Ped Planning | Lisa Austin | Minnesota Department of Transportation |
| City Bike-Ped Coordinator | David Patton | Arlington County, Virginia |
| Vendor | Jean-Francois Rheault | Eco-Counter |
| Stanislav Parfenov | Placemeter | |
| Practitioner | Michael Jones | Alta Planning and Design |
| Practitioner | Michael Jones | Alta Planning and Design |
| Business Alliance | Aylene McCallum | Downtown Denver Partnership |
| Non-Profit | Dr. Tracy Hadden Loh | Rails-to-Trails Conservancy |
We conducted interviews between August and October of 2015 via telephone. We asked each interviewee various questions pertaining to their experience with pedestrian counting programs, technologies, site selection, count data management and specific recommendations for the TMG. To comply with Office of Management and Budget (OMB) regulations, each question was asked of no more than 9 interviewees. Below we summarize interviewees’ responses by category. Complete notes from each interview are in the Appendix.
According to respondents, most agencies that establish nonmotorized traffic counting programs are primarily focused on counting bicycles, not pedestrians. Though pedestrians account for a larger portion of travelers than cyclists, establishing an effective pedestrian count program is a complex task, and there is less supporting research and guidance available. Many respondents stated that their pedestrian counting programs were in the nascent stage.
Minnesota Department of Transportation (MnDOT) started its program in 2010-2011 in collaboration with the University of Minnesota. Initially, MnDOT collected short-duration manual counts, but it is working to accommodate continuous counts. Colorado Department of Transportation (CDOT) has been deploying counters that collect both pedestrian and bicycle counts, mostly along trails, since 2010. Arlington County, Virginia collects uses collects data from both manual counts conducted by volunteers and automated counters.
Respondents described a number of challenges in counting pedestrians. Many reported errors due to occlusion, especially when counting at high volume locations. Interviewees also mentioned difficulty in identifying sites and technologies since pedestrians also do not follow a definite path or route and exhibit more free range of movement than cyclists. Though manual counts are commonly used, interviewees said that they are expensive and are not feasible at every location. At the same time, interviewees reported that existing technologies typically have high error rates. There is also lack of understanding on pedestrian travel patterns.
Though many interviewees reported conducting manual counts, several reported using emerging automated count technologies, either to collect continuous counts or conduct short-duration counts over a longer time period. Most respondents reported using infrared counters to count bicycles and pedestrians together, or deploying infrared counters in conjunction with bicycle-specific counters such as pneumatic tubes or loops to differentiate cyclists from pedestrians. Interviewees reported more limited use of automated video processing, and mentioned several emerging technologies with potential for more widespread deployment, such as thermal cameras, portable mats, ultrasonic devices, LIDAR, and using wireless detection to assess travel patterns, speeds and origin-destination information for pedestrians. One respondent stated that no single technology would be able to tell the entire story, so it is necessary to combine data from different sources to understand pedestrian travel.
Most respondents stated that site selection often depends on the purpose of the data collection. According to one interviewee, if an agency is installing counters for the first time, it is more beneficial to install the first counters at locations with high activity levels to build political support for the counting program. Once the support has been established, the agency can add low volume locations also to get network coverage. Stakeholder recommendation was also deemed an important factor in site selection. Other considerations for site selection mentioned by interviewees include cost and power for the equipment. Respondents also stated that it was difficult to justify picking sites randomly given these other considerations.
We also asked respondents if they counted at non-traditional locations such as overpasses and underpasses, elevators, escalators and stairways. Some respondents stated that they did count at these locations, but typically they were project-specific temporary counts to demonstrate facility usage, justify the need for improvements, or assess disabled access. One interviewee reported encountering vandalism of an automated counter used for a short-duration count in a stairway. Counting at these non-traditional locations is important, otherwise it would be impossible to know how many people are using these facilities. In France, counts on elevators, escalators and stairways were undertaken by French railway as part of a large project. One interviewee also noted the need to count pedestrians on shoulders of rural roads.
While motorized counting programs are well established, nonmotorized programs are still evolving, and agencies are still trying to determine how best to manage their count data. Many interviewees reported using vendor-developed cloud-based software to manage their count data. CDOT has adopted new travel monitoring software that is capable of storing nonmotorized data as well. A few respondents stated that their choice of a particular technology for counting was based on the availability of an integrated data management system by the equipment vendor. Many respondents stressed that it was important to archive the raw data as well. For devices that do not have vendor supported software, respondents reported creating their own scripts to format data.
Many respondents unequivocally stressed the need for quality checks in order to ensure good quality data. The respondents also stated the importance of calibrating the equipment and validating the data. One respondent reported using four-hour manual counts to check each automated counter. Respondents reported performing quality checks on count data either manually or via software. Typical quality checks included visual inspection of the data to identify equipment malfunction, identifying large periods with zero counts, large data gaps, checking count values against historical averages to identify outliers and verifying directional split (if counting both directions). Respondents reported the need for setting different tolerances based on volumes at the site. Volume is an important consideration because below a certain threshold, quality checks may become irrelevant. Therefore, lower tolerances are needed at higher volume locations.
Data sharing practices differed based on agency. While some interviewees reported sharing data with local partners or made data publicly available through a website, other interviewees said that their agencies lacked the data to share resources. However, most respondents agreed on the need to share data.
Some respondents reported challenges in procuring equipment due to agency regulations requiring bids from multiple vendors, which were not always available because of the limited number of technologies available. These interviewees worked with their agency’s procurement office to list a preferred vendor as a sole source provider of the equipment, which allowed partner agencies to purchase additional equipment easily without going through the bidding process. Respondents recommended involving having personnel who understand counting equipment involved in the procurement process, and emphasized the need to test the equipment prior to procurement to understand its accuracy and determine if it meets data collection needs.
Some interviewees recommended specific improvements to the TMG. One respondent suggested that the TMG should include several different pathways for communities to count pedestrians; for example recommending one set of counts to determine overall walking rates and another to determine exposure to collisions. Another interviewee recommended providing national factors for estimating total volumes based on short-duration counts. Other recommendations included adding procedures to count pedestrians on rural shoulders, developing additional guidance on adjustment factors for short-duration counts, site selection criteria for continuous counters, including more case studies on how pedestrian data is being used, and adding guidance on collecting survey data in the TMG.
One respondent reported difficulties with presenting data in the format recommended in the TMG. Another raised a broader question about whether the general approach to nonmotorized count programs outlined in the TMG, which mirrors approach for motorized count programs, is appropriate for pedestrian data. This interviewee suggested that given the scant resources available to conduct pedestrian counts and the inherent variability of pedestrian data, agencies should consider focusing on project level counts as opposed to counting everywhere.
Counting pedestrians is an important but challenging task. Pedestrian activity is localized and heavily influenced by land use, pedestrian movements are not constrained to a given path, there are few automated technologies that capture pedestrians well, and some of the emerging technologies have not been widely tested. Our review of the academic literature, coupled with feedback received during the webinar and interviews with experts, reveals that most agencies that collect nonmotorized count data are further along with bicycle data collection and counting than pedestrian data collection.
Table 2‑2 shows an overview of pedestrian counting programs, which was compiled using the webinar and interview responses.
Of the 17 agencies with pedestrian count programs that we identified through our interviews and webinar, most (70 percent) indicated that infrared equipment is used for counting pedestrians. All but two agencies reported collecting short-duration counts, most of which (60 percent) were collected manually. A minority of responding agencies (35 percent) reported collecting continuous pedestrian counts. Only 30 percent of the respondents mentioned counting at intersections, while a majority (60 percent) indicated that they count on trails and paths. Sidewalks and mid-block crossings were also mentioned as count locations by multiple agencies. Only a third of respondents mentioned having both short-duration and continuous pedestrian count programs.
Following is a list of recommended current practices that emerged from the research described in this section.
Our research also revealed a number of potential topics for further research:
Table 2‑2. Overview of Pedestrian Counting Programs
| Count Programs | Types of Counts | Duration | Automated Technologies | Locations |
|---|---|---|---|---|
| Minnesota DOT |
|
|
|
|
| Colorado DOT |
|
|
|
|
| Georgia DOT |
|
|
|
|
| Illinois DOT |
|
|
|
|
| North Carolina DOT |
|
|
|
|
| Virginia DOT |
|
|
|
|
| Michigan DOT |
|
|
|
|
| City of Milwaukee, WI |
|
|
|
|
| New York City DOT |
|
|
|
|
| Greensboro, NC |
|
|
|
|
| City of Bettendorf, IA |
|
|
|
|
| Columbus, OH |
|
|
|
|
| Menasha, WI |
|
|
|
|
| Morgantown, WV |
|
|
|
|
| Region of Waterloo, Canada |
|
|
|
|
| Philadelphia, PA |
|
|
|
|
| Arlington County, VA |
|
|
|
|
Counting pedestrians is a critical but challenging task. Pedestrian counts can be used to analyze safety, assess economic impacts, and monitor trends to justify the need for new facilities. There are several challenges associated with counting pedestrians. Pedestrians do not travel along defined paths, which complicates the process of deciding where and how to place counters. Pedestrians often travel in groups, which also leads to the issue of occlusion, when automated counters capture only one pedestrian among several. The limited array of available technology for counting pedestrians exclusively also adds to the challenge. Nevertheless, many agencies are investing in both short-duration and continuous pedestrian counting programs.
An important consideration in these programs is determining the appropriate technology that can be used for counting pedestrians at a variety of locations such as sidewalks, crosswalks, multi-use paths, overpasses, underpasses, and vertical transportation (elevators, escalators and ramps). Understanding how the data will be used is important when developing the counting approach. Other important factors that also need to be considered include installation and procurement of the equipment and resource allocation strategies. Calibration frequency and assessing accuracy of counting equipment are also critical. The following subsections describe and summarize findings from the team’s research on available technologies and strategies for installation, procurement and resource allocation, calibration and validation.
Technologies for counting pedestrians are continuously evolving, but in general there are fewer technologies available to count pedestrians than there are for counting bicyclists. Prominent pedestrian counting technologies include manual counts (both in-field and from video), automated video counts, passive and active infrared devices, and radio beams. Thermal cameras, laser scanners, and pressure or acoustic pads are also capable of counting pedestrians, but are used less frequently. Other technologies can capture surrogate measures of pedestrian traffic volumes measure pedestrian activity via Bluetooth65 or Wi-Fi technology,66 or traffic signals that record pedestrian pushbutton actuations.67 Both the TMG and NCHRP 797 provides an extensive review of counting technologies.68, 69 The available technologies along with their strengths and weaknesses are summarized below in Table 3‑1. More details on each technology is provided in Appendix B.
Table 3‑1 Pedestrian Counting Technologies
Technology |
Typical Applications |
Strengths |
Weaknesses |
|---|---|---|---|
Short-duration counts |
|
|
|
Short-duration counts |
|
|
|
Short-duration or continuous counts |
|
|
|
Short-duration or continuous counts |
|
|
|
Short-duration or continuous counts |
|
|
|
Radio Beam80 |
Short-duration or continuous counts |
|
|
Continuous counts |
|
|
|
Thermal Cameras83 |
Continuous counts |
|
|
Laser Scanners |
Short-duration or continuous counts |
|
|
Purchasing and procuring equipment is a critical step in establishing counting programs. Once an agency has identified the appropriate automated equipment for its counting program, it is important to choose the right vendor. NCHRP 797 lists a number of issues that an agency must consider during the procurement process:84
Information about procurement strategies was also provided by some interviewees during the interview process, as described in Chapter 2. Some respondents reported difficulties early in the procurement process due to agency rules and regulations requiring bids from multiple vendors, which were not always available for emerging technologies. These interviewees reported working closely with the procurement office to list a preferred vendor as a sole-source provider of the equipment and include them in in the vendor-approved list. That designation allowed other agencies in the region/state to purchase additional equipment easily without going through the bidding process. Respondents recommended involving personnel in the procurement process who understood the equipment and the process of counting pedestrians, as well as testing the equipment prior to procurement to understand its accuracy and determine if the equipment meets an agency’s data collection needs and purpose.
Installation of the equipment is an important but challenging part of the data collection process. NCHRP 797 provides a checklist that can be followed by agencies before, during and after the installation process.85
Before Installation:
During Installation:
After Installation:
Periodically following installation:
Once automated counting equipment has been installed, data should be validated by comparison to manual count data (manual count from the video is best). NCHRP 797 recommends two sets of validation, one directly after the equipment has been installed, and the other a few days after installation.86 Both validation procedures involve comparing the equipment counts to manual counts to detect problems with accuracy and abnormalities in the data. Depending on the outcome of the validation process, the equipment may need to be calibrated, which involves adjusting the parameters on the device so that it can count accurately. NCHRP 797 recommends consulting vendors to enquire about installation and calibration support including providing ongoing calibration support. Counting equipment should be regularly tested to determine if the equipment is producing accurate counts. NCHRP 797 recommends testing for accuracy at least once per year and recalibrating the equipment if the accuracy is not adequate.87 Validation and calibration should be performed whenever changes in the equipment occur.
Establishing a counting program requires a considerable amount of resources. Both the TMG and NCHRP 797 provide extensive information on each particular technology and the resources required to procure, install and maintain the devices. Following is a list of costs that an agency must budget for:88
This subsection recommends procedures for pedestrian traffic counting related to the type of facility monitored, including sidewalks and pedestrian-only trails, crosswalks, shared use paths, vertical transportation (stairways, escalators, elevators, etc.), overpasses and underpasses, and plazas. Each facility type poses unique challenges that warrant consideration. We define the six facility types as follows:
These facility types are primarily associated with segment or screenline counts, with the exception of pedestrian counts at crosswalks, which are often included in intersection counts, especially turning movement counts. In this document we use the term “segment” as an adjective to describe counts on a road or path segment between intersections instead of the term “screenline” used in TMG Chapter 4. This is to avoid confusion with the alternative definition of “screenline” commonly applied to cordon counts around a city or region.
Below we discuss findings from the (often limited) academic literature, webinars, and interviews related to procedures for counting pedestrians at the facility types listed above.
Sidewalk counting is challenging because, as noted in the TMG, “Pedestrians take shortcuts off the sidewalk or cross streets at unmarked crossing locations.”95 Another complication noted in the TMG is that even though sidewalks are intended specifically for pedestrian use, bicyclists, skateboarders and others often use sidewalks. Current guidance from the TMG states that “… sidewalks or walkways can be instrumented with a single-purpose infrared counter if bicyclists are not typically present.”96
Based on interviews and webinar feedback, the study team determined that state DOTs in Minnesota, Colorado, and North Carolina and city DOTs in New York City and Greensboro, NC are counting pedestrians on sidewalks. Agencies indicated that they use manual and automated counting equipment, primarily passive infrared but also radio-beam, on sidewalks. Greensboro, NC mentioned difficulties finding poles from which to mount infrared counting equipment. New York City mentioned difficulties using manual counts on high-volume sidewalks with 6,000 to 7,000 pedestrians per hour, such as those near Times Square.
Pedestrian-only trails, such as those common in parks, are often counted using passive infrared due to relatively low cost and ease of installation. Pressure pads and acoustic mats are also used in some unpaved trails, since they can be buried, preventing vandalism.
The TMG includes crosswalks as one of the count location types, but provides no specifics on how such counts should be conducted other than a brief mention of pedestrian detection in crosswalks using infrared detection and pressure sensors at curbside pedestrian waiting areas, noting that this is more common in western Europe97.
Webinar participants talked about counting at crosswalks as part of intersection turning movement counts, which are usually conducted manually in the field or via video. Webinar participants from New York City reported counting pedestrians in crosswalks manually, but staff manual counters had trouble capturing all pedestrians at high-volume crossings with 5,000-plus pedestrians per hour. Georgia DOT mentioned that they were working on a research project to create an “automated mid-block pedestrian counter” to reduce the staff time needed to conduct counts for crossing warrants, but the project would result in only one unit being available for the whole state. Migma Systems reported in the webinar that they have a product capable of counting pedestrians at crosswalks using a combination of stereo camera and scanning laser which can differentiate pedestrians in groups.
Interviewees mentioned that pedestrian research in the San Francisco Bay Area has found that there are some differences in hourly travel patterns between sidewalks and crosswalks even if they are immediately adjacent to one another, so it is best to count on the facility of interest.98 However, most automated equipment is not applicable at crosswalks. For example, the commonly used passive infrared counters cannot be used at most crosswalks because they also record passing motor vehicles. This makes sidewalk counts a logical surrogate for crosswalk counts.
Video image recognition and manual counts are usually only used for short-duration crosswalk counts because of the high cost per hour. If video is used and either counted manually or by video image processing, it is helpful to mount the camera high enough to be able to look down on pedestrians and avoid occlusion. For example, one video-image-recognition vendor recommends 30 to 90 degree angle from horizontal and minimum height of eight feet.99
Kothuri used pedestrian pushbutton data as a surrogate for pedestrian crossings100. While this surrogate measure does not capture pedestrian traffic volumes, it does indicate crossings with high and low pedestrian activity.
In summary, crosswalks pose unique challenges to pedestrian traffic counting. Because they cross perpendicular to motor vehicle traffic, detection is more challenging, and pedestrians often do not cross exactly in path of the crosswalk. Currently, manual in-field counts, manual counts from video, and automated video counts are commonly used at crosswalks. Technologies that are available but less common include stereo camera with laser scanner. Follow-up with GDOT on their research project to develop a new technique is warranted.
Webinar participants involved in pedestrian counting mentioned using infrared counters to count pedestrians on paths, trails and greenways. Participants reported using passive infrared counters alone to count all warm bodies on a path, which includes bicycles, skateboarders, and others in addition to pedestrians. However, it is important to differentiate pedestrians from other path users since they often have different travel patterns and volumes. Other participants mentioned using passive infrared counters in combination with inductive loops or pneumatic tubes to separate bicyclist counts from pedestrian counts. Where tubes are used, small diameter pneumatic tubes are best to reduce trip hazards and improve count accuracy.101
For unpaved shared use paths, such as rural rail-trails, pressure pads can also be used to distinguish pedestrians from bicycles during counts.
Two interviewees described specific cases in which pedestrians were counted on vertical transportation facilities. Rails-to-Trails Conservancy reported collecting short-duration pedestrian counts on a stairway using an automated infrared counter. They mentioned that vandalism was an issue and emphasized the importance of hiding the equipment and checking on it regularly. One of the vendors interviewed described installing pedestrian counting equipment on elevators, escalators and stairways as part of a large project for the French railway system.
MNDOT indicated in an interview that they were counting on overpasses. Dr. Greg Lindsey specifically mentioned that pedestrian counts in downtown pedestrian overpasses, known as “skyways,” to demonstrate the use of these facilities to decision-makers.102 Rails-to-Trails Conservancy also reported experience counting at underpasses and overpasses on far-from-road shared use paths, but did not share any specific concerns about such locations.
Plazas are areas where pedestrians may choose to congregate or pass through. Each pedestrian may choose a unique route through the plaza. The TMG describes counts in such environments as “general activity counts.” Some manual count methodologies track pedestrian travel through a plaza, while others count pedestrians at points of entrance. Bluetooth and Wi-Fi detection have been used to monitor pedestrian activity on plazas such as the National Mall, but cannot provide total counts since not all people carry Bluetooth or Wi-Fi enabled devices103.
Interviewees and webinar participants also mentioned conducting counts at other locations not listed above:
When counting pedestrians, it is critical to choose the right technology for the count purpose, setting, and duration. Once the appropriate technology has been chosen, proper installation, calibration and validation (for automated equipment) are essential to ensuring good quality counts.
Agencies also need to assess how best to strategically allocate limited resources when managing counting programs. In general, it is best to monitor pedestrian traffic at constrained points in order to reduce error from occlusion (one pedestrian hiding another, for example) and in pedestrian-only environments, to minimize the counting task. Surrogate measures of pedestrian counts such as Bluetooth and Wi-Fi counting and pedestrian push button actuation logs may provide useful supplements to pedestrian count data, to help improve estimates of pedestrian volumes where counts are not collected.
Since technologies are continuously evolving, future innovation and development may bring new or improved technologies to the field of pedestrian counting that my improve data collection and improve pedestrian traffic counting. Continuing to watch and study these developments will be helpful for the future of pedestrian traffic counting.
Specific recommendations for automated counting of the facility types are listed below in Table 3 2. Note that manual counts (both in-field and from video) can be used at all facilities, but we only discuss specifics of manual counting are only included in regard to crosswalks, non-crosswalk road crossings, and shoulder counts.
Table 3‑2. Recommendations for Counting Pedestrians by Facility Type
| Facility | Intersection / Segment? | Automated Technologies Used | Specific Recommendations |
|---|---|---|---|
| Sidewalks (and pedestrian-only trails) | Segment | Passive infrared, active infrared, automated counts from video | Point infrared emitters toward a wall or another non-reflective, non-moving surface, and do not install infrared receivers in direct sunlight. Video is best collected from above to prevent occlusion. |
| Crosswalks | Intersection | Automated counts from video, pedestrian push button actuation | Video is best collected from above, if possible, to prevent occlusion. |
| Shared use paths | Both | Passive or active infrared in combination with inductive loops or pneumatic tubes to distinguish cyclists; pressure pads (if unpaved) | If tubes used, small diameter are best, to reduce trip hazard and increase accuracy. |
| Vertical transportation | Segment | Passive infrared, active infrared, pressure pads, thermal cameras | Install equipment in a secure location to prevent vandalism. |
| Overpasses and Underpasses | Segment | Passive or active infrared, alone or in combination with inductive loops or pneumatic tubes to distinguish cyclists | It can be difficult to place equipment on bridge decks; an alternative is to place it at approaches. |
| Plazas | General activity | Wi-Fi/Bluetooth detectors | Manual counts can be used to track paths through plazas or conducted at points of entrance. |
| Road shoulder* | Segment | None | Further research is needed |
| Pedestrians crossing not at crosswalks* | Segment | Infrared motion-activated cameras | Further research is needed. |
* Manual counts from video are probably the most viable option for these facilities because the ability to fast forward makes to process of counting infrequent events more efficient. Infrared motion-activated cameras like those used to monitor wildlife crossings can also be used.
As described previously in this report, the emphasis on and quantity of pedestrian volume data has increased significantly in recent years. Counting efforts should be part of a broader program to monitor pedestrian traffic. Understanding the ultimate goal of how count data will be used is important when developing the travel monitoring program.
Much as with other elements of pedestrian counting programs, including count technologies and installations, the state of the practice regarding the duration and frequency of counts has been rapidly evolving. This temporal aspect of pedestrian counting has a significant impact on resource allocation and, even more importantly, the quality of the resulting data. This chapter discusses the distinction between continuous and short-duration counts and the concepts of temporal variation and factor pattern groups. The state of the practice is described, including potential topics about which additional research would be beneficial.
In terms of the temporal period during which they are conducted, pedestrian volume counts have historically been classified as either continuous or short-duration. Continuous counts are conducted via automated devices for a period of 24 hours each day over all days within a reporting year. Short-duration counts are those conducted less than an entire year, frequently for several hours within a day or for multiple days, but also for as long as several weeks. Continuous counts are therefore generally thought of as providing temporal data because they include the full spectrum of potential analysis time periods. Providing such counts across a network of facilities is impractical, however, so short-duration counts provide companion spatial data because they are able to be conducted over a broader area. While many short-duration counts are conducted purely to provide this geographic coverage, others are done for project-specific reasons (e.g., facility sizing needs, before and after studies).
For many reporting and tracking reasons, transportation agencies are often interested in the amount of pedestrian travel that occurs over the period of a year, sometimes referred to as Annual Average Daily Pedestrian (AADP) traffic. By their nature, continuous counts do not have an associated count duration and, aside from any missing data periods due to equipment failure or other unexpected issues that affect data quality, and therefore do not require any factoring to determine annual pedestrian volumes. Short-duration counts, however, represent a snapshot in time that may not be reflective of typical pedestrian activity levels, and therefore need to be factored in order to provide a reasonable estimate of annual volumes. We discuss concepts of temporal variation in the next section.
To better reflect true AADP, short term counts must be adjusted to account for typical variations that occur throughout the day and year. Hour of day, day of week, and month of year are typical periods for which adjustment factors are created.
Just as with motor vehicle traffic, pedestrian traffic varies greatly throughout the day. Peak volumes often occur in mornings and late afternoons. Lunchtime peaks are also common. Consequently, to accurately translate hourly counts to daily volumes, representative hour of day patterns must be established then applied to hourly counts.
Similarly, pedestrian travel patterns vary greatly between weekends and weekdays. To estimate AADP, longer counts (one week or more) are needed to identify the variances among various days of the week so that they can be applied to calculated daily volumes. Day-of-week adjustment factors are calculated as the AADP divided by the average traffic occurring on a particular day of week throughout the year. This is frequently approximated by dividing the average daily pedestrian traffic for one week of counts by the relevant daily count for a given day of week. However, as weekly patterns can change dramatically with the seasons, this approach can yield inaccurate AADP if applied to a daily count that was conducted during a month or season outside of the period used to create the adjustment factor. For pedestrian volumes, seasonal day-of-week factors are preferable to a single a day-of-week factor.
Monthly (seasonal) variations must also be accounted for when translating short term counts into AADPs. This is particularly important in places where temperature and precipitation levels vary between seasons. Continuous count stations or a sufficient amount of weekly counts to compare volumes across months are essential for determining monthly variation throughout the year. Monthly adjustment factors are calculated as the AADP divided by average pedestrian traffic over a particular month.
Temporal adjustment factors are created (ideally) from continuous counts. The first step is to translate the hourly (or multi-hourly) counts into daily volumes. This is done by dividing the counted volume by the percentage of the daily pedestrian volume typically occurring in the counted period. The AADP can then be calculated using the equation
AADP = PedV * DOW * MOY
Where
PedV = Daily pedestrian volume for day counted
DOW = Day-of-week adjustment factor
MOY = Month-of-year adjustment factor
Factor groups are groups of continuous count stations with similar traffic patterns used to compute the temporal adjustment factors, defined above, which can be applied to short-duration counts to estimate AADP. Each factor group within a counting program has an associated set of temporal adjustment factors derived from the variability observed at the sites within the group. As the number of factor groups and the number of continuous count stations used to estimate factors both increase, it becomes possible to specify a more precise factor group for a given short-duration count, and the accuracy of count extrapolation improves. For motor vehicles, factor groups are frequently based on roadway functional classification and area type. Similar characteristics can also be used in developing pedestrian factor groups, but facility type (e.g., roadway versus shared use path) and predominant user type (e.g., commuters versus recreational users) are more likely to be defining traits. The TMG formats offer storage of the associated factors used for pedestrian counts for reference and later use.
Weather is another factor that should be considered when extrapolating short term counts to AADP. There is no method routinely used to create weather factors for calculating AADP. However, there have been several research studies indicating the importance of weather on pedestrian travel behavior.106,107
Data from count stations could be correlated with variables such as temperature using readily available historic data. Factors such as rain and snow, however, are more problematic since precipitation levels are more temporally and geographically localized than temperatures. Additionally, a light afternoon sprinkle likely will not impact volumes as much as a more intense rainfall.
Manual counts are often conducted under relatively clement conditions and thus represent seasonal ideal conditions instead of average conditions. Therefore, AADP calculated from short term manual counts will over-represent the true AADP unless weather conditions are considered. Consequently, local ideal-to-average adjustment factors may be advisable, but these would likely need to be determined through special examinations of historical counts. National weather station data together with locally recorded weather should be considered part of a pedestrian counting program to account for the effects of weather. Keeping the weather data with the count as is done with the TMG nonmotorized format offers significant advantages to the long term utilization of the pedestrian count.
Occlusion adjustment factors (a type of bias compensation factor) are used to account for multiple pedestrians traveling in groups and/or side by side being under counted. Bias compensation factors for occlusion can be calculated by dividing the pedestrians counted using manual counts by the number counted by the installed equipment. These factors should be determined for each site or group for a count program.
Chapter 4 of NCHRP 797 provides detailed information on creating and applying occlusion and other bias compensation factors, including typical factors by equipment type and how to apply these factors.108 This includes how to apply non-linear bias compensation factors for passive infrared counters for which occlusion increases with increasing pedestrian volume. This chapter also mentions how equipment error (and hence equipment-related bias compensation factors) may vary by weather.
As noted in the introduction, the field of pedestrian traffic counting is relatively new; as such, the state of the practice is evolving and somewhat limited. Two primary resources that include guidance related to pedestrian count durations and factoring processes have been published since 2013, the updated TMG109 and NCHRP Report 797: Guidebook on Pedestrian and Bicycle Volume Data Collection.110 We summarize these resources, as well as recent relevant research, in this section.
The FHWA TMG 2013 Chapter 4 is a stand-alone chapter on the subject of traffic counting for nonmotorized traffic. In addition to discussion and recommendations related to nonmotorized count equipment and count locations, this chapter devotes significant attention to variations in pedestrian and bicycle travel patterns, associated impacts on appropriate duration of counts, and resulting processes by which to factor short-duration counts into accurate estimates of annual travel.
The TMG states that “There is no definitive guidance on the minimum required duration of short-duration counts”111 for nonmotorized counts. Despite this general condition, the TMG does establish recommended minimum durations depending on the technology being used. For manual counts, the TMG suggests a minimum duration of 4 to 6 hours, preferably during a time of relatively heavy nonmotorized travel, with a preferred duration of 12 hours, which permits the calculation of time-of-day profiles.112 Recognizing the resource limitations associated with manual counting, the TMG acknowledges that two-hour counts (still the prevailing practice) are better than nothing, but recommends instead conducting fewer counts for longer periods.113 When automated count equipment is being used, the TMG-suggested minimum count duration is 7 days to account for all days of the week, with a preferred duration of as long as 14 days.114
The TMG suggests that counts conducted during months of the year associated with “average or typical” activity levels, ideally as determined by data from continuous counters, may not need factoring; otherwise, a factoring process is needed to adjust short-duration counts to better represent annualized counts.115 The TMG identifies up to five factors that may need to be applied to short-duration count data to achieve an accurate annual estimate: time of day (if less than a full day of data), day of week (if less than a full week of data), month/season of year, occlusion (depending on automated equipment type), and weather.116
For motorized traffic data, the TMG identifies recommended factor groups based on area type, roadway functional class, and predominant trip purpose.117 Each factor group established within a traffic counting program consists of locations where continuous counts are conducted and has a defined set of temporal adjustment factors. Each short-duration count is assigned to the most representative factor group for best approximating temporal adjustments to the collected data. Regarding nonmotorized traffic data, the TMG acknowledges a lack of consensus on the appropriate number of continuous counts to comprise a factor group and the appropriate number and character of the factor groups themselves, as well as the fact that very few agencies are using factor groups for nonmotorized counts.118 It expresses a hope that future editions of the TMG will be able to recommend additional guidance on this topic, and such guidance is now available from NCHRP Report 797 and other recent sources.
NCHRP Report 797: Guidebook on Pedestrian and Bicycle Volume Data Collection, published in 2014, a year after the most recent edition of the TMG, includes recommendations related to count duration, count frequency, and temporal adjustment factors, much of which is based on research published shortly after the finalization of the TMG.
NCHRP 797 notes that the appropriate count duration depends significantly on the purpose of the count data; for example, an agency interested in determining hourly volume patterns does not need to collect data for as long as an agency trying to determine seasonal variation.119 As with the TMG, NCHRP 797 acknowledges that short-duration counts of at least two hours can be extrapolated to longer periods, but that doing so has the potential to introduce significant error. That error is reduced as durations increase. Citing three recent studies, NCHRP 797 suggests that counts should be taken for four to seven days, and that extrapolation errors are further reduced when counts are conducted during seasons of relatively high activity.120
NCHRP 797 acknowledges that shorter-than-recommended bicycle and pedestrian counts can still be useful for certain objectives, including the ability to track trends over time.121 If partial day counts are conducted, extrapolation accuracy can be improved by counting during several different time periods.
On the subject of count frequency, NCHRP 797 references the TMG’s motor vehicle guidance to conduct short-duration counts such that the entire system is covered over a time period no longer than six years, with more important locations having a shorter coverage period of three years. NCHRP 797 goes on to state that “Communities should choose a frequency for pedestrian and bicycle counts that allows those communities to achieve their counting purpose with the available resources.”122
As with the TMG, NCHRP 797 emphasizes the importance of developing temporal adjustment factors based on continuously monitored sites. The guidebook acknowledges that an ideal number of continuous count stations has not been identified, but cites the TMG recommendation of three to five such stations per factor group.123
One of the earliest efforts to promote nonmotorized traffic counting and to standardize its practice is the National Bicycle and Pedestrian Documentation Project (NBPDP), which began in 2004 and remains active. The project is designed to provide a consistent model of data collection by providing standardized instructions, forms, and data entry templates for use by agencies conducting counts.124 The NBPDP also provides standard count dates and times, receives all collected data, and makes the resulting findings publicly available. NBPDP count sites are generally consistent from year to year.
In a 2013 paper, Nordback et al. tested numerous short-duration count durations to determine their accuracy in estimating annual average bicycle travel.125 This was done by applying temporal adjustment factors (taken from two factor groups comprised of multiple continuous count stations) to the various short-duration counts and comparing the resulting estimates to actual annual counts. The short-duration count lengths ranged from one hour, with an associated average error rate of 54 percent, to four weeks, with an average error rate of 15 percent. Given that the average error rate associated with one-week counts (22 percent) is not notably worse than with four-week counts, the study finds that one-week counts are optimal, and recommends a minimum count duration of 24 hours (38 percent error). The researchers also recommend that short-duration counts be conducted during time periods when travel variability is relatively low and that installation of multiple continuous counters is essential in establishing meaningful factor groups. While this research is specific to bicycle counting, the similar (and frequently somewhat higher) variability between pedestrian and bicycle travel suggests that the findings and recommendations are generally applicable to pedestrian counts.
Hankey et al. recently conducted a study on nonmotorized counting practices and corroborated the above study’s recommendations on optimum duration and seasonal timing of short-duration counts to reduce error rates in estimating annual travel.126 Additionally, the researchers propose the use of specific day-of-year adjustment factors as opposed to the more traditional application of both day-of-week and month-of-year factors. This approach is shown to further reduce estimation error but has inherent limitations, including the fact that day-of-year scaling factors are can only be used for the year in which they are calculated and can only be applied after the end of the calendar year once the reference continuous count sites have concluded their annual data collection. The researchers also conclude that there are no significant differences in error rates between short-duration counts conducted on consecutive days and those conducted on non-consecutive days.
While researching the effectiveness of several approaches to estimating annual bicycle travel, including a weather-based model, Nosal et al. also explored the topic of optimum count durations.127 While results vary based on the estimation method, the researchers generally cite benefits of five days of data collection. As with Nordback et al., this research is specific to bicycle counts, but results are generally transferable to pedestrian travel counting.
The state of the practice has coalesced around the need to conduct short-duration pedestrian counts for a longer period of time than two hours, which is commonly used for manual counts. The widespread availability of portable automated counters that count pedestrians with relatively high accuracy has enabled many agencies to conduct counts for an entire day or longer, thereby eliminating the need for hour-of-day factoring and improving the accuracy of AADP estimates. In line with the findings of multiple recent studies, one week is recommended as the optimum pedestrian count duration, with a minimum duration of 24 hours.
In all likelihood, “traditional” (i.e., partial day manual) short-duration pedestrian counts will remain common because of a combination of existing practice, budget constraints, specific project needs, and the ability to collect age and sex information. In terms of factorability and potential uses, such counts are fundamentally different from the recommended short-duration counts that take place over the course of one day to several weeks. As such, the latter group can be considered “mid-length.” This concept is further discussed in the recommendations section of this chapter; additional research better distinguishing the characteristics and uses of these two count types may be beneficial.
The research indicates less consensus, or even discussion, regarding how frequently counts should be conducted at given locations. Much of this is due to the fact that the concept of a pedestrian count network is less defined than a motor vehicle count network. An agency may consider all arterial and collector roadways its motor vehicle count network, but for the pedestrian modes some of those streets may not be considered as important as shared use paths or local streets that experience heavy pedestrian travel. This situation is frequently compounded by the generally much smaller scale and budget of pedestrian counting programs, which makes it more difficult to count regularly across a larger network even if it is well defined. A synthesis of nationwide practice on the topic of establishing standardized pedestrian counting networks is a potential future research effort. Furthermore, research on short-duration count frequency to cover these networks would be appropriate. At a minimum, the TMG-recommended three- to six-year frequency for motor vehicle counts is warranted; if anything the more variable nature of pedestrian activity suggests that more frequent counts may be appropriate.
As noted in the TMG, there is relative lack of study and consensus on the subject of factor groups for pedestrian counts, both in terms of the number and character of those groups. The importance of creating factor groups is widely acknowledged, as is the need to include multiple continuous count stations within each group. The TMG currently identifies a rule of thumb of three to five nonmotorized count stations per factor group,128 and the TMG- recommended minimum of five stations per factor group for motor vehicle counts is also frequently cited as a default, but the point of diminishing returns has not been established. Locations or trip purpose (i.e., commute vs. non-commute) remain the most common distinction in creating factor groups. Additional distinctions, the efficacy of which could be the subject of future research, include subdividing non-commute routes into recreational and utilitarian, area type (urban, suburban, rural), and facility type (sidewalks, paved shoulders, shared use paths adjacent to roadways, shared use paths within their own rights-of-way). A funded FHWA research project, “Developing an Online Tool to Estimate Annual Average Daily Pedestrian and Bicycle Traffic,” is currently addressing this topic.
Though a variety of count types, durations, locations, and technologies are necessary in order to collect valid and meaningful pedestrian data, the majority of pedestrian counts are still short-duration, two-hour manual counts. The best practices listed below will help to broaden the variety of pedestrian counts conducted and enhance the quality and usefulness of the data collected:
Given that undercounting rates and resulting bias compensation factors are typically higher for pedestrian counts than with other modes, funding is needed for research that documents the error rates associated with various equipment types or develops broadly applicable bias compensation factors by equipment type, although some of these are documented in Chapter 4 of NCHRP 797.
Managing data collected for pedestrians is critical to ensuring data availability, access, and proper usage. This section discusses four aspects of data management:
Each of the following four subsections addresses one of these aspects, reviewing relevant resources, and summarizing findings. Two additional subsections provide detailed examples of count pedestrian data formats from:
The level of quality of any dataset will limit the uses of that data. For example, data on pedestrian volume that is only accurate within an order of magnitude may be useful for planning and design purposes, but not for detailed safety analysis. For this reason, it is essential that the users understand the quality of pedestrian data. Though there is no exact guidance on the level of data quality needed for different applications, Table 5‑1 shows guidelines for the recommended level of quality for different uses.
Table 5‑1. Sufficient Data Quality by Purpose
| Data Use | Sufficient Data Quality |
|---|---|
| Sketch planning, proposals | Low (within an order of magnitude) |
| Facility design, economic impact assessment | Medium |
| Safety analysis | High |
This subsection reviews guidance and best practices in assessing, measuring, evaluating, and reporting data quality for pedestrian counting. The sources reviewed cover a variety of issues related to data quality and occasionally use varying terms when discussing these issues. We consider quality assurance and control to include:
The Federal Highway Administration’s Traffic Monitoring Guide (TMG) provides a comprehensive and standard set of procedures for collecting and reporting traffic data. Though the TMG is focused on motor vehicle data, much of its guidance is also applicable to pedestrian data. According to the 2013 TMG there are eight dimensions of traffic data quality: accuracy, completeness (both temporal and spatial), validity, timeliness, coverage, accessibility, how the data are used, and format.129
The TMG recommends that transportation agencies establish their own quality assurance process for automatically collected data, and provides the following guidance:
Equipment calibration and validation is the most labor-intensive component of any quality assurance and control program, because it occurs on an ongoing basis. This is particularly true for pedestrian data; the TMG notes that since portable pedestrian counting equipment is not as accurate as motor vehicle counting equipment it is not generally used for validation, and recommends using manual counts from video for validating pedestrian data.131 The TMG states that “on-site and in-office calibration and tracking of site information should occur regularly (daily, monthly, and annually as needed)”132 and outlines the elements of a robust traffic monitoring calibration program; the elements that are relevant to pedestrian data include:
The TMG also includes case studies of motor vehicle data quality assurance and control programs from Virginia, Vermont, Pennsylvania, Washington State, and New York State that illustrate best practices. For example, Vermont includes monthly manual inspection of graphs of traffic over a 24 hour period from each day of the week for a given month to identify problems. Automated checks identify monthly volumes that are 10 percent different from the previous year.134
Appendix J of the TMG includes details of the Quality Control Checks for motor vehicle data used in the Travel Monitoring Analysis System (TMAS) 2.0 to identify potentially faulty data. There are four types of data flags: Fatal Errors, Critical Errors, Caution Flags and Warning Flags, which are defined as follows:
The National Highway Institute (NHI)135 offers a class on traffic monitoring programs that highlights seven data quality principles:
The NHI lists elements of a successful motorized and nonmotorized data quality program which include established procedures, installation protocols, annual equipment checks, equipment validation by comparison with manual counts, and automated flagging of errors in the data.137
The NHI course also classifies the many different elements of data quality assurance and control program, scope, and plan into four categories: data collection, data processing, implementation plan, and documentation.
Data collection involves equipment purchase, installation and maintenance, staff training on how to use the equipment, and verification that equipment is working properly from bench testing before equipment is deployed to daily quality checks in the office.
Data processing includes identifying obvious errors, from equipment malfunctions to data problems such as data sets with an unusual number of zero records, data that repeat previous data (which may indicate a time stamp error) or data that are inconsistent with historic counts at that location. Data processing can also include automated validation processes that identify missing data by hour, day and month or compare counts to historical counts at that location to counts at surrounding locations and to counts within the state and surrounding states. Another aspect of data processing is the creation of temporal adjustment factors from seasonal adjustment factors to annual growth trends (see Chapter 4 for a further discussion of adjustment factors), including hour-of-day, day-of-week, month-of-year, and year-by-year trends.
These data collection and processing tasks can be coordinated through an implementation plan that includes identifying resources, providing training for staff, defining who is responsible for what, and monitoring program progress. The last aspect of data quality discussed in the NHI class is documentation, which includes the flow of information on data quality within the agency and between agencies in order to meet data integrity goals. This can include communication between data collectors, data processors, and data users.138
In a recent research paper, Shawn Turner and Philip Lasley of the Texas A&M Texas Transportation Institute examine data quality for pedestrian and bicycle count data. 139
The authors stress that the acceptable level of data quality is determined by what it will be used for. They outline six aspects of data quality: accuracy, validity, completeness, timeliness, coverage, and accessibility. The authors choose to focus on accuracy and validity and leave the other topics for future research.
Two types of accuracy tests are discussed in the paper: controlled and field evaluations. Controlled evaluations are conducted in an environment where the behavior of those counted and the configuration of the counter is controlled by the investigator. For example, a controlled test may ask participants to walk side by side in order to study errors from occlusion. This helps understand specific potential sources of error. By contrast, field evaluations are conducted by observing facility users who are not being directed by the investigator. This helps understand accuracy in practice, where things the investigator did not foresee may occur.
The paper recommends three methods to check the validity of automated data: quality control checks, validity criteria, and business rules. Quality control checks include visual review. The authors focus primarily on automated validity criteria as the “first line of defense” in protecting against erroneous data. Validity criteria include:
The authors examine an example data set from a trail in Texas. They use the first and third quartiles of hourly counts per direction for weekdays and separately for weekends to identify unusually high counts outside the interquartile range (IQR) represented as:
IQR = 2.5 (Q3-Q1) + Q3
Where Q1 and Q3 are the first and third quartiles, respectively. A constant of 1.5 is more common for motor vehicles, but the authors they use the value 2.5 to be more “conservative.” They also use counts in one direction to check and adjust counts that were unusually high in the opposite direction. They also highlight the importance of checking data manually through visual inspection.
NCHRP 797, Guidebook on Pedestrian and Bicycle Volume Data Collection, discusses data quality issues for both manual and automated bicycle and pedestrian counts. For manual counts, the report stresses the importance of training volunteers or staff. For automated counts, the report lists the following sources of counter inaccuracy for automated counting technologies: occlusion, environmental conditions, counter bypassing, and mixed-traffic effects.
To understand and quantify error, the report recommends that each counter should be validated though an initial test of 15 minutes to one hour of counts during which an on-site manual count is compared to the counts on the automated counter. In addition, the report recommends that the first few days of counts at a new site should be examined for any strange patterns that may be due to unusual behaviors specific to that site, installation problems, or environmental issues. For example, infrared sensors can be sensitive to heat from surrounding sources, which may result in false pedestrian counts.
For continuous sites, the report recommends that the initial test be followed by a longer-term test that provides a basis for calibrating equipment. Some detection technologies may have different settings or allow adjustments that may improve the count accuracy. The report recommends working closely with the vendor to reduce inaccuracies. After these steps have been taken, remaining errors can be corrected by using a bias compensation factor computed based on the manual validation count. This bias compensation factor can correct for “systematic over- or undercounting associated with a particular counting technology.”
The recently released draft of the Minnesota DOT (MNDOT) Bicycle and Pedestrian Data Collection Manual draws heavily from the 2013 TMG and NCHRP 797, but includes additional guidance on managing and analyzing pedestrian counts. The draft manual explains that there are two aspects to counter validation: “(1) confirmation of counter operations; and (2) identification and correction for systematic counter error. “141 The manual recommends using two individuals to validate equipment, one to trigger the sensor and the other to watch the equipment. At higher volume locations, the extra person to trigger the sensor may not be needed if there is sufficient traffic to test the sensor. Like the TMG, MNDOT recommends validating continuous count stations at least annually.
MNDOT reports finding that traditional automated checks of continuous count data used for motor vehicles based on statistical tests to identify outliers, are not as useful for pedestrian traffic. This is because pedestrian traffic can be highly variable, especially in low traffic volume locations where hours of zero counts are common, but a track team out for a run can cause a sudden spike.
Our review focuses on research related to automated data collection because it is the most efficient way to collect a sufficient amount of data for planning and analysis purposes, and because the automated counting equipment that is currently available tends to less accurately measure pedestrian traffic than manual counts. However, even in automated data collection programs, manual counts are often used to ground truth data, so the quality of manual counts should also be considered. For example, Diogenes et al. found that for manual counts at intersections with paper or clickers underestimated pedestrian volumes by eight to 25 percent, and that error was greater at the beginning and end of the count period.142
The TMG advises that because accuracy decreases for manual counters after two hours, counters should be given breaks.143 Observer inattention is a source of error. Concerns are often expressed that volunteer counters may have ulterior motives which may lead to overcounting, but evidence of this was not found in the literature. To overcome these sources of error, manual pedestrian counts based on videos of facilities that can be reviewed in the office are commonly considered to produce the highest accuracy counts and are recommended when validating and calibrating counting equipment.
Because the field of pedestrian data collection is still evolving, we asked practitioners how they quality check their continuous count data. Currently, most nonmotorized traffic count data is bicycle data. Because bicycle and pedestrian count data are often collected in the same data stream, both are often processed in the same way by many practitioners. These data streams can be either combined bicycle and pedestrian counts, such as from a passive infrared counter, or separated bicycle and pedestrian counts from a combined inductive loop with infrared counters, such as the Eco-Multi. Findings below are for jurisdictions who have counting equipment which separates pedestrian from bicycle counts:
In addition, some quality checks have been developed for bicycle data, which may or may not be relevant for pedestrian data:
In addition, FHWA is proposing the following checks for all nonmotorized traffic data to be utilized as part of the Travel Monitoring Analysis System (TMAS) version 2.7, including pedestrian data:
In TMAS, these quality control flags are to be changeable so that values that reflect travel patterns specific to that count location can be used instead of the default values. These local QC criteria would then be stored for future counts done at the same location.
Some vendors of pedestrian count data collection devices also build in the capability to conduct automated data quality checks. For example, Eco-Counter’s Eco-Visio software reports the following flags for continuous sites with automatic data uploads:
Similarly DataNet, TRAFx’s proprietary software allows users to flag the ten highest days as possible outliers.
There are multiple aspects to quality checking of traffic data in general, many of which apply to pedestrian data:
NCHRP 797 outlines a validation process for automated counters that involves comparing automated count to manual count data using short-duration tests for all sites and long-term tests for continuous sites. The test for long-term sites include comparing counts from the automated equipment to ground truth counts collected by manually counting pedestrians from recorded video or in the field for a 15-minute to two-hour time period.149 The report recommends that this should be done at installation, several days after installation and annually thereafter. In addition to the comparison of ground truth manual counts to automated counts, it also recommends visual inspection of the travel pattern observed in the first days after counter installation in order to observe any unusual patterns that may be associated with other modes inadvertently being counted.
There are currently no standard procedures for automated checks of pedestrian continuous count data. This is an area of continuing research. Some automated quality assurance and control procedures include checks for multiple days or hours with consecutive zeros, missing data, repeating counts, comparison to previous counts, and checks for spikes above some threshold. Current practice is summarized in Table 5‑2.
Table 5‑2. Summary of Quality Control Checks for Non-motorized Traffic Counts
| Source | Upper bound [lower bound] | Identical non-zero values | Consecutive zeros | Directional Split |
|---|---|---|---|---|
| Turner & Lasley | Interquartile range (IQR) = 2.5 (Q3-Q1) + Q3 | - | - | - |
| Seattle Department of Transportation | 3 standard deviations above surrounding days | - | - | - |
| University of Minnesota | 2 to 3 standard deviation above average | - | - | - |
| Colorado Department of Transportation | Weekly check: daily count 3 times higher previous year’s average daily traffic; Quarterly check: IQR = 2.5 (Q3-Q1) + Q3 | - | Over 2 days of zero counts (non-mountain locations) | splits greater than 70 percent/30 percent |
| North Carolina State University | 3 standard deviations above [or below] predicted daily count based on model from previous 6 months of cleaned data (model includes weather and day of week) | - | Over 3 days of zero counts | Splits greater than 3 standard deviations of average |
| Portland State University | 1,500 per hour, 5,000 per day | Over 6 identical non-zero values | Over 15 hours of zero counts | - |
| FHWA TMAS V2.7 | For hourly counts <100: flag if 100% over [or under] the previous interval count For hourly counts >100: Flag if 100 higher [or lower] than previous interval count Over 50,000 daily count; over 4,000 hourly count For daily counts under 1,000: Flag if 100% > [or <] than average of past 6 previous. If daily count over 1,000: flag if 1000 over [or under] the average of past 6 previous. |
Over 3 identical non-zero values | <7 hours with consecutive zeros | - |
Note: “-“ indicates that no specific values were indicated for these tests.
In order to understand any travel monitoring data, it is necessary to know the basic who, what, where and how of the data: who collected it, what it monitors, where it was collected, and how it was collected. This is recorded in the metadata. Metadata allow data users to search for data by site or equipment characteristics and overlay data from different databases. For example if pedestrian volumes at crosswalks are desired for a safety study, the metadata allows researchers to identify the sites of interest and to match these sites with crash locations.
The TMG discusses standard metadata for motor vehicle travel monitoring as well as critical and optional metadata for nonmotorized traffic. Other community-used nonmotorized traffic datasets include different metadata.
This subsection discusses the most frequently documented metadata standards for nonmotorized traffic, including the TMG and the National Bicycle and Pedestrian Documentation Project, as well as standards used by local and regional governments that have extensive pedestrian data collection programs and those used in proprietary datasets such as Eco-Visio and DataNet.
Nonmotorized counting has only been widely practiced for a decade, meaning that the state of the practice is now where the motorized state of the practice was many decades ago. As such, data formats and standard metadata are still evolving, and vary widely among different sources. There are three significant national efforts to standardize pedestrian data collection: the National Bicycle and Pedestrian Documentation Project (NBPDP), the TMG, and Portland State University’s Bike-Ped Portal. Standard regional formats include the Los Angeles Bike Count Data Clearinghouse (Huff and Brozen 2014) and the format used by the Delaware Valley Regional Planning Commission (DVRPC). Other data collection resources focus on specific facilities, such as the Rails-to-Trails Conservancy Trail Modeling and Assessment Platform (T-MAP), which is designed for trail planning data. Vendors also establish standard metadata for use by their clients as part of their proprietary software. Outside the US, Sustrans in the UK and France’s national database of nonmotorized count data also have standard formats.
There are significant differences among the sources discussed above: some are designed for manual counts and some are designed for automated counts; some are designed to inventory infrastructure as well as count data. We focused our review on count-related metadata used in national resources or well-established local and regional resources from within the U.S.
The NBPDP accepts and stores data files submitted by email to the project’s administrators. It encourages submitters to use its standard data format for such submission but does not require it. The format includes contact information for the person responsible for data as well as data fields summarized in Table 5‑3.
The format asks for general information on the area in which the count is collected, location-specific information such as density and nearby land uses, and count data. While the location-specific information can be helpful in understanding the relationship between land use patterns and pedestrian behavior, data are often not easy for participants to collect, and data providers often skip submitting these data. The recent growth of national land use data sources such as the EPA Smart Location Database may eliminate the need for NBPDP data providers to submit this data.
NBPDP data is not accessible to the public and is not currently archived in a database. Access to NBPDP data is by request, and data are only available in paper format.
The FHWA TMG is “intended to provide the most up to date guidance to State highway agencies in the policies, standards, procedures, and equipment typically used in a traffic monitoring program.”150 Chapter 7 of the recently updated TMG contains a format for coding, entering and sharing nonmotorized traffic count data. Unlike the other data formats discussed here, the TMG format has precise requirements for the number and type of characters in each field in a data file as discussed in the TMG Station Record Data and Volume Data subsection.
The TMG format includes two types of nonmotorized data files: station description records and count records. The station description record includes metadata about the station such as state and county codes, station identification code, functional classification of road along which the station is located (including two new categories for trails and general area counts). Each count record includes count data from a given time period (can be used for both portable and continuous count sites) less than 24-hours, organized by time interval, as well as metadata. Some of the metadata is repeated from the station file, while other metadata, such as optional weather information, a repeat some of this metadata and including the counts for each time interval. The count record includes data for a time period no longer than 24 hours per record, optional weather information, and repeats some of the same fields also included in the station description. When data are recorded for more than one day numerous records for the site would be recorded and stored for the TMG nonmotorized formats. Table 5‑3 summarizes the metadata used in the TMG.
The National Institute for Transportation and Communities (NITC), a federally funded University transportation Center at Portland State University, is creating a national online nonmotorized traffic count archive that includes pedestrian data in order to enable sharing of nonmotorized data. The archive is called Bike-Ped Portal and is being created as a part of an existing motor-vehicle data archive, Portal. The archive structure is designed to be able to handle both mobile and continuous counters as well as both automated and manual counts, and supports multiple counts of the same traffic flow. Currently it can only handle counts on road or path segments, not intersection counts, but NITC plans to expand the database to cover intersection counts. Figure 5‑1 illustrates the basic data structure and metadata; Bike-Ped Portal metadata are also summarized in Table 5‑3.
Figure 5‑1. Bike-Ped Portal Data Structure
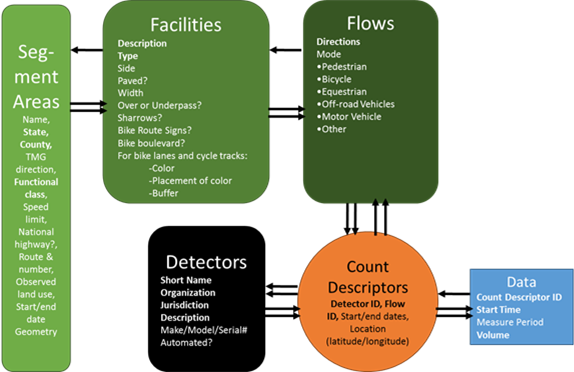
SafeTREC is a research center at the University of California, Berkeley, focused on transportation safety.
SafeTREC maintains a database that inventories infrastructure as well as including nonmotorized traffic volume counts, and includes both a facility inventory and volume data.151 For this reason, it has the most exhaustive list of metadata related to pedestrian infrastructure of any of the databases reviewed. The volume database can store both intersection and segment pedestrian count data, and includes metadata such as whether the count is on an intersection approach or in a crosswalk, whether the count is manual or automated, the approach ID or for crosswalks, the node and approach IDs, the volume by direction of travel, duration of count, start time and weather as a text description.
The University of California Los Angeles (UCLA) Luskin School of Public Affairs’ Bike Count Data Clearinghouse project began in 2012 with the goal of housing bike volume data from the Los Angeles County region; the clearinghouse also includes pedestrian data. The project is co-sponsored by Southern California Association of Governments and the Los Angeles County Metropolitan Transportation Authority. This data archive offers a user-friendly interface featuring a web-based GIS tool to make data accessible for use. Data are standardized for municipalities in Los Angeles County. To our knowledge, this archive is the only publicly available publicly owned, online bicycle count archive that also enables no-cost online data uploads. However, data handling and uploading of data are restricted, and data suppliers must first obtain approval to upload data to the system.
The project database structure is focused primarily on handling data from two-hour manual counts. With a lack of continuous count volume data, users cannot draw conclusions about time of day, day of week, and travel volume trend patterns. However, the Bike Count Data Clearinghouse is the most extensive local data source that we reviewed, and we summarize the metadata used in Table 5‑3
Many other states and regions have standard policies for manually collecting pedestrian data, often influenced by the NBPDP. We summarize a few of the more longstanding examples below. Since these are not online resources, information about the exact format of data is not always available, and there is no distinction between mandatory and optional fields.
Washington State Department of Transportation (WSDOT) has a statewide pedestrian and bicycle data collection program where it facilitates annual manual counts in cities and counties. The documentation project has been ongoing since 2008, when it started with 19 communities, and has expanded to over 200 intersections in 39 different jurisdictions in 2013.152 Each of the 2013 counts captured the number of bicyclists and pedestrians that passed through the intersection and the direction that each was heading when they left the intersection.
Minnesota Department of Transportation (MNDOT) has created a standard format for manually-collected pedestrian data but does not yet maintain a data archive.153 The format includes standard metadata categorizing pedestrians according to the following characteristics: gender, adult/child, assisted/non-assisted (“assisted” includes wheelchair users and skaters). Other standard metadata include location (street or intersection); city and county; name, phone, and email of data collector; name, phone, and email of the agency managing the count; weather (precipitation and high/low temperatures); and latitude and longitude.
In addition, some pedestrian equipment vendors maintain data for their clients in large databases that allow access to clients through online services. Two prominent examples are Eco-Counter’s Eco-Visio service and TRAFx’s DataNet service. A partial list of metadata collected by each are listed below.
Table 5‑3 summarizes the metadata fields used in five of the most widely-used or up-to-date formats discussed above. Required data fields are italicized.
Table 5‑3. Summary of Metadata Fields Included in Standard Data Formats
| Field type | NBPDP | TMG | Los Angeles | SafeTREC | Bike-Ped Portal |
|---|---|---|---|---|---|
| Identi-fication |
|
|
|
|
|
| Location |
|
|
|
|
|
| Route |
|
|
|
|
|
| Facility |
|
|
|
|
|
| Network |
|
|
|
|
|
| Counter |
|
|
|
|
|
| Count type |
|
|
|
|
|
| Date and time |
|
|
|
|
|
| Weather |
|
|
|
|
|
| Factor Grouping |
|
|
|
|
|
Table 5‑3 illustrates just how varied data formats are. Users are presented with a large array of optional fields, many of which can be labor-intensive to collect. Some types of fields are frequently found in many of the archives, and serve as de facto high-priority variables. Below is a list of document data fields with the relevant TMG field names given in parenthesis.
Including the year in which the count site is established (Year Established) may also be a very helpful metadata field.
Sharing pedestrian data greatly increases its usefulness. The TMG encourages agencies to make data available to others: “Considerable benefit can be obtained by sharing these data collection resources. Access to additional counts will provide data for quality assurance, filling of count gaps, saving money and ease of reporting because all data can be integrated into one platform.”154 The FHWA allows all data in the Travel Monitoring Analysis System (TMAS) to be available to all users to facilitate data sharing between local agencies, metropolitan planning organizations, or states.
Once data are checked and loaded into a database with a standard format and metadata, they can be readily shared online. Two factors influence access to online data: whether the site hosting the data is owned and maintained by a public agency or a private company, and whether the data is publicly available to all users or whether access is limited. We focus our review on publicly owned and publicly available datasets, which allow the highest degree of accessibility and data distribution, but two publicly owned, password protected, sites are also discussed.
There are relatively few publicly owned, publicly available resources for pedestrian count data. We reviewed the most prominent examples with which we are familiar. These represent some of the agencies who are more advanced in data sharing.
Delaware Valley Regional Planning Commission (DVRPC) Pedestrian and Bicycle Counts site155 provides information on weeklong bicycle and pedestrian counts conducted on street segments throughout greater Philadelphia. Users can view a map with points showing the locations of different counts, color-coded by mode, and click on points to see details on the data collected through that count. Figure 5‑2 shows an example of the map and reports produced through the site.
Figure 5‑2. DVRPC Pedestrian and Bicycle Counts Website
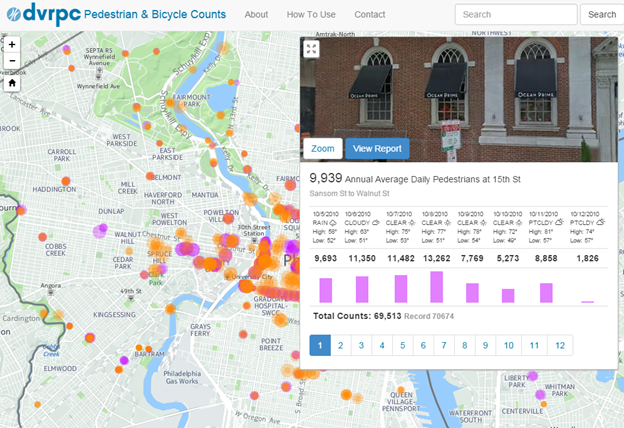
BikeArlington Bicycle and Pedestrian Counters Website156. Bike Arlington, together with Arlington County in Virginia, hosts a site where count data from continuous pedestrian and bicycle counters are displayed. The site features the ability to both download and do simple analysis tasks including compare weather events and temperatures to count data. The site features a map of count sites and allows users to graph pedestrian data, filter it, and summarize the desired data (Figure 5‑3 and Figure 5‑4).
Figure 5‑3. Map View from Bike Arlington Bicycle and Pedestrian Counters Website
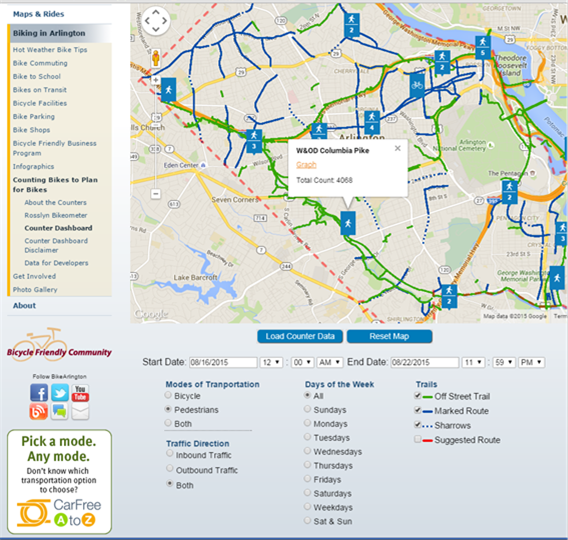
Figure 5‑4. Data View from Bike Arlington Bicycle and Pedestrian Counters Website
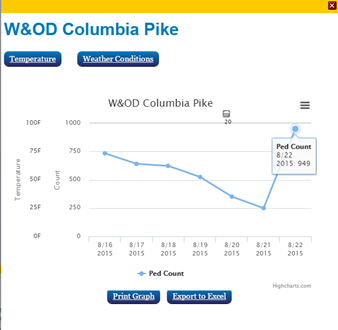
Portland State University Bike-Ped Portal.157This site is currently password-protected (i.e., not public), but is intended to become public in the near future. It offers data storage for bicycle and pedestrian counts from multiple jurisdictions. The site is designed for automated count data but also includes manual counts. Pedestrian data currently available is primarily from manual counts, but the site includes data from both continuous and mobile automated counters. The site is under development, but the version currently available includes a list of count devices, count sites, and allows users to upload and download comma-delineated data files of each.
Southern California Association of Governments (SCAG) Bike Count Data Clearinghouse.158 The SCAG Bike Count Data Clearinghouse is designed primarily for manual count data, but data from automated counters can be entered. The site offers Los Angeles area governments the ability to upload data. While the site is focused on bicycle counts, pedestrian counts are being collected and will be supported in future versions. The site offers the ability to both upload and download data as well as shows the maximum count for each location.
Travel Monitoring Analysis System (TMAS). While TMAS is not currently available to the public, it can be accessed by transportation professionals who would like to obtain access. While TMAS does not currently accept pedestrian count data, the next version of TMAS will include the ability to upload TMG-formatted both pedestrian and bicycle (nonmotorized) station and count data to the system. The system includes the ability to upload data, automated quality control (customized by site), reporting of data, deletion of data, and exporting of data as well as some analysis tools. Should your agency be interested in obtaining access, contact Steven Jessberger at 202-366-5052 or email at steven.jessberger@dot.gov.
In addition to the above five government funded and operated sites, there are two counting equipment vendors that host privately operated archives for pedestrian data primarily for their vendor specific count data: Eco-Visio by Eco-Counter and DataNet by TRAFx. These are also described in Table 5‑4.
There are also software quality control contractors who provide processing, QC and storage capability to agencies for their motorized and nonmotorized data. The three main contractors in the US are High Desert, MS2 and Transmetric.
These basic elements of data management and storage are summarized in Figure 5‑5.
Figure 5‑5. Basic Elements of Data Management and Storage
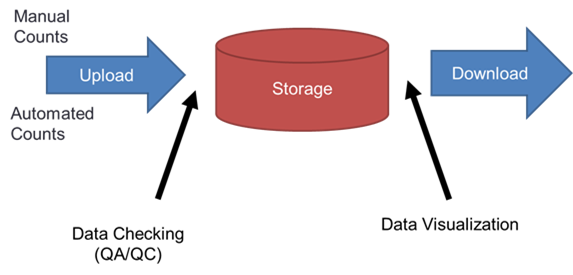
Once an agency has created an online site to share data, there are three basic steps in making data available and accessible, and at each step there are opportunities to adopt best practices that maximize the ease and utility of sharing data.
Table 5‑4 summarizes the data collected by the sites reviewed, as well as the type of data visualization provided and any data sharing allowed. Another aspect of data sharing is documenting the source of the data and validating the data. Details of data validation are discussed in Section 5 Quality Assurance and Control.
Table 5‑4. Examples of Online Nonmotorized Traffic Count Archives
| Organization & Site | Data Types | Data Visualization | Data Sharing | Other | |||
|---|---|---|---|---|---|---|---|
| Duration | Automated data | Map | Graph | Allows download | Allows upload | ||
| DVRPC Pedestrian and Bicycle Counts | One week | ✓ | ✓ | ✓ | ✓ | Includes weather | |
| BikeArlington Bicycle and Pedestrian Counters | Continuous | ✓ | ✓ | ✓ | ✓ | Includes weather | |
| Portland State University Bike-Ped Portal ** | Any | ✓ | ✓ | ✓* | ✓ | ✓ | |
| SCAG Bike Count Data Clearinghouse | 2 hour | ✓ | ✓ | ✓ | |||
| TMAS** | 5,10,15, 20, 30, 60,120 min. | ✓ | ✓ | ✓* | ✓* | Does not yet accept pedestrian data but is expected to in 2016. | |
| Eco-Visio** | 15, 60 min | ✓ | ✓ | ✓ | ✓ | ✓ | Includes weather |
| DataNet** | 60 min | ✓ | ✓ | ✓ | ✓ | ✓ | |
* This aspect of the site is currently under development.
** Currently password-protected and not accessible to the public.
With the exception of Bike-Ped Portal and TMAS, which have the flexibility to handle data from counts of different durations, each of the sites that we reviewed is set up to accommodate only data collected through the type of counts typically used by the administering agency. Most sites can accommodate automated data. It is common practice to provide maps or charts visualizing data, as well as to make data available for download. However, only some sites allow users to upload data.
There are relatively few publicly available (not password-protected) online sites that make pedestrian data available, and many of those that do exist are only set up to handle data from counts of a specific duration, and do not allow users to upload data. Password protected online sites allow data upload and more extensive analysis tools. Common best practices include:
In order for count data to be useful, count data must be summarized in metrics that are useful to practitioners, from regional travel demand modelers to safety analysts to economic development specialists looking to assess pedestrian vitality in a business district. Depending on the particular reason for the pedestrian counts (event management, safety, project development, etc.), different metrics may be needed.
Though the metrics used by different practitioners vary widely, in all cases analysts can benefit from understanding how volumes vary over time and across space. For example, in order to report annual pedestrian volumes, which is a commonly used metric, based on counts conducted at a specific time of day and year, it is necessary to understand how volumes vary throughout the day and as the seasons change. As with motorized traffic counts, pedestrian counts are typically annualized using adjustment factors, but because of the relative lack of data on nonmotorized travel fewer resources have identified adjustment factors. This subsection reviews research on temporal and spatial adjustment factors and identifies common metrics used to summarize data.
Few temporal adjustment factors have been developed for pedestrians. Alta Planning and Design has developed factors that are publicly available through the NBPDP website.159 For bicycling, researchers have discovered that because bicycle patterns are so weather dependent, day-of-year factors can improve estimates of annual daily traffic from short-duration counts.160 Further research is needed to determine whether the same is true for pedestrians.
Schneider, Henry et al. and Hankey, Lindsey et al. studied pedestrian traffic patterns and found that common patterns include one peak during the middle of the day, and some locations with peaks in the evening or even at night when bars let out. They have also found that pedestrian traffic is less impacted by weather and season than bicycle traffic, but more than motor vehicle traffic.161 However, more research is needed to identify how pedestrian volumes vary over the course of the day.
Pedestrian travel patterns can be highly variable. Conversation with pedestrian counting expert Robert Schneider, professor at the University of Wisconsin Milwaukee suggests that pedestrian patterns may vary from sidewalk to adjacent sidewalk and between crosswalks and adjacent sidewalks.162 Pedestrian travel varies from street to street, and city to city. For this reason, understanding spatial variation across a network is important.
On the small scale, counting the total volume of pedestrians passing through an intersection is common. However, for safety studies, volumes per crosswalk by direction of crossing are counted. It is common practice but inaccurate to translate crosswalk counts into total volume per intersection counts. The sum of the crosswalk counts for a given intersection is not the same as the total volume of pedestrians traveling through that same intersection, because some pedestrians will cross multiple crosswalks in the same intersection, while those who turn right will pass through an intersection without crossing any crosswalks.
Another issue is that unless counts are conducted on every sidewalk, crosswalk, alley way, and path, analysts must extrapolate data from a limited number of locations to estimate volume across an entire network, which may be useful for safety studies, travel demand model validation, or economic development analysis. Research on bicycle travel from Montreal suggests that count data combined with GPS data can fill that gap.163 An interview with study author Professor Luis Miranda-Moreno at McGill University indicates that other data sources, such as Wi-Fi detection, may also be useful.164 This combination of data types may be especially useful for understanding pedestrian traffic throughout a network.
One metric for measuring this pedestrian volume on a network is Pedestrian Miles Traveled (PMT). This is simply the length of each facility multiplied by the pedestrian traffic volume on that facility, summed over the network or study area. Research from Washington State investigated this on the state level.165
Common temporal summary metrics include:
For pedestrians, peak hour pedestrians is not well defined. Commonly, the maximum hour recorded is reported as the peak hour, but further research is needed to determine if the 30th highest peak hour for the year (similar to motor vehicle peak hour) would be more appropriate or if a different metric for peak hour would be more appropriate for pedestrians.
The NBPDP provides temporal adjustment factors that can be used to estimate annual volumes based on daily volumes. However, little research is available to estimate daily volumes based on limited-duration counts.
Common spatial summary metrics include:
The existence of two common metrics for intersection studies can create confusion; more guidance is needed to help practitioners distinguish and translate between the two.
In order to understand data management, it is important to understand the types of data formats currently available. This section focuses on automated count data, but also includes some standard formats for manual count data collection as this is a common source of pedestrian count data.
The purpose of this section is not to provide an exhaustive inventory of all data formats, but to provide examples of various data types that are currently available.
To provide a range of examples of pedestrian count data formats, we will discuss the manual count formats from the National Bicycle and Pedestrian Documentation Project (NBPDP) and from the standard format used to track intersection turning movements, automated counts from two prominent vendors: Eco-Counter and TRAFx. All of the example data from automated counters shown are from passive infrared counters, meaning that they count all warm bodies as a single value. The devices do not distinguish between bicycles and pedestrians.
The NBPDP was the first national-level effort to create a standard format for bicycle and pedestrian counts. It was initiated as a joint effort between the Institute of Transportation Engineers (ITE) and Alta Planning and Design in 2004 in response to the lack of widely available bicycle and pedestrian data.166 The NBPDP website provides standard forms, instructions, and other information for agencies interested in counting nonmotorized traffic. The NBPDP has helped and encouraged many jurisdictions around the nation to start bicycle and pedestrian counting programs. It is designed for manual count data; automated pedestrian data collection has evolved significantly since the NBPDP was created.
Table 5‑5 and Table 5‑6 show the NBPDP data format, which includes metadata and two time periods of count data. Additional count records would be added as rows below “Count #2 Data” and additional count locations would be added as additional columns to the right of the column labeled “Loc. #3.” Counts are collected as bicycle, pedestrian, and other, in which “other” includes equestrians, skate boarders, and roller bladders.
Table 5‑5. NBPDP Background Datasheet (Metadata)
| Agency/Organization: | Enter here | ||
| ID #: | Enter here | ||
| Date sheet completed: | Enter here | ||
| Contact Information: | Enter here | ||
| Lead Person Name | Enter here | ||
| Address | Enter here | ||
| Enter here | |||
| Phone | Enter here | Region | |
| General Area Background: | Local Community | County | |
| Name of jurisdiction(s): | Enter here | Enter here | |
| If County or Region, # of local agencies: | Enter here | ||
| Source of demographic data: | Enter here | ||
| Year of data: | Enter here | Enter here | Enter here |
| Population: | Enter here | Enter here | Enter here |
| Density (people per square mile): | Enter here | Enter here | Enter here |
| Bicycle Mode Share: US Journey to Work | Enter here | Enter here | |
| Pedestrian Mode Share: US Journey to Work | Enter here | Enter here | |
| Median Age: | Enter here | Enter here | |
| Median Income: | Enter here | Enter here | Enter here |
| Number of annual visitors to area: | Enter here |
Table 5‑6. NBPDP Background Datasheet (Count Location Description)
| Agency/Organization: | Enter here | ||
| Count Location Description: | Loc. #1 | Loc. #2 | Loc. #3 |
| Type of facility: | Enter here | Enter here | Enter here |
| Type of setting: | Enter here | Enter here | Enter here |
| Scenic Quality: | Enter here | Enter here | Enter here |
| Surrounding land uses: | Enter here | Enter here | Enter here |
| Schools, parks, visitor destinations within 1 mile: | Enter here | Enter here | Enter here |
| Quality of connecting facilities: | Enter here | Enter here | Enter here |
| Length of facility: | Enter here | Enter here | Enter here |
| Access: | Enter here | Enter here | Enter here |
| Quality of overall network: | Enter here | Enter here | Enter here |
| Traffic volumes (ADT): | Enter here | Enter here | Enter here |
| Traffic speeds (posted): | Enter here | Enter here | Enter here |
| Crossings and intersections: | Enter here | Enter here | Enter here |
| Crossings and intersection traffic: | Enter here | Enter here | Enter here |
| Crossings and intersection protection: | Enter here | Enter here | Enter here |
| Topography: | Enter here | Enter here | Enter here |
| Count #1 Data: | |||
| Date Collected: | Enter here | Enter here | Enter here |
| Time Period: | Enter here | Enter here | Enter here |
| Weather: | Enter here | Enter here | Enter here |
| Bicycles: | Enter here | Enter here | Enter here |
| Pedestrians: | Enter here | Enter here | Enter here |
| Other: | Enter here | Enter here | Enter here |
| Count #2 Data: | |||
| Date Collected: | Enter here | Enter here | Enter here |
| Time Period: | Enter here | Enter here | Enter here |
| Weather: | Enter here | Enter here | Enter here |
| Bicycles: | Enter here | Enter here | Enter here |
| Pedestrians: | Enter here | Enter here | Enter here |
| Other: | Enter here | Enter here | Enter here |
Recently, apps have been developed for use with smart phones and other mobile devices which aid in collecting manual pedestrian count data, but often volunteers and others still enter data on paper and enter it into spreadsheets later.
Intersection turning movement counts are a common data type. While the exact format of the data varies by vendor, by intersection, and by jurisdiction, the basic concept is the same. Data can be collected directly in the field or entered from videos. Counts can be collected by volunteers, staff or traffic monitoring firms, and data are often entered in electronic count boards and output in spreadsheet format. Figure 5‑6 shows an example of the spreadsheet format.
Figure 5‑6. Example Manual Turning Movement Count Using JAMAR Count Board167
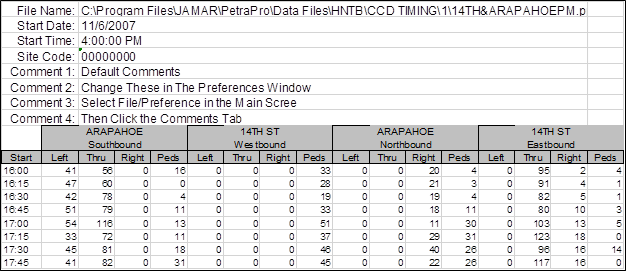
As discussed above, though apps are available to support manual pedestrian counts, most agencies still use paper and clipboard to do pedestrian intersection counts. However, in some cases, such as Washington State’s Bicycle and Pedestrian Documentation Program, volunteers enter count data from their paper forms used in the field directly into an online database. This avoids additional staff time to aggregate this data.
Eco-Counter sells passive infrared counters for counting pedestrians on off-street trails and sidewalks. Figure 5‑7 shows an example of the standard data format for Eco-Counter devices. The first and second columns list the start date and time of the count period. The third column lists the total volume and the fourth and fifth column list the pedestrians counted in the each direction.
Figure 5‑7. Eco-Counter Pedestrian Count Output
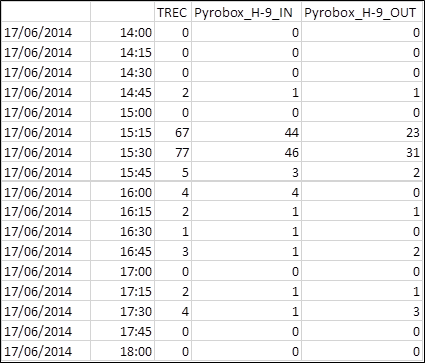
TRAFx is another vendor of pedestrian counting equipment; its passive infrared counters are commonly used to count pedestrians in parks across North America. Figure 5‑8 shows an example of TRAFx raw pedestrian count data, which is supplied by the vendor in CSV format. The first two columns indicate the start date (yy-mm-dd) and time, and the third indicates the total pedestrian traffic volume. This example comes from a non-directional counter.
Figure 5‑8. TRAFx Raw Data Format
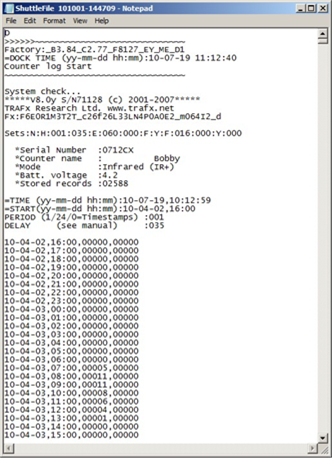
The two automated count formats reviewed are similar, with fields for date, time, and count data. Manual count formats include these data, but vary more widely, distinguishing between modes (pedestrian vs. bicycle) and, in the case of intersection counts, movements in count data. Manual formats may include more varied metadata on weather and the location in which the count was performed.
This subsection reviews the existing TMG station record requirements and volume data. These formats allow count data to be added to the Travel Monitoring Analysis System (TMAS), the U.S. Department of Transportation’s database for travel data. The TMG Chapter 7.9 and 7.10 specifies two separate formats, one for station records and another for count records.168
Ten of the fields are the same in both formats. Each record corresponds to one line in a data input file. The TMG format is in a fixed-width text format in which each character in the record is considered to be in a separate “column.” Since fields are not separated by commas or other delimiters, it is critical that each character be in the correct “column.” If an extra space, comma, or any other character is added to the record, the characters following it will be incorrectly read by TMAS. Fields in the TMG are indicated with a “C” for critical if they are required or an “O” for optional. Fields that are required only in some situations are designated with an “O/C.”
Each field in the station record is described below, and an example of station record data is provided at the end of this subsection in Figure 5‑10. Note that there are three fields that work together to identify the location of the count station: direction of route, location of count relative to roadway orientation, and movement direction. In some cases, the fields “crosswalk, sidewalk, exclusive facility or total intersection count” and “intersection” also provide information the type of count. We identify each field with its name, information in whether it is required (C, O, or C/O), and column number, (Field Name, C/O, Column Number) which is the number of characters from the beginning of the row, such that Column 1 refers to the first character in the row and Column 60, the 60th character in the row.
Nonmotorized station/location record identifier (C, 1): The first character in a pedestrian station record is the letter “L” which is used to alert the system that the record is a nonmotorized traffic station record.
State and County FIPS Codes (C, 2-6): The next two fields are the Federal Information Processing Standards (FIPS) codes for the state and county. The state code can be found in Table 7-32 on Page 7-72 of the TMG, but the three digit county codes must be looked up from the Federal Information Standards Publication 6.170 Figure 5‑10 below is for Multnomah County (051) in Oregon (41).
Station ID (C, 7-12): The next six columns of the station record are reserved for the Station ID. This is a code unique to the count station. It may be determined by the jurisdiction collecting the data but should be coordinated with the state in order to prevent repetition. The ID is right justified, such that if the Station ID is the number 22, the values in the six columns would be 000022, as shown in Figure 5‑10.
Classification of road (C, 13): The next column is the one digit code for the functional classification for the roadway or path as listed in Table 7-33 of the TMG on page 7-73. This will be expanded to two digits in future versions of the TMG, with the second digit being either U for Urban or R for Rural. The traditional roadway classifications are expanded in this table to include two new nonmotorized traffic specific classes: “Trail or Shared Use Path” and “General Activity Count.” If a trail or shared use path is adjacent to, parallel to, and associated with a roadway, the functional classification of the roadway should be used, not the Trail or Shared Use Path code. Similarly, if the pedestrians counted are on a sidewalk or crosswalk, the functional classification of the associated roadway should be used. A general activity count refers to a count of pedestrians in an open area or plaza, like the National Mall in Washington, D.C. In the example below the pedestrian count is from a shared use path immediately adjacent to a Minor Arterial, so the code is 4.As is illustrated in Figure 5‑10 below.
Direction of Route171 (C, 14): This field contains an integer that refers to the direction of the overall route (often the motor vehicle route) associated with the pedestrian traffic. Table 7-34 in the TMG lists the values of the direction of route.172 Direction of route does not always correspond with the actual direction of pedestrian or flow at the location where the count is collected, but instead refers to the overall direction of flow along a numbered route. For example, an east-west route may have north-south roadway segment, where a user may identify the direction of route as north when according to the TMG it should be east, as shown in Figure 5‑9.
Figure 5‑9. Direction of Route Does Not Match Direction of Pedestrian Travel
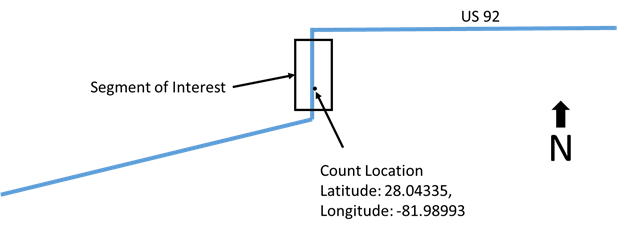
Note: The latitude and longitude in the above diagram is not TMG formatted.
Location of count relative to roadway orientation (C, 15): This field contains a numeric value indicating where the pedestrian count was collected relative to a roadway based on the “direction of route” field. If the count is taken on the side of the road closest to the motor vehicles traveling in the “direction of route,” the code is 1. If the pedestrian count is taken on the opposite side of the road from the vehicles traveling in the “direction of route,” the code is 2. If pedestrians on both sides of the roadway are being counted at the same time, the code is 3. These codes are also used for facilities that are not along a roadway, since the user will have identified a direction of route in the previous field. If the pedestrians counted are crossing a roadway, the code is 4, indicating pedestrian travel is perpendicular to the roadway. In the example coding, the code 1 indicates that pedestrians counted are traveling on a sidewalk on the east side of the north-south section of the east-west route shown in Figure 5‑10.
Direction of travel (C, 16): This field indicates the direction of pedestrian travel relative to the direction of route. If pedestrians counted are moving in the same direction as the direction of route the code is 1. If pedestrians counted are moving in the opposite direction, the code is 2. If pedestrians are moving in both directions or for general activity counts, the code is 3. If pedestrians are moving both directions in a crosswalk perpendicular to the direction of route, the code is 4. This coding means that pedestrians in a crosswalk cannot be separated by direction of pedestrian travel. In the example, code 3 indicates that pedestrians counted are traveling in both directions.
Crosswalk, sidewalk, exclusive facility, or total intersection count (C, 17): This field identifies the type of facilities on which pedestrians are traveling using the following codes:
In the revised version of the TMG, the following codes will be added:
If pedestrians counted are crossing a street within a block where there is no crosswalk, the updated TMG will direct users to code the facility as 1. In the example of the sidewalk shown below in Figure 5‑10, this field is coded 3.
Intersection (O, 18): This optional field indicates if the count is collected at a roundabout (code “1”) or a non-roundabout intersection (code “2”). If the pedestrians counted are not at an intersection, the field is blank. Blanks are entered as underscores (“_”) in the TMG format. In the sidewalk example shown below in Figure 5‑10, this would be left blank.
Type of count (C, 19): This field indicates the mode of travel. Code “1” indicates that only pedestrians are counted. If pedestrians and bicycles are both being counted, this field is coded as “4”. If all nonmotorized traffic is counted including bicyclists, equestrians, skate boarders etc., this field is coded as “5”. If all motorized and nonmotorized traffic using the facility is included in the count, this field is coded as “6”. Code 6 could include snowmobiles along with snowshoers (pedestrians) and skiers, for example. In the sidewalk example shown below in Figure 5‑10, the code is 1 for a pedestrian-only facility.
Method of counting (C, 20-21): This field indicates if the count was collected by a human observer (code 1), by a portable automated traffic counter (code 2), or by a permanent continuous counter (code 3). Even though this is a two-column field, only one column is needed, so the first character is zero. For example, if the count on the sidewalk was collected by a portable passive infrared counter, the field would be coded as “02.”
Type of sensor (O, 22-23): This field indicates the type of sensor used. If more than one sensor type is used, this field is coded as “9”. If the sensor is a human being in the field counting pedestrians with or without electronic count boards, it is coded as H. If the pedestrians are videotaped and counted manually in the office later by a human, it is coded as “1”. If the video is processed by automated or semi-automated image processor software which converts images to counts, it is coded as V. The rest of the code options designate various technologies, including passive infrared (code I), active infrared (code “2”), sonic/acoustic (code “S”), and other pressure mat (code “3”), as shown on page 7-76 of the TMG. Even though this is a two-column field, only one column is needed, so the first character is an underscore “_”. For example, if the count was collected by a portable passive infrared counter, the field would be coded as “_I”.
Year (C, 24-27): This field shows the year in which the count was collected. In Figure 5‑10 below, the data were collected in 2014.
Factor Groups (O, 28-32): The next five fields are optional factor group fields which fill one column each. The values of these groups are left to the data submitters so that they are able to list factor groups for each station. The value in the field is not the factor itself, but a code for the factor group in which the station should be included, e.g., time-of-day factors, day-of-week factors, monthly factors, bias compensation factors, and weather factors. These can all be left blank if no factor groups are being used, as shown in Figure 5‑10 below.
Primary Count Purpose (O, 33): This is a single column field that indicates the purpose of the count: “O” for operation and management of facilities, “P” for planning or statistical reporting,173 “R” for research, “S” for Safe Routes to School, “L” for facility design, and “E” for enforcement. In our example in Figure 5‑10, the purpose is left blank as an underscore “_”.
Posted Speed Limit (O, 34-35): This field indicates the speed limit on the roadway or path in miles per hour. In Figure 5‑10, the speed limit is “45” for 45 miles per hour.
Year Station Established (O, 36-39): This field contains the year the station began recording. In Figure 5‑10 this is 2010.
Year Station Discontinued (O, 40-43): This field is the year in which the station was discontinued. Our fictitious example station was not discontinued, so the field is left blank, as illustrated in Figure 5‑10.
National Highway System (O, 44): This field shows and “N” for no if the count is collected on or associated with a roadway not in the National Highway System and “Y” for yes if it is in the National Highway System. In Figure 5‑10, the roadway is part of US route 92, so it is part of the national highway system and thus coded as “Y”.
Latitude (C, 45-52): This field assumes that the latitude is in the northern hemisphere such that the decimal place would appear between the second and third columns. In the example illustrated in Figure 5‑10, the latitude is 28.04335, so this is coded as “28043350” (the additional zero is added to the end to ensure that the field is the required eight characters).
Longitude (C, 53-61): This assumes that the longitude is in the western hemisphere such that the negative sign is dropped and the decimal place would appear between the third and fourth columns. In Figure 5‑10, the longitude is -81.98993 which would be coded as “081989930” (the additional zero is added to the end to ensure that the field is the required nine characters).
Posted Route Signing (O, 62-63): This field refers to the route signing codes listed in Table 7-35 in the TMG, which indicate the type of route from the HPMS Field Manual.174 In Figure 5‑10 the route is posted as US 92, and the code for a US route is 03.
Posted Signed Route Number (O, 64-71): This field refers to the route number of the posted route signing. If the roadway associated with the count is not on a signed route, as for a city street, the field should be filled with zeros. For trails that are not part of a designated U.S. Bike Route, the field should be filled with zeros. This field is right-justified, so in Figure 5‑10, Route 92 is entered as “00000092.”
Linear Referencing System Identification (O, 72-131): This optional field can be used to join the count data to geocoded data. It can be composed of letters or numbers, but not blanks. This field is right justified, so unused columns are entered as leading zero values. This field is not shown in Figure 5‑10 because it is both optional and long.
Linear Referencing System Location Point (O, 132-139): This field is the distance along the route (in miles, to the nearest thousandth of a mile) to the count station from the defined start of the roadway. As with latitude, the decimal is not used, but implied in the middle of the field, between the fourth and fifth characters. This field is not shown in the example in Figure 5‑10 because it is both optional and long.
Station Location (O, 140-189): This is a 50-character text field describing the location of the site. The text should be left justified. If the station is on a trail or city street, this field will include the trail or street and city name, potentially abbreviated to meet the character limit. This field is not shown in the example in Figure 5‑10 because it is both optional and long.
Other Notes (O, 190-239): This is a 50-character text field for other notes. This field is not shown in the example in Figure 5‑10 use it is both optional and long.
Figure 5‑10. Example Station Record in TMG Format
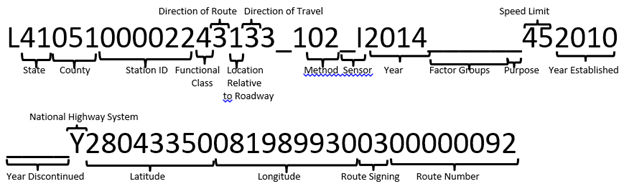
Note: The record example above is shown on two separate lines, but in reality, it would all be on one row of text. Additional optional information can be added at the end of this record, such as linear referencing system information, station location and other notes.
This subsection describes each field in the volume record except for the ten fields that are identical to those used in the station record, which are described above: State FIPS Code; County FIPS Code; Station ID; Route Direction; Location of count relative to roadway orientation; Direction of travel; Crosswalk, sidewalk, or exclusive facility; Intersection; Type of count (pedestrian); and Type of sensor.
Nonmotorized Count Record Identifier (C, 1). The first character in a pedestrian station record is the letter “N,” which is used to alert the system that the record is a nonmotorized traffic station record.
State and County FIPS Code and Station ID: The next three fields of the Count Record contain the State and County FIPS Code and the Station ID, and are identical to these fields in the Station Record.
Latitude and Longitude Fields: Columns 13 through 20 contain the latitude and longitude and are the same as Columns 45-61 in the Station Record.
Direction of Route Field through Type of Count Fields: Columns 30 through 35 in the Count Record are identical to Columns 14 through 19 in the Station Record.
Type of Sensor: Columns 36 through 37 in the Count Record are identical to Columns 22 through 23 in the Station Record.
Precipitation (O, 38): This field indicates if measurable precipitation was observed during the count period. If precipitation has been observed, it is coded as one. If not, it is coded as two. If unknown, the field is filled with a blank (designated with an underscore).
High Temperature (O, 39-41): This integer field is the high temperature for the day, or for the count period if the count is less than a day in duration. Temperatures are entered in whole numbers in degrees Fahrenheit and are right-justified, such that zeros are entered in the first and second column in the case of two- or one-digit temperatures. For example, a day with a high of 62.3 degrees Fahrenheit would be coded “062”.
Low Temperature (O, 42-44): This integer field is the low temperature for the day or for the time period of the count in degrees Fahrenheit. The format for this field is the same as for the High Temperature field described above.
Year of Count (C, 45-48): The year in which the count was collected, same as Columns 24-27 in the Station Record.
Month of Count (C, 49-50): The month in which the count was collected is entered as a two digit integer where January is indicated as 01 and December as 12.
Day of Count (C, 51-52): The day of the month on which the count was collected is entered as a two digit integer where the eight day of the month is entered as 08.
Count Start Time for This Record (C, 53-56): This field contains the start time for the count period, expressed in military time with colons removed. For example, 9:00 AM would be entered as 0900 and 1:00 PM would be entered as 1300. Round numbers are used, such that hour counts should not start at 9:33 AM, but at 9:00 AM or 10:00 AM. If the count is a full day count, it is assumed to begin at midnight, with a value of 0000.
Count Interval Being Reported (C, 57-59): This field indicates the number of minutes in each count interval. Options are 5, 10, 15, 20, 30, 60, or 120-minute intervals. For example, counts in one hour intervals would be coded as 060. Data from different days should be submitted in separate records.
Count Interval 1 (C, 60-64): This integer value indicates the volume of pedestrian (and other modes if the counts are not separated by mode) traffic recorded during the count interval. If the count is 45, the record would read “___45,” with three underscores preceding the two-digit value. If no counts were recorded the record would read “____0” with four underscores preceding the zero in Column 64.
The remaining columns are all optional, up to a maximum of 2500 columns. All counts in a record must be taken during the same day. Each additional interval count is an additional five characters and follows the same coding rules described for Count Interval 1.
The state of the practice in pedestrian data collection is evolving rapidly. However there are still many unanswered questions about how to best implement pedestrian count programs due to the nation’s lack of experience with such programs. The following subsections summarize findings related to the four main aspects of data management covered in this section.
Automated data collection is necessary to inform comprehensive pedestrian plans and analyses. Many resources identify quality assurance procedures for automated motor vehicle count data that can also be applied to pedestrian data, but further work is needed to develop best practices that account for the unique nature of pedestrian data, including:
The TMG Chapter 7 provides a standard list of metadata. These are documented in detail in the station record description in TMG Section 7.9, as well as in the count record in TMG Section 7.10. Other data archives also give standard metadata. Below is a list of documented data fields (relevant TMG field names given in parenthesis).
Making data available online allows a variety of users to access it, but there are a limited number of online sources of bicycle and pedestrian data. Common best practices from current sources include:
A national online clearinghouse for pedestrian count data would help to standardize data collection efforts and make it easy for all users to access and analyze pedestrian data. FHWA’s Travel Monitoring Analysis System (TMAS) can serve as a permanent data archive for pedestrian count data. The benefits of TMAS include cross-jurisdiction data sharing, analysis tools, and inclusion in a national dataset which can improve a jurisdiction’s chances of funding for future projects, such as TIGER grants
To standardize pedestrian count data in a way that simplifies data collection and maximizes comparability with motor vehicle traffic monitoring practice, the following standard summary metrics are suggested.
In order for these metrics to become standard practice, more research and guidance are needed to create adjustment factors that will help practitioners create summary metrics based on counts from different locations, dates, and times.
This section provides conclusions and recommendations based on findings from the research. Each topic area is presented in the order that it appeared in the report.
Counting pedestrians is an important but challenging task: pedestrian activity is localized and heavily influenced by land use; pedestrian movements are not constrained to a given path; there are few automated technologies that capture pedestrians well; and some of the emerging technologies have not been widely tested. Review of the academic literature, coupled with feedback received during the webinar and interviews with experts, reveals that most agencies that collect nonmotorized count data are further along with bicycle data collection and monitoring than pedestrian data collection.
Of the 17 agencies with pedestrian count programs that we identified through our interviews and webinar, most (70 percent) indicated that infrared equipment is used for counting pedestrians. All but two agencies reported collecting short-duration counts, most of which (60 percent) were collected manually. A minority of responding agencies (35 percent) reported collecting continuous pedestrian counts. Only 30 percent of the respondents mentioned counting at intersections, while a majority (60 percent) indicated that they count on trails and paths. Sidewalks and mid-block crossings were also mentioned as count locations by multiple agencies. Only a third of respondents mentioned having both short-duration and continuous pedestrian count programs.
Agencies engaged during this research indicated more detailed guidance on best practices would be useful. Following is a list of recommended best practices that emerged from the research described in this section.
Our research also revealed a number of potential topics for further research:
When counting pedestrians, it is critical to choose the right technology for the count purpose, setting, and duration. Once the appropriate technology has been chosen, proper installation, calibration and validation (for automated equipment) are essential to ensuring good quality counts. Agencies also need to assess how best to strategically allocate limited resources when managing counting programs.
In general, counting pedestrian traffic at constrained points and in pedestrian-only environments helps to reduce error from occlusion and potential errors due to automated counters capturing bicyclists or other non-pedestrians. However, many facilities on which agencies will want to collect count data do not meet these criteria. Specific recommendations for automated counting by facility type are listed in Table 6‑1.
Table 6‑1. Specific Recommendations for Automated Counting by Facility Type
| Facility | Intersection / Segment? | Automated Technologies Used | Specific Recommendations |
|---|---|---|---|
| Sidewalks (and pedestrian-only trails) | Segment | Passive infrared, active infrared, automated counts from video | Point infrared emitters toward a wall or another non-reflective, non-moving surface, and do not install infrared receivers in direct sunlight. Video is best collected from above to prevent occlusion. |
| Crosswalks | Intersection | Automated counts from video, pedestrian push button actuation | Video is best collected from above, if possible, to prevent occlusion. |
| Shared use paths | Both | Passive or active infrared in combination with inductive loops or pneumatic tubes to distinguish cyclists; pressure pads (if unpaved) | If tubes used, small diameter are best, to reduce trip hazard and increase accuracy. |
| Vertical transportation | Segment | Passive infrared, active infrared, pressure pads, thermal cameras | Install equipment in a secure location to prevent vandalism. |
| Overpasses and Underpasses | Segment | Passive or active infrared, alone or in combination with inductive loops or pneumatic tubes to distinguish cyclists | It can be difficult to place equipment on bridge decks; an alternative is to place it at approaches. |
| Plazas | General activity | Wi-Fi/Bluetooth detectors | Manual counts can be used to track paths through plazas or conducted at points of entrance. |
| Road shoulder* | Segment | None | Further research is needed |
| Pedestrians crossing not at crosswalks* | Segment | Infrared motion-activated cameras | Further research is needed. |
* Manual counts from video is probably the most viable option for these facilities because the ability to fast forward makes to process of counting infrequent events more efficient. Infrared motion-activated cameras like those used to monitor wildlife crossings can also be used.
In addition, surrogate measures of pedestrian counts such as Bluetooth and Wi-Fi counting and pedestrian push button actuation logs may provide useful supplements to pedestrian count data, to help improve estimates of pedestrian volumes where counts are not collected.
Since technologies are continuously evolving, future innovation and development may bring new or improved technologies to the field of pedestrian counting that my improve data collection and improve pedestrian traffic counting. Continuing to watch and study these developments will be helpful for the future of pedestrian traffic counting.
Though a variety of count types, durations, locations, and technologies are necessary in order to collect valid and meaningful pedestrian data, the majority of pedestrian counts are still short-duration, two-hour manual counts. The best practices listed below will help to broaden the variety of pedestrian counts conducted and enhance the quality and usefulness of the data collected:
Given that undercounting rates and resulting bias compensation factors are typically higher for pedestrian counts than with other modes, funding is needed for research that documents the error rates associated with various equipment types or develops broadly applicable bias compensation factors.
Automated data collection is necessary to inform comprehensive pedestrian plans and analyses. Many resources identify quality assurance procedures for automated motor vehicle count data that can also be applied to pedestrian data, but further work is needed to develop best practices that account for the unique nature of pedestrian data, including:
The TMG Chapter 7 provides a standard list of metadata. These are documented in detail in the station record description in TMG Section 7.9, as well as in the count record in TMG Section 7.10. Other data archives also give standard metadata. Below is a list of standard metadata (relevant TMG field names given in parenthesis).
To standardize pedestrian count data in a way that simplifies data collection and maximizes comparability with motor vehicle traffic monitoring practice, the following standard summary metrics are suggested:
In order for these metrics to become standard practice, more research and guidance are needed to create adjustment factors that will help practitioners create summary metrics based on counts from different locations, dates, and times.
Based on the information reviewed in this report, below are some practical recommendations for practitioners who seek to count pedestrians and monitor pedestrian travel patterns.
If you find that you cannot get counts but have access to other data sources (e.g., pedestrian pushbutton data), you may be able to develop suitable measures from those sources, but that is not addressed in this document.
| COUNTING PROGRAMS | |
|---|---|
| Literature Reviewed | Key Points |
| National Bicycle and Pedestrian Documentation Project, 2003 |
|
| Cottrell et al., 2003 |
|
| Schneider et al., 2005 |
|
| Baker et al., 2012 |
|
| TMG, 2013 |
|
| Lindsey et al., 2014 |
|
| Minge et al., 2015 |
|
| COUNT DURATION AND TIMING | |
|---|---|
Literature Reviewed |
Key Points |
NBPDP, 2003 |
|
Nordback et al., 2013 |
|
El Esawey, 2014 |
|
Hankey et al., 2014 |
|
| COUNT SITE SELECTION | |
|---|---|
Literature Reviewed |
Key Points |
NBPDP, 2003 |
|
TMG, 2013 |
|
NCHRP 797 |
|
Jackson et al., 2015 |
|
TECHNOLOGIES |
||||
|---|---|---|---|---|
Technology |
Reviewed Literature |
Advantages |
Disadvantages |
Key Results |
MANUAL COUNTS IN-FIELD These counts are performed manually in the field using data sheets, clickers or count boards. |
|
|
|
|
MANUAL COUNTS FROM VIDEO Counts are obtained from video footage manually using sheets, computer or a count board |
|
|
|
|
LASER SCANNERS These devices emit pulses and analyze the reflections of pulses to detect pedestrians |
|
|
|
|
AUTOMATED VIDEO COUNTS Algorithms that use computer vision techniques and visual pattern recognition |
|
|
|
|
PRESSURE OR ACOUSTIC PADS Pressure pads record changes in weight on the pad; acoustic pads detect the passage of energy waves through the ground |
|
|
|
|
PASSIVE INFRARED These devices detect and count pedestrians and bicyclists by detecting differences between the thermal energy emitted by people and the background |
|
|
|
|
ACTIVE INFRARED These devices use an emitter and a receiver located on opposite sides of a path or sidewalk, with a count being recorded when the beam is broken. |
|
|
|
|
|
COUNT ARCHIVE |
|
|---|---|
Literature Reviewed |
Key Points |
NBPDP, 2004 |
|
FHWA, 2013 |
|
Los Angeles County Clearinghouse |
|
DVRPC Pedestrian and Bicycle Counts |
|
Bike-Ped PORTAL |
|
|
COUNT QA/QC |
|
|---|---|
Literature Reviewed |
Key Points |
FHWA, 2013 |
|
Turner and Lasley, 2013 |
|
Ryus et al., 2014 |
|
Pedestrians may be counted in the field by observers using data collection sheets, clickers or count boards. In the last few years, smartphone applications have also emerged for manual pedestrian counts. Manual in-field counts are typically used to collect short-duration counts, and can yield very accurate information if the data collectors are well trained. They are often used to validate automated count data. The advantages with manual counts include the ability to gather additional information, such as gender and compliance with traffic signal displays. Manual counts do not involve any installation costs and are applicable to all sites and users.175 Disadvantages with manual counts include the inability to collect data over a longer time frame and the possibility of inaccuracies and biases in data collection, particularly if counters are not well trained.176 Data verification is also difficult with in-field manual counts, and it can be harder to conduct manual counts at locations with high pedestrian volumes.
Diogenes et al. compared manual counts where data was entered on sheets, manual counts that used clickers to record pedestrians, and manual counts from video. They found that manual counts using sheets or clickers underestimated pedestrian volumes by between eight and 25 percent.177 They also found that accuracy was worse during the beginning and end of the data collection period, which could perhaps be attributed to lack of familiarity in the beginning and fatigue at the end.
Manual counts can also be taken from video collected in the field. As with in-field counts, data from video-based counts can be entered using data collection sheets, clickers, count boards or smartphone applications. These types of counts are often used as ground truth in various studies or as a way to validate counts from other types of equipment.178 Manual counts from video are typically used only for short-duration counts as this is a labor-intensive way to collect data.179 Video-based manual counts have similar advantages to in-field counts, including the ability to gather additional information such as gender and compliance. The main advantage of using video compared to in-field counts is that video can be reviewed at staff’s convenience, and the footage can be sped up for low-volume areas or slowed down for high-volume locations, all of which can increase accuracy. The recorded data can be used for additional purposes. The disadvantages of video-based counts include installation time to set up the equipment and ensure that the equipment is working, susceptibility of the equipment to vandalism and theft, and the possibility of poor video footage.180
Diogenes et al. found that manual counts using video were more accurate than other forms of manual counts, as discussed above.181 No other studies evaluating the accuracy of manual counts (in-field or video) were found.
Pedestrian counts can be automatically generated from video footage using computer vision techniques and visual pattern recognition. This technology has been rapidly evolving in the last decade and, according to several webinar participants, is growing in popularity since it is not as labor-intensive as manual counting. Cameras are portable and can be used at multiple locations, but due to limitations on space for long-term installations this technology may be best suited for short-duration counts. The recorded data can also be used for other purposes such as facility evaluation and user behavior studies.
Various studies evaluating automated video counts have found errors ranging from five to 13 percent when counting pedestrians.182,183,184,185
Pedestrians and bicyclists can be detected by passive infrared devices, which measure the difference between background thermal energy and heat emitted by people passing in front of the counter.186 These devices are typically placed on the side of crosswalks or trails. They are portable, battery-powered, and relatively easy to install, which makes them well-suited for continuous counting of nonmotorized users. Limitations with this technology include the inability to distinguish between bicyclists and pedestrians, potential undercounting for groups of pedestrians due to occlusion, and inaccuracies on hotter days.187 To minimize occlusion, the TMG recommends placing passive and active infrared counters at constrained locations where pedestrians are more likely to walk single-file.188
Many studies found that passive infrared devices were prone to undercounting.189,190,191,192,193,194 NCHRP 797 tested two different passive infrared sensors and found undercounting rates between 3.1 and 16.7 percent.195 Schneider et al. found undercounting rates between one and 20 percent, with devices undercounting during both high and low volume conditions.196 Ozbay et al. also found undercounting rates with passive infrared devices ranging between 5.26 and 27.9 percent.197 Montufar et al. tested three types of automated pedestrian detectors – a passive infrared and stereovision curbside detector, a passive infrared curbside detector and a microwave detector in cold temperatures. 198 They found that the infrared device had the highest sensitivity (percentage of pedestrian crossings detected successfully) and lowest selectivity (percentage of actuations triggered by actual pedestrians instead of false actuations) among all the tested devices. Selectivity rates for all three devices were less than 50 percent.
Active infrared devices include an emitter and a receiver located on opposite sides of a path or sidewalk, and record a count when the when the beam between the emitter and receiver is broken.199 These devices offer similar advantages and disadvantages to passive infrared devices: they are portable and battery powered, but cannot distinguish between pedestrians and bicyclists and are prone to occlusion errors when a group of pedestrians crosses in front of the sensor. However, active infrared devices have a narrower detection zone than passive infrared sensors, and can be more challenging to install since both the transmitter and the receiver need to be mounted and aligned properly with a clear line of sight.200 Active infrared also has a higher risk of false positives due to objects such as vehicles, insects, and falling leaves.201 One advantage of active infrared compared to passive infrared is that they have less accuracy at high volumes, which means that correction factors can be applied to generate accurate results.202
Jones et al. found undercounting rates between 25 and 48 percent for pedestrians, with less accurate results at higher volumes.203 NCHRP 797 tested one active infrared device and found an undercounting rate of 9.1 percent, and that the rate of undercounting increased as volumes increased.204
As with active infrared, radio beam devices employ a transmitter and receiver placed on opposite sides of a path or trail and register a count when the beam between the two is broken.205 These devices are portable, easy to install, battery powered and can be used for continuous counts. It is possible to use devices with multiple frequencies to distinguish between pedestrians and bicyclists, but occlusion errors are a possibility with radio beam counters. Installation can be more challenging, since radio beam devices require posts or other fixed objects along both sides of a facility for mounting purposes.
There has been very limited research on radio beam technology. NCHRP 797 tested two different products, one that counted bicyclists and pedestrians on two separate frequencies and another that counted them in combination. The report found the Average Percent Deviation (APD) was 31.2 percent undercount for bicycles and 26.3 percent undercount for pedestrians for the product that counted the modes separately. For the combination product, the APD was obtained as 3.6 percent undercount.
Thermal cameras generate infrared images that capture body heat.206 Like other video counting technologies, they can potentially be used to collect data for manual or automated counts, but unlike traditional video cameras, they are not affected by changes in ambient light, so can be used to capture pedestrians at night. Although thermal cameras are available commercially, there haven’t been any academic studies reviewing the cameras’ ability to capture pedestrians.
No studies have tested the accuracy of thermal cameras in counting pedestrians, but during the interview process one vendor mentioned that these devices were being used in France to count pedestrians207.
Laser scanners emit pulses in many directions and analyze the reflections of the pulses to determine if bicyclists or pedestrians are present.208 These devices require an external power source and have primarily been used indoors. They cannot distinguish between bicyclists and pedestrians and are generally of two types – horizontal or vertical. Horizontal scanners require locations with no obstructions, whereas vertical scanners are mounted above the detection area.
Few studies have evaluated the accuracy of these devices. Bu et al. reported difficulty while counting with laser scanners in poor weather conditions.209
Pressure pads detect changes in weight when pedestrians step on the pad. Acoustic pads detect the passage of energy waves through the ground caused by pedestrians and bicyclists.210 Both of these devices require the counting element to be placed at or near the detector area, are battery-powered and are typically concealed under the ground, which makes them resistant to vandalism. While pressure pads can count and distinguish between pedestrians and bicyclists based on the pressure applied to the sensor, acoustic pads only count pedestrians.211 However, users must pass directly over the sensor in order to be counted. These devices are typically placed on unpaved trails and are used for continuous counting. They are also not feasible for locations with severe winters, where the ground freezes, nor for paved paths and trails.
No research studies have tested the accuracy of these devices.
Counting pedestrian traffic using Bluetooth and Wi-Fi detection is an emerging area of research. This is a surrogate measure because it does not count all pedestrians, but those who carry with them certain active, operating Bluetooth or Wi-Fi enabled devices, such as cell phones and laptops.212 Bluetooth or Wi-Fi detection can capture travel times by matching Media Access Control (MAC) addresses, which are unique identifiers used for Bluetooth or Wi-Fi enabled devices, across several readers. However, this technology cannot distinguish between bicyclists and pedestrians. Since this technology can only capture a small sample of the population, it is more applicable for discerning trends than conducting actual counts.
Malinovskiy et al. investigated the possibility of using Bluetooth readers to track pedestrians at two locations.213 They found that obtaining sufficient sample sizes was an issue.
Another potential technology from which pedestrian traffic counting data can be collected is pedestrian pushbutton actuations at signalized intersections. This approach is limited to areas where pedestrian pushbuttons are used for signal actuation. This is a surrogate measure because only one actuation per signal cycle is recorded per phase, irrespective of the number of crossing pedestrians. Therefore, it can be considered as a proxy for pedestrian demand activity at an intersection. However, studies show a correspondence with count volumes and the utility of pedestrian actuations as a measure of pedestrian activity at intersections).214,215 This approach can provide valuable information on pedestrian traffic activity levels in suburban areas where counts have not been conducted. Since existing infrastructure is used to collect these data, costs can be very low.
Kothuri et al. recorded pedestrian actuations at signalized intersections in Portland, OR to understand the pedestrian activity levels and trends. They found that pedestrian activity varied greatly by time of day.216 Figliozzi et al. observed a linear relationship (ratio of 1.2 pedestrians per actuation) between pedestrian phase actuations to the number of crossing pedestrians at an intersection.217
Having a table like is in the TMG would be helpful to see the technology and findings from each for a quick reference, this same reference may also then be included in the 2016 TMG Supplement.
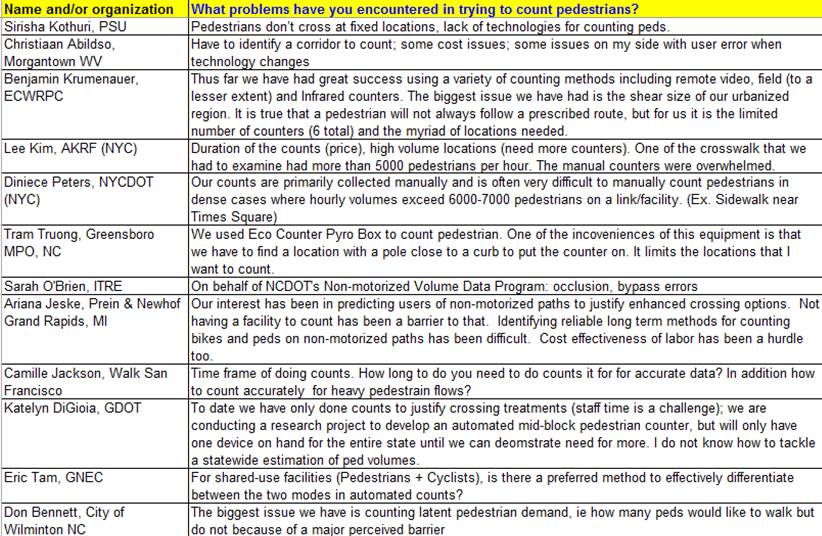
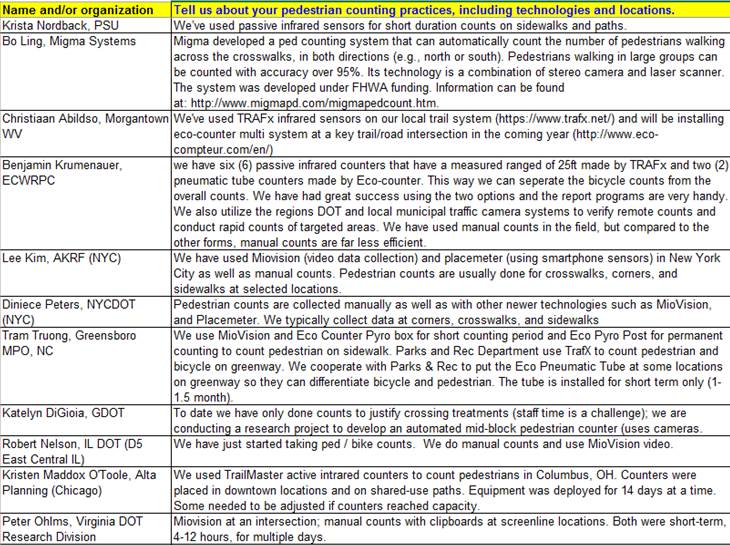
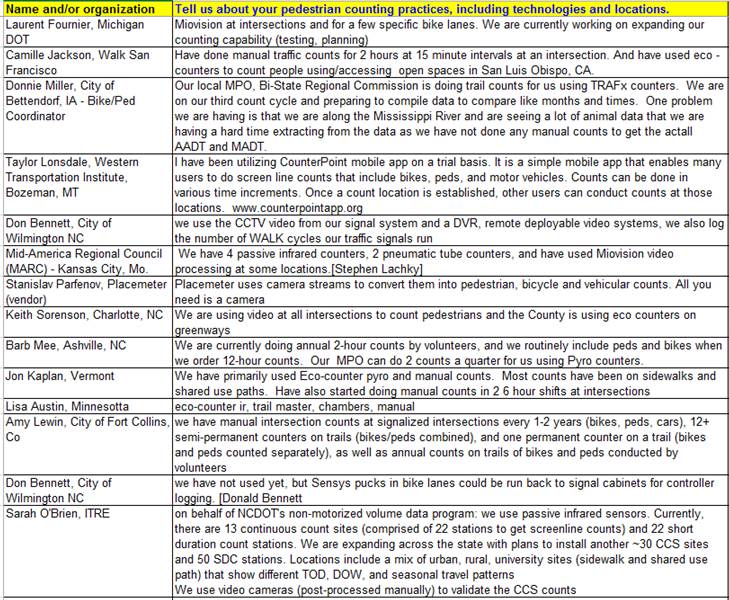
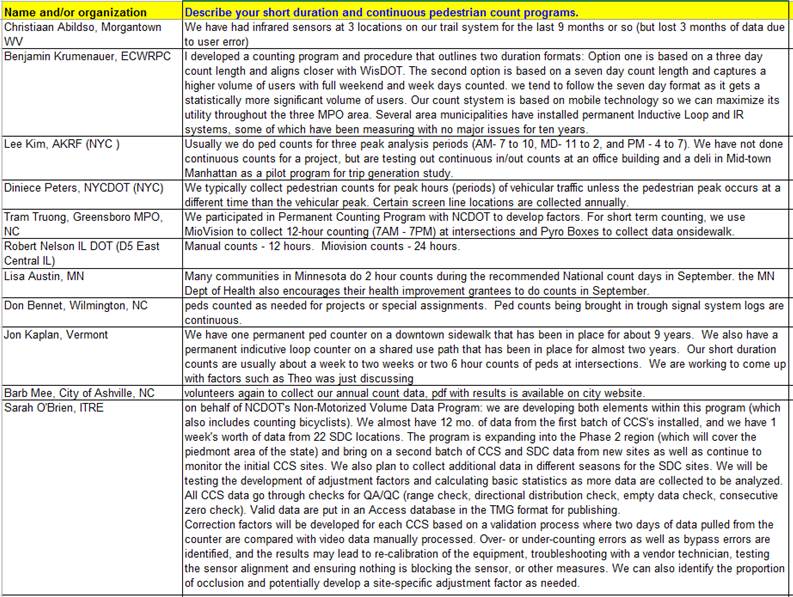
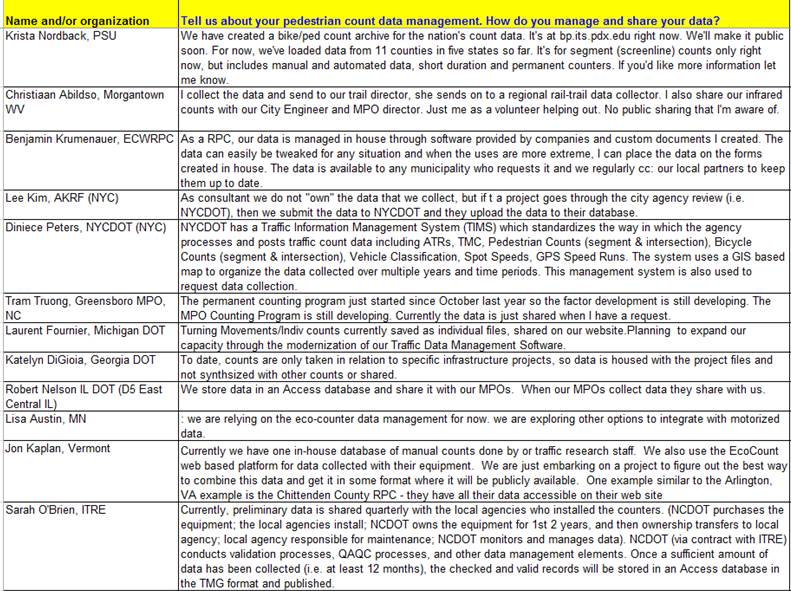
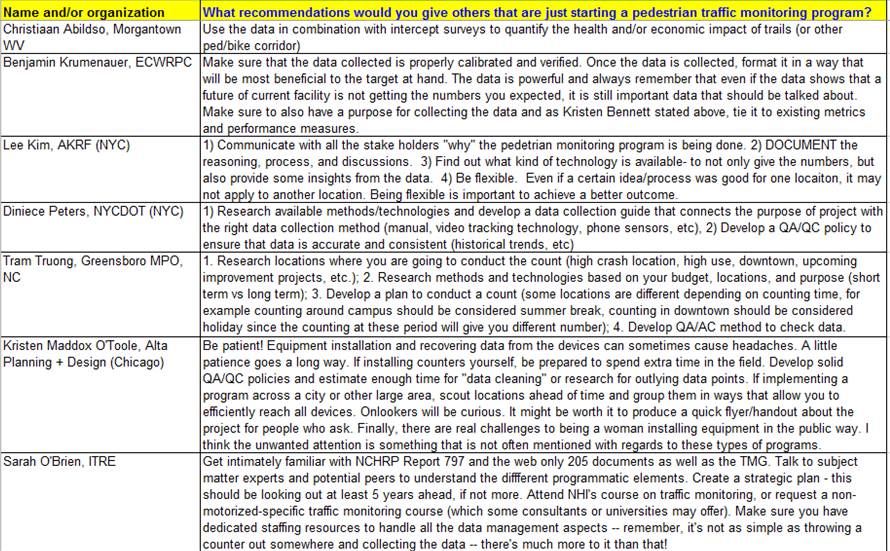
Dr. Robert Schneider, University of Wisconsin, Milwaukee
Dr. Greg Lindsey, University of Minnesota
Stanislav Parfenov, Placemeter
Michael Jones, Alta Planning and Design
Jean-Francois Rheault, Eco-Counter
David Patton, Arlington County, VA
Aylene McCallum, Downtown Denver Partnership
Lisa Austin, Minnesota Department of Transportation
Steve Abeyta, Colorado Department of Transportation
Kenneth Brubaker, Colorado Department of Transportation
Dr. Tracy Hadden Loh, Rails-to-Trails Conservancy
1 CFR 23 U.S.C. 303
2 Griffin, G., Nordback, K., Gotschi, T., Stolz, E., and S. Kothuri. Monitoring Bicyclist and Pedestrian Travel and Behavior Current Research and Practice. Transportation Research Circular E-C183, Transportation Research Board of the National Academies, Washington DC, March 2014. Accessed at http://onlinepubs.trb.org/onlinepubs/circulars/ec183.pdf
3 Ryus, P., Ferguson, E., Laustsen, K., Schneider, R., Proulx, F., Hull, T., and L. Miranda-Moreno. Guidebook on Pedestrian and Bicycle Volume Data Collection. National Highway Cooperative Research Program Report 797, Transportation Research Board of the National Academies, Washington DC, 2014. Accessed at http://onlinepubs.trb.org/onlinepubs/nchrp/nchrp_rpt_797.pdf
Errata for NCHRP 797 http://onlinepubs.trb.org/onlinepubs/nchrp/nchrp_rpt_797errata.pdf
Ryus, P., Proulx, F., Schneider, R., Hull, T. , and Miranda-Moreno, L. . "NCHRP Web-Only Document 205: Methods and Technologies for Pedestrian and Bicycle Volume Data Collection." 226. Washington, DC: National Cooperative Highway Research Program, 2015. Accessed at http://onlinepubs.trb.org/onlinepubs/nchrp/nchrp_w205.pdf
4 AMEC E&I, Inc., and Sprinkle Consulting, Inc. Pedestrian and Bicycle Data Collection. Final Report, December, 2011.
5 Alta Planning and Design and the Institute of Transportation Engineers. National Bicycle and Pedestrian Documentation Project, 2004. Accessed at http://bikepeddocumentation.org/
6 Baker, M., Jannett, P., Lee, A., and L. Mitchell. MnDOT Support for Monitoring Bicycle and Pedestrian Traffic. PA 8081 capstone project report. Humphrey School of Public Affairs, University of Minnesota, Minneapolis, 2012. Results are reported in Lindsey, G., Nordback, K., and M. Figliozzi. Institutionalizing Bicycle and Pedestrian Monitoring Programs in Three States: Progress and Challenges. Transportation Research Record: Journal of the Transportation Research Board, No. 2443, 2014, pp.134–142.
7 Lindsey, G., Nordback, K., and M. Figliozzi. Institutionalizing Bicycle and Pedestrian Monitoring Programs in Three States: Progress and Challenges. Transportation Research Record: Journal of the Transportation Research Board, No. 2443, 2014, pp.134–142.
8 Minge, E., Falero, C., Lindsey, G., and M. Petesch. Bicycle and Pedestrian Data Collection Manual-Draft. Minnesota Department of Transportation, Office of Transit, Bicycle/Pedestrian Section, July 2015
9 Schneider, R., Patten, R., and J. Toole. Case Study Analysis of Pedestrian and Bicycle Data Collection in U.S. Communities. Transportation Research Record: Journal of the Transportation Research Board, No. 1939, Transportation Research Board of the National Academies, Washington D.C., 2005, pp. 77-90.
10 Ibid.
11 Ibid.
12 Cottrell, W. and D. Pal. Evaluation of Pedestrian Data Needs and Collection Efforts. Transportation Research Record: Journal of the Transportation Research Board, No. 1828, 2003, pp.12-19.
13 FHWA 2013.
14 Ryus et al. 2014.
15 Alta Planning and Design et al. 2004.
16 FHWA 2013, pp.4-35.
17 Nordback, K., et al. “Estimating Annual Average Daily Bicyclists: Error and Accuracy.” Transportation Research Record: Journal of the Transportation Research Board, Vol. 2339. Transportation Research Board of the National Academies, Washington, D.C., 2013, pp. 90–97.
18 Hankey, S., Lindsey, G., and J. Marshall. Day-of-Year Scaling Factors and Design Considerations for Nonmotorized Traffic Monitoring Programs. Transportation Research Record: Journal of the Transportation Research Board, No. 2468, Transportation Research Board of the National Academies, Washington, D.C., 2014, pp. 64–73.
19 El Esawey, M. Estimation of Annual Average Daily Bicycle Traffic with Adjustment Factors. Transportation Research Record: Journal of the Transportation Research Board, No. 2443, Transportation Research Board of the National Academies, Washington, D.C., 2014, pp. 106–114.
20 FHWA 2013, pp.4-36.
21 Nordback et al. 2013.
22 Hankey et al. 2014, pp. 64–73.
23 El Esawey 2014.
24 FHWA 2013, pp.4-32, 4-33.
25 Jackson, K.N., Stolz, E., and C. Cunningham. Nonmotorized Site Selection Methods for Continuous and Short-Duration Volume Counting. Proceedings of the 94th Annual Meeting of the Transportation Research Board, Transportation Research Board of the National Academies, Washington, D.C., 2015.
26 Ibid.
27 FHWA 2013, pp.4-34.
28 Jackson et al. 2015.
29 Alta Planning and Design et al. 2004.
30 Ryus et al. 2014, pp.26.
31 Ibid., p.27.
32 Ibid., p.41.
33 Ibid., pp.75 – 98.
34 Ibid., p.76.
35 FHWA 2013, pp.4-8.
36 Diogenes, M., Greene-Roesel, R., Arnold, L., and D. Ragland. “Pedestrian Counting Methods at Intersections: A Comparative Study.” Transportation Research Record: Journal of the Transportation Research Board, Vol. 2002. Transportation Research Board of the National Academies, Washington, D.C., 2007, pp. 26–30.
37 Ryus et al. 2014, pp.78.
38 FHWA 2013, pp.4-8.
39 Diogenes et al. 2007, pp. 26–30.
40 Ryus et al. 2014, pp.80.
41 FHWA 2013, pp.4-7.
42 Ismail, K., Sayed, T., Saunier, N., and C. Lim. Automated Analysis of Pedestrian-Vehicle Conflicts using Video Data. Transportation Research Record: Journal of the Transportation Research Board, Vol. 2140. Transportation Research Board of the National Academies, Washington, D.C., 2009, pp. 44-54.
43 Li, S., Sayed, T., M. Zaki., Mori, G., Stefanus, F., Khanloo, B., and Saunier, N. Automated Collection of Pedestrian Data Through Computer Vision Techniques. Transportation Research Record: Journal of the Transportation Research Board, No. 2299, Transportation Research Board of the National Academies, Washington, D.C., 2012, pp. 121–127.
44 Zaki, M. and Sayed, T.. Automated Analysis of Pedestrians Nonconforming Behavior and Data Collection at an Urban Crossing. Transportation Research Record: Journal of the Transportation Research Board, No. 2443, Transportation Research Board of the National Academies, Washington, D.C., 2014, pp. 123–133.
45 Zangenehpour, S., Miranda-Moreno, L.F., and Saunier, N. Automated Classification Based on Video Data at Intersections with Heavy Pedestrian and Bicycle Traffic: Methodology and Application. Transportation Research Part
46 Ryus et al., pp.96-97.
47 FHWA 2013, pp.4-7, 4-8.
48 Bu, F., Greene-Roesel, R., Diogenes, M., and Ragland, D. Estimating Pedestrian Accident Exposure: Automated Pedestrian Counting Devices. Report, California PATH and Safe Transportation Research and Education Center, University of California, Berkeley, March 2007.
49 Schweizer, T. Methods for Counting Pedestrians. Paper Presented at Walk21-VI Everyday Walking Culture. The 6th International Conference on Walking in the 21st Century, Zurich, Switzerland, September 22-23, 2005.
50 Ryus et al. 2014, pp.87-91.
51 FHWA 2013, pp.4-7, 4-8.
52 Schneider R. J., Arnold, L. S., and Ragland, D. R. A Pilot Model for Estimating Pedestrian Intersection Crossing Volumes. Transportation Research Record: Journal of the Transportation Research Board, Vol. 2140. Transportation Research Board of the National Academies, Washington, D.C., pp. 13–26, 2009.
53 Schneider, R., Arnold, L. and Ragland, D. Methodology for Counting Pedestrians at Intersections: Use of Automated Counters to Extrapolate Weekly Volumes from Short Manual Counts. Transportation Research Record: Journal of the Transportation Research Board, No. 2140. Transportation Research Board of the National Academies, Washington, D.C., pp. 1–12, 2009.
54 Ozbay, K., Bartin, B., Yang, H., Walla, R., and Williams, R.Automatic Pedestrian Counter. Publication FHWA-NJ-2010-001. NJDOT, FHWA, New Jersey Department of Transportation, Federal Highway Administration, 2010.
55 Jones, M. G., Ryan, S., Donlon, J., Ledbetter, L., Ragland, D. and Arnold, L. Seamless Travel: Measuring Bicycle and Pedestrian Activity in San Diego County and Its Relationship to Land Use, Transportation, Safety, and Facility Type. PATH Research Report, Berkeley, March, 2010.
56 Montufar, J. and Foord, J. Field Evaluation of Automatic Pedestrian Detectors in Cold Temperatures. Transportation Research Record: Journal of the Transportation Research Board, No. 2264. Transportation Research Board of the National Academies, Washington, D.C., pp. 1–10, 2011.
57 Greene-Roesel, R., Diogenes, M.C., Ragland, D.R., and Lindau, L.A.. Effectiveness of a Commercially Available Automated Pedestrian Counting Device in Urban Environments: Comparison with Manual Counts. Presented at the 87th Annual Meeting of the Transportation Research Board 87th Annual Meeting, Transportation Research Board of the National Academies, Washington, D.C., 2008.
58 FHWA 2013 Appendix J.
59 Turner, S., and Lasley, P. “Quality Counts for Pedestrians and Bicyclists: Quality Assurance Procedures for Nonmotorized Traffic Count Data.” Transportation Research Record: Journal of the Transportation Research Board, Vol. 2339. Transportation Research Board of the National Academies, Washington, D.C., 2013, pp. 57–67.
60 Ryus et al. 2014, pp.53, pp.57-74.
61 Southern California Association of Governments and University of California Luskin School of Public Affairs. Bike Count Data Clearinghouse. Accessed at http://www.bikecounts.luskin.ucla.edu/
62 Delaware Valley Regional Planning Commission. DVRPC Pedestrian and Bicycle Counts. Accessed at http://www.dvrpc.org/webmaps/pedbikecounts/
63 Arlington County, Virginia. Bicycle and Pedestrian Counters. Accessed at http://www.bikearlington.com/pages/biking-in-arlington/counting-bikes-to-plan-for-bikes/counter-dashboard/
64 Nordback, K., Tufte, K., Harvey, M., McNeil, N., Stolz, E. and Liu, J.. Creating a National Nonmotorized Traffic Count Archive: Process and Progress. Proceedings of the 94th Annual Meeting of the Transportation Research Board, Transportation Research Board of the National Academies, Washington D.C., 2015.
65 Malinovskiy, Y., Saunier, N., and Y. Wang. Analysis of Pedestrian Travel with Static Bluetooth Sensors. In Transportation Research Record: Journal of the Transportation Research Board, No. 2299, Transportation research Board of the National Academies, Washington DC, 2012, pp.137-149.
66 Lesani, A., Miranda-Moreno, L. Development and Testing of a Real-Time Wi-Fi Bluetooth System for Pedestrian Network Monitoring and Data Extrapolation. (95th Annual Meeting of the Transportation Research Board, Forthcoming)
67 Kothuri, S, Reynolds, T., Monsere, C. and Koonce, P. Preliminary Development of Methods to Automatically Gather Bicycle Counts and Pedestrian Delay at Signalized Intersections. Proceedings of the 91st Annual Meeting of the Transportation Research Board, Washington DC, 2012.
68 FHWA 2013, pp.4-5 to 4-20.
69 Ryus et al. 2014, pp.75 – 99.
70 Ibid. pp.76-78
71 FHWA 2013, pp.4-8
72 Ryus et al. 2014, 78-80.
73 FHWA 2013, pp.4-8.
74 Ryus et al. 2014, pp.80-81.
75 FHWA 2013, pp.4-8.
76 Ryus et al. 2014, pp.87-89.
77 FHWA 2013, pp.4-8, 4-13.
78 Ryus et al. 2014, 89-91.
79 FHWA 2013, pp.4-8, 4-13.
80 Ryus et al. 2014, pp.92-95.
81 Ryus et al. 2014, pp.96-97.
82 FHWA 2013, pp.4-7, 4-17.
83 Ryus et al. 2014, p.95.
84 Ibid., pp.44-45.
85 Ibid., pp.48-50.
86 Ibid., pp.50-51.
87 Ibid., p.52.
88 Ibid., pp.39-41.
89 FHWA, Manual on Uniform Traffic Control Devices (MUTCD) for Streets and Highways. Washington, DC, 2009 with revisions 1 & 2, P 1A.13.
90 Ibid. p.1A.13.
91 Ibid. p.1A.13.
92 WSDOT, Pedestrian Facilities Guidebook, Incorporating Pedestrians into Washington’s Transportation System by OTAK, 1997, p 224. Accessed at http://www.wsdot.wa.gov/publications/manuals/fulltext/m0000/pedfacgb.pdf
93 Federal Highway Administration. Traffic Monitoring Guide. Washington, DC, U.S. Department of Transportation, 2013, p. 7-83.
94 Ibid. p.7-83.
95 Ibid. p.4-2.
96 Ibid. p.4-32.
97 Ibid. pp. 1-10 and 4-17.
98 Telephone Interview with Robert Schneider, University of Wisconsin at Milwaukee, by Krista Nordback and Sirisha Kothuri, August 17, 2015.
99 Telephone Interview with Stanislav Parfenov, Placemeter, by Krista Nordback, September 1, 2015.
100 Kothuri et al. 2012.
101 Nordback, K., Kothuri, S., Phillips, T., Gorecki, C., and Figliozzi, M. "Accuracy of Bicycle Counting with Pneumatic Tubes in Oregon." Transportation Research Record, (Forthcoming).
102 Telephone Interview with Greg Lindsey, University of Minnesota, by Krista Nordback and Sirisha Kothuri, August 25, 2015.
103 Telephone Interview with Luis Miranda-Moreno, McGill University in Montreal, Canada, by Krista Nordback and Sirisha Kothuri, September 1, 2015.
104 Telephone Interview with Robert Schneider, University of Wisconsin at Milwaukee, by Krista Nordback and Sirisha Kothuri, August 17, 2015.
105Determining Wildlife Use of Wildlife Crossing Structures Under Different Scenarios, 2012, p iii. Accessed at www.udot.utah.gov/main/uconowner.gf?n=10377400611320625
106 Aultman-Hall, L., Lane, D., and Lambert, R.. Assessing Impact of Weather and Season on Pedestrian Traffic Volumes. Transportation Research Record: Journal of the Transportation Research Board, No. 2140. Transportation Research Board of the National Academies, Washington, D.C., 2009, pp.35-43.
107 Attaset, V., Schneider, R., Arnold, L. and Ragland, D. Effects of Weather Variables on Pedestrian Volumes in Alameda County, California. UC Berkeley Safe Transportation Research and Education Center, 2010. A http://escholarship.org/uc/item/3zn9f4cr.
108 Ryus et al. 2014 pp. 57-74.
109 Federal Highway Administration. Traffic Monitoring Guide. Publication FHWA PL-13-015. U.S. Department of Transportation, Washington, D.C., September 2013.
110 Ryus, P., Ferguson, E., Laustsen, K., Schneider, R., Proulx, F., Hull, T., and Miranda-Moreno, L.. Guidebook on Pedestrian and Bicycle Volume Data Collection. National Highway Cooperative Research Program Report 797, Transportation Research Board of the National Academies, Washington DC, 2014.
111 FHWA 2013, p. 4-35.
112 Ibid., p. 4-35.
113 Ibid., p. 4-35.
114 Ibid., p. 4-35.
115 Ibid., pp. 4-36 – 4-37.
116 Ibid., p. 4-37.
117 Ibid., p. 3-12.
118 Ibid., p. 4-32.
119 Ryus et al. 2014, pp. 30-31.
120 Ibid., p. 31.
121 Ibid., p. 32.
122 Ibid., p. 33.
123 Ibid., p. 67.
124 Alta Planning + Design. National Bicycle and Pedestrian Documentation Project, accessed November 23, 2015. Accessed at http://bikepeddocumentation.org.
125 Nordback, K., Marshall, W., Janson, B., and Stolz, E. Estimating Annual Average Daily Bicyclists: Error and Accuracy. Transportation Research Record: Journal of the Transportation Research Board, No. 2339. Transportation Research Board of the National Academies, Washington, D.C., 2013, pp. 90–97.
126 Hankey, S., Lindsey, G., and Marshall, J. Day-of-Year Scaling Factors and Design Considerations for Nonmotorized Traffic Monitoring Programs. Transportation Research Record: Journal of the Transportation Research Board, No. 2468. Transportation Research Board of the National Academies, Washington, D.C., 2014, pp. 64–73.
127 Nosal, T., Miranda-Moreno, L., and Krstulic, Z. Incorporating Weather: A Comparative Analysis of Average Annual Daily Bicyclist Estimation Methods. Transportation Research Record: Journal of the Transportation Research Board, No. 2468. Transportation Research Board of the National Academies, Washington, D.C., 2014, pp. 100-110.
128 FHWA 2013, p. 4-32.
129 Ibid., p.2-7.
130 Ibid., p.1-24.
131 Ibid., p.4-7.
132 Ibid., p.2-10.
133 Ibid., p.2-10.
134 Ibid., p.E-16.
135 National Highway Institute, Traffic Monitoring Programs: Guidance and Procedures. Accessed at
http://www.nhi.fhwa.dot.gov/training/course_search.aspx?sf=0&course_no=151050
136 National Highway Institute, Traffic Monitoring Programs: Guidance and Procedures. Course: FHWA-NHI-151050.Publication FHWA-NHI-14-004. 2014. Lesson 10. p.10-4.
137 Ibid., p.10-13.
138 Ibid., pp.10-6 to 10-13.
139 Turner, S. and Lasley, P. Quality Counts for Pedestrians and Bicyclists: Quality Assurance Procedures for Nonmotorized Traffic Count Data. 92nd Annual Meeting of the Transportation Research Board. Washington, D.C., Transportation Research Board of the National Academies, 2013.
140 Ryus, P., Ferguson, E., Laustsen, K., Schneider, R., Proulx, F. Hull, T. and Miranda-Moreno, L.. NCHRP 797 Guidebook on Pedestrian and Bicycle Volume Data Collection. Washington, DC: NCHRP, 2015.
141 Minge, E., Falero, C., Lindsey, G., and Petesch, M. Bicycle and Pedestrian Data Collection Manual - Draft. Minneapolis, MN: Minnesota Department of Transportation, 2015.
142 Diogenes, M., Greene-Roesel, R., Arnold, L., and Ragland, D. "Pedestrian Counting Methods at Intersections: A Comparative Study." Transportation Research Record: Journal of the Transportation Research Board 2007, pp 26-30.
143 Federal Highway Administration. Traffic Monitoring Guide. Washington, DC, U.S. Department of Transportation, 2013, pp 4-35.
144 Personal communication (email) from Craig Moore, city of Seattle, to Krista Nordback, June 30, 2015.
145 Telephone Interview with Greg Lindsey, University of Minnesota, by Krista Nordback and Sirisha Kothuri, August 25, 2015.
146 Telephone Interview with Ken Brubaker, Colorado Department of Transportation by Sirisha Kothuri, October 20, 2015.
147 Personal communication via email from Sarah Worth O’Brian, Institute for Transportation Research and Education at North Carolina State University, to Krista Nordback, February 17, 2016.
148 Personal communication from Joshua Roll, Lance Council of Governments, to Krista Nordback, June 26, 2015.
149 Ryus, P., Ferguson, E., et al. NCHRP 797 Guidebook on Pedestrian and Bicycle Volume Data Collection. Washington, DC, NCHRP, 2015.
150 Federal Highway Administration. Traffic Monitoring Guide. Washington, DC, U.S. Department of Transportation, 2013, p.ES-1.
151 Proulx, F. R., Zhang, Y. P., et al. A Database for Active Transportation Infrastructure and Volume, 2014.
152 Cascade Bicycle Club. "Washington State Bicycle and Pedestrian Documentation Project 2012: A Summary Report to the Washington State Department of Transportation," 2013.
153 Lindsey, G., Hankey, S., Wang, X., and Chen, J. The Minnesota Bicycle and Pedestrian Counting Initiative: Methodologies for Nonmotorized Traffic Monitoring, 2013.
154 FHWA 2013, p.2-10.
155 http://www.dvrpc.org/webmaps/pedbikecounts/
156 http://www.bikearlington.com/pages/biking-in-arlington/counting-bikes-to-plan-for-bikes/counter-dashboard/
158 http://www.bikecounts.luskin.ucla.edu/
159 "National Bicycle and Pedestrian Documentation Project", Alta Planning and Design and Institute of Transportation Engineers, Accessed at bikepeddocumentation.org.
160 Hankey, S., Lindsey, G. and Marshall, J.. "Day-of-Year Scaling Factors and Design Considerations for Nonmotorized Traffic Monitoring Programs." Transportation Research Record: Journal of the Transportation Research Board 2468, 2014; Thomas, N., Miranda-Moreno, L, and Krstulic, Zlatko. "Incorporating Weather: Comparative Analysis of Annual Average Daily Bicyclist Traffic Estimation Methods." Transportation Research Record: Journal of the Transportation Research Board 2468, 2014; Ryus, P., Ferguson, E., Laustsen, K. Schneider, R., Proulx, F., Hull, T., and Miranda-Moreno, L., NCHRP 797 Guidebook on Pedestrian and Bicycle Volume Data Collection, Washington, DC: NCHRP, 2015.
161 Schneider, R., Henry, T., Mitman, M., Stonehill, L. and Koehler, J. "Development and Application of the San Francisco Pedestrian Intersection Volume Model." Transportation Research Record, (2012); Hankey, S., Lindsey, G., and Marshall, J. “Day-of-Year Scaling Factors and Design Considerations for Nonmotorized Traffic Monitoring Programs." Transportation Research Record: Journal of the Transportation Research Board 2468, 2014.
162 Telephone Interview with Robert Schneider, University of Wisconsin Milwaukee, by Krista Nordback and Sirisha Kothuri, August 17, 2015.
163 Strauss, J., Miranda-Moreno, L., and Morency, P. "Mapping Cyclist Activity and Injury Risk in a Network Combining Smartphone GPS Data and Bicycle Counts." 17p, 2015.
164 Telephone Interview with Luis Miranda-Moreno, McGill University in Montreal, Canada, by Krista Nordback and Sirisha Kothuri, September 1, 2015.
165 Nordback, K., Sellinger, M. Methods for Estimating Bicycling and Walking in Washington State. Olympia, WA: Washington State Department of Transportation; 2014 May 2014.
166 National Bicycle and Pedestrian Documentation Project. "Fact Sheet and Status Report." Retrieved July 22, 2014, 2014, Accessed at http://bikepeddocumentation.org/downloads/.
167 Data provided by the City and County of Denver, Colorado.
168 FHWA 2013, pp.7-70 to 7-87.
169 FHWA 2013, Section 7.9, pp.7-70 to 7-79.
170 2010 FIPS Codes for Counties and County Equivalent Entities. Accessed at https://www.census.gov/geo/reference/codes/cou.html
171 The name of this field is to be changed to “Movement Direction” in future versions of the TMG.
172 This table is labeled “Direction of Travel Codes,” but actually refers to direction of route.
173 FHWA 2013, p.7-77.
174 Federal Highway Administration. Highway Performance Monitoring System Field Manual, U.S. Department of Transportation, 2014, p. 4-46. Accessed at https://www.fhwa.dot.gov/policyinformation/hpms/fieldmanual/.
175 Ibid., p.76.
176 FHWA 2013, p.4-8.
177 Diogenes, M., Greene-Roesel, R., Arnold, L., and Ragland, D. “Pedestrian Counting Methods at Intersections: A Comparative Study.” Transportation Research Record: Journal of the Transportation Research Board, Vol. 2002. Transportation Research Board of the National Academies, Washington, D.C., pp. 26–30, 2007.
178 FHWA 2013, pp.4-8.
179 Federal Highway Administration. Traffic Monitoring Guide. Publication FHWA PL-13-015. U.S. Department of Transportation, Washington, D.C., April 2013, p.4-2.
180 Ryus et al. 2014, p.79.
181 Diogenes et al. 2007.
182 Li, S., Sayed, T., Zaki, M., Mori, G., Stefanus, F., Khanloo, B., and Saunier, N. Automated Collection of Pedestrian Data Through Computer Vision Techniques. Transportation Research Record: Journal of the Transportation Research Board, No. 2299, Transportation Research Board of the National Academies, Washington, D.C., 2012, pp. 121–127.
183 Ismail, K., Sayed, T., Saunier, N., and C. Lim. Automated Analysis of Pedestrian-Vehicle Conflicts using Video Data. Transportation Research Record: Journal of the Transportation Research Board, Vol. 2140. Transportation Research Board of the National Academies, Washington, D.C., 2009, pp. 44-54.
184 Zaki, M. and Sayed, T. Automated Analysis of Pedestrians Nonconforming Behavior and Data Collection at an Urban Crossing. Transportation Research Record: Journal of the Transportation Research Board, No. 2443, Transportation Research Board of the National Academies, Washington, D.C., 2014, pp. 123–133.
185 Zangenehpour, S., Miranda-Moreno, L.F., and Saunier, N. Automated Classification Based on Video Data at Intersections with Heavy Pedestrian and Bicycle Traffic: Methodology and Application. Transportation Research Part C: Emerging Technologies. Vol. 56, pp. 161-176, 2015.
186 Ryus et al. 2014, pp.87.
187 FHWA 2013, pp.4-8.
188 Federal Highway Administration. Traffic Monitoring Guide. Publication FHWA PL-13-015. U.S. Department of Transportation, Washington, D.C., April 2013, p.4-13.
189 Greene-Roesel, R., Diogenes, M.C., Ragland, D.R., and Lindau, L.A. Effectiveness of a Commercially Available Automated Pedestrian Counting Device in Urban Environments: Comparison with Manual Counts. Presented at the 87th Annual Meeting of the Transportation Research Board 87th Annual Meeting, Transportation Research Board of the National Academies, Washington, D.C., 2008.
190 Schneider, R., Arnold, L., and Ragland, D. Methodology for Counting Pedestrians at Intersections: Use of Automated Counters to Extrapolate Weekly Volumes from Short Manual Counts. Transportation Research Record: Journal of the Transportation Research Board, No. 2140. Transportation Research Board of the National Academies, Washington, D.C., pp. 1–12, 2009.
191 Ozbay, K., Bartin, B., Yang, H., Walla, R. and Williams, R.Automatic Pedestrian Counter. Publication FHWA-NJ-2010-001. NJDOT, FHWA, New Jersey Department of Transportation, Federal Highway Administration, 2010.
192 Jones, M. G., Ryan, S., Donlon, J., Ledbetter, L., Ragland, D. and Arnold, L. Seamless Travel: Measuring Bicycle and Pedestrian Activity in San Diego County and Its Relationship to Land Use, Transportation, Safety, and Facility Type. PATH Research Report, Berkeley, March, 2010.
193 Montufar, J. and Foord, J. Field Evaluation of Automatic Pedestrian Detectors in Cold Temperatures. Transportation Research Record: Journal of the Transportation Research Board, No. 2264. Transportation Research Board of the National Academies, Washington, D.C., pp. 1–10, 2011.
194 Ryus et al. 2014, p.88.
195 Ibid., p.88.
196 Schneider et al. 2009.
197 Ozbay et al. 2010
198 Montufar et al. 2011.
199 FHWA 2013, p.4-13.
200 Ibid., p.4-13.
201 Ryus et al. 2014, p.90.
202 Ryus et al. 2014, p.90.
203 Jones et al. 2010.
204 Ryus et al. 2014, p.90.
205 Ibid., pp.92-95.
206 Ibid., p.95.
207 Telephone Interview with Jean-Francois Rheault, Eco-Counter, by Sirisha Kothuri, September 14, 2015.
208 Ryus et al. 2014, pp.96.
209 Bu, F., Greene-Roesel, R., Diogenes, M., and Ragland, D. Estimating Pedestrian Accident Exposure: Automated Pedestrian Counting Devices. Report, California PATH and Safe Transportation Research and Education Center, University of California, Berkeley, March 2007.
210 FHWA 2013, p.4-17.
211 Ryus et al. 2014, pp.96-97.
212 FHWA 2013, p.4-20.
213 Malinovskiy et al. 2012.
214 Figliozzi, M., Monsere, C., Nordback, K., Johnson, P., and Blanc, B. Design and Implementation of Pedestrian and Bicycle-Specific Data Collection Method in Oregon. Portland, Oregon: Portland State University, 2014, p.67.
215 Kothuri et al. 2012.
216 Ibid 2012.
217 Figliozzi, M., Monsere, C., Nordback, K., Johnson, P. and Blanc, B. Design and Implementation of Pedestrian and Bicycle-Specific Data Collection Methods in Oregon, Pilot Study Report. Oregon Department of Transportation, 2014. p.24.
FHWA-HPL-160-26

