U.S. Department of Transportation
Federal Highway Administration
1200 New Jersey Avenue, SE
Washington, DC 20590
202-366-4000
PDF Version (1.44 MB)
PDF files can be viewed with the Acrobat® Reader®
TASK 2 - ASSESSMENT
Contract No. DTFH61-11-F-00031
December 9, 2011
Prepared by
AMEC E&I, Inc.
Sprinkle Consulting, Inc.
For:
Federal Highway Administration, HPPI-30
Table of Contents
APPENDIX A – LITERATURE REVIEW
APPENDIX C – WEBINAR ATTENDEES
APPENDIX D – WEBINAR POLL RESULTS:
APPENDIX E – SUMMARY OF DISCUSSIONS WITH PRACTITIONERS:
LIST OF TABLES
Table 1. Existing Technology Options and Implementation Implications
Table 2. Pedestrian Data Record Field Options
Table 3. Bicycle Data Record Data Field Options
Table 4. Attendance Statistics
Table 5. States Represented at Pedestrian and Bicycle Data Collection Webinars
Table 6. MPOs Represented at Pedestrian and Bicycle Data Collection Webinars
Table 7. Other Organizations Represented at Pedestrian and Bicycle Data Collection Webinars
Table 8. Individual Discussion Participants
Table 9. Practitioners and Principal Topics
LIST OF FIGURES
Figure 1. Sample On-line Statistics Output - Colorado DOT
Figure 2. Initial Contact Note
Figure 3. Final Webinar Invitation (Part 1)
Figure 4. Final Webinar Invitation (Part 2)
This document contains the results of a literature review and series of stakeholder conversations via webinar and individual calls undertaken for DTFH61-11-F-00031, "Pedestrian and Bicycle Data Collection." This document contains two sections:
(1) Pedestrian Data Collection, and
(2) Bicycle Data Collection.
Each section contains a summary of the state-of-the-practice as it existed in Fall 2011 based on available literature and practitioner input.
The literature review focused on papers written in English. The review emphasized research conducted during the past decade to ensure that emerging technologies and methods were properly identified. Included in the search was literature discussing how various counting programs are conducted by local governments, metropolitan planning organizations (MPOs), state Departments of transportation (DOTs), and national and international transportation agencies.
A presentation containing information on both pedestrian and bicycle data collection practices was disseminated via webinar. Questions aimed at documenting current practice from the practitioners' viewpoint were included. The webinar was conducted four times. Twenty-five state agencies, eight planning agencies and twenty-one other entities active in collecting, using and or analyzing pedestrian and or bicycle data participated. Subsequent to the webinars, in-depth conversations were held with eight individuals identified as being heavily involved in the collection and or use of pedestrian and bicycle data.
The top two reasons for collecting pedestrian counts are
(1) Safety analyses, and
(2) Project specific needs (most commonly before and after studies).
The two project specific topics which received nearly the same number of votes were: project design and evaluation with before and after studies ranked slightly higher than design. These are the same reasons, along with project selection, that are anticipated to need pedestrian data in the future. There are no generally accepted sampling or factoring processes. The data are typically stored in project specific formats. Pedestrian volumes have been documented to vary by both time of day and day of week. Equipment for counting pedestrians is capable of working under all weather conditions and in both on-road and off-road locations. An area of needed equipment improvement is better identification of numbers of individuals when in groups.
The top two reasons for collecting bicycle counts are:
(1) Project evaluation (before and after studies), and
(2) Safety analyses.
Other project specific uses (selection and design) both ranked lower than safety analyses. These are also anticipated to be the principal future needs (and ranking) for bicycle counts. There are no generally accepted sampling or factoring processes. Bicycle volumes have been documented to vary by weather, route conditions, day of week and time of day. Equipment for counting bicycles is capable of collecting information under all weather conditions and in both on-road and off-road locations. Areas of needed equipment improvement include the ability to sort out clusters of bicyclists and to capture composite material frames. Bicycles made from composite materials (primarily carbon fiber) are not detectable by inductive loops, a common type of bicycle count technology.
From the limited sample of detailed discussions with researchers and practitioners several broad conclusions and recommendations were drawn. These include the following:
Non-motorized (i.e., bicycle and pedestrian) travel monitoring has become an important element in numerous agencies' planning efforts. However, there is no standardized technology for conducting counts. Most bicycle and pedestrian monitoring programs use periodic manual counts. Continuous monitoring programs are becoming more commonplace with infrared counters being the most popular technology, but video and laser counting technology appear to be promising. Pneumatic tubes and inductive loops, while not practical for pedestrian traffic, have been used effectively on bicycle facilities. Each of these methods has its best applications for given specific operational, geometric, and weather-related factors. Information collected during the course of this project is summarized in Table 1. However, limited guidance is currently available to agencies on best practices to implement a non-motorized counting program. Widely available documents include the following:
Neither of these two documents contains more than a handful of sentences addressing count collection, utilization or storage. Updates are underway to the AASHTO pedestrian guide that are expected to result in more information on creating pedestrian counting programs.
This project was conducted to provide a summary of the state-of-the-practice for counting programs which collect data on non-motorized travel. The methods, equipment, factoring, storage, and reporting were all of interest. The first task of the project was a literature review. The material resulting from the literature review was used to develop a set of webinars, which functioned as a two-way exchange of information. The results of the literature review were presented during the webinars. Unpublished information on current practice and activities was requested via a series of polls as the webinar proceeded. In addition, discussions with eight individuals active in various aspects of pedestrian and or bicycle data collection have been documented in this report. The summary of both activities will support the current Traffic Monitoring Guide (TMG) update, including potentially suggesting record formats which could be adopted nationwide to simplify data exchange between organizations.
The literature review began with the identification and prioritization of sources including the Pedestrian and Bicycle Information Center (PBIC) online libraries, TRIS, ITRD (the database of the OECD's Joint Transportation Research Center), the ITE Journal, the APTA Journal and the TRR database. The literature search focused on papers written in English, but looked at both U.S. and foreign practices. The review also emphasized, but was not limited to, research from the past decade to ensure that emerging technologies and methods were properly identified. A second phase of the literature review looked at implementing jurisdictions (local governments, MPOs, state DOTs, and national transportation agencies) for application of the techniques. The literature review is included as Appendix A – Literature Review in this report.
To gather additional information, a webinar, repeated four times, and a series of discussions with practitioners were conducted. The webinar had both targeted attendees from states and metropolitan planning organizations (MPOs) and a generally broadcast invitation to the transportation community. The list of practitioners was developed based on personal contacts, FHWA input and the sources found in the Task 1 literature review.
The webinars were formulated to both provide information on the state-of-the-practice to participants and to obtain information on their experience. A set of slides summarizing the literature review, focusing on both practice and gaps, was developed for presentation during the webinar. A set of questions to accompany the webinar focusing on who the participants were, their thoughts on current and anticipated uses, and their experience (with equipment), data processing practices and data sharing by means of a commonly accepted record format was created. The slides and the question list were available for download by all participants via the library on the webinar site. The materials were also forwarded by e-mail to individuals who requested them. The materials are included in this report as Appendix B – Webinar Content.
This project was intended to get participation from all 50 states and at least 10 Metropolitan planning organizations (MPOs.) At least one contact was identified in all fifty states, the District of Columbia, and Puerto Rico, with invitations accepted by forty-one states and the District of Columbia. Twenty-four states and the District of Columbia actually had one or more personnel attend. Appendix C – Webinar Attendees discusses participation and the invitation process.
During the course of the four webinars, data were collected in three formats: screenshots of poll results as broadcasted during the webinars, CSV files downloaded from the software used for polling, and answers provided via the chat box. All three data forms were combined to provide the summary of results for each question. The details of the analysis are included as Appendix D – Webinar Poll Results.
Following the four webinars a dozen individuals were contacted and their input solicited for the project.Appendix E – Follow up Areas and Appendix F – Summary of Discussions with Practitioners provide details on the questions which framed each discussion and the results of the discussions with the eight practitioners who participated.
One of the outcomes of the project was identifying the types of equipment currently available for automated data collection and potential advantages, disadvantages and potential error rates. This information is summarized in Table 1. The "Data Collection Equipment and Technology" sections include additional information and detail. The error sources are technology specific and are in addition to the failure to follow good practice in installation, validation and maintenance of equipment.
Table 1. Existing Technology Options and Implementation Implications
| Technology | Data Type | Advantages | Cautions | Error Source and or Reported Range |
|---|---|---|---|---|
|
Manual Counts |
Bicycle & Pedestrian |
Minimal equipment needs; Accuracy (assuming proper training and supervision); Ability to gather extra user data |
High labor cost; Not suitable for long-term/permanent counts; Inability to verify data |
Observer inattention; Ulterior motives |
|
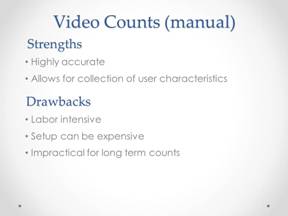
Video Counts (Manual) |
Bicycle & Pedestrian |
High accuracy; Verifiable data |
Equipment acquisition, installation, and maintenance costs; Not suited for low-light conditions |
Equipment malfunction; Improper vantage points; 92-98% accuracy |
|
Computer Visioning |
Bicycle & Pedestrian |
Data verification; Automated processes; Ideal for crowded environments |
Development complexity; Non-standard and non-transferable approaches |
Visual occlusion; 85-100% accuracy |
|
Active Infrared |
Bicycle & Pedestrian |
Portability; Relatively low cost |
Subject to interference in outdoor settings |
False positives from unintended objects |
|
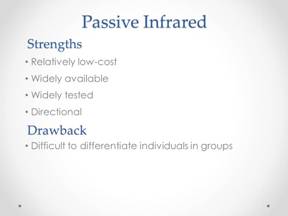
Passive Infrared |
Bicycle & Pedestrian |
Widely available; Thoroughly tested; Relatively low cost |
Tendency to undercount groups or side-by-side travelers |
Side-by-side or group travel; 72-98% accuracy |
|
Piezometric Pads |
Pedestrian (strips for bicycle mode) |
Permanent; Low post-installation cost |
High installation cost |
Nearly stationary pedestrians |
|
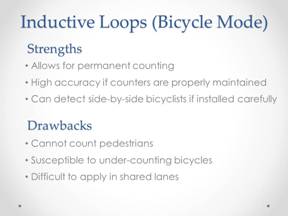
Inductive Loops |
Bicycle |
Permanent |
Cannot count pedestrians; Difficulty detecting some bicycle types; Difficult to apply in shared lane environments |
Undercounting of bicyclists that do not conduct electricity; False positives from motor vehicles; Degradation over time; 83-98% accuracy |
|
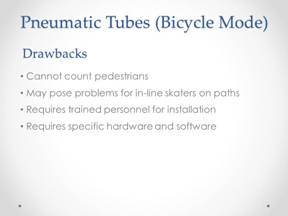
Pneumatic Tubes |
Bicycle |
Readily available devices; Familiar data formats |
Cannot count pedestrians; safety hazard for some facility users |
Low-speed travel; 73-100% accuracy |
Several broad conclusions can be drawn from the limited sample of detailed discussions with researchers and practitioners. These include the following:
Based on the information available through this project, the following recommendations are made:
This project focused on continuous count practices. However, the majority of the experience claimed by the webinar participants was in the area of manual counts. For those who used automated methods, the most common ones were manual reduction of video and either active or passive infrared sensors. Details on experience can be found in APPENDIX D – WEBINAR POLL RESULTS -
Equipment Experience:
Question 8 - Pedestrian count methods used:
Common impact sensors such as loops and tubes are not suitable for pedestrian counting. The only identified impact sensor for pedestrian data collection was the piezometric pad. Use of this device was reported by less than five percent of the participants.
Video data collection may involve manual interpretation of the data or computer visioning techniques. Manual interpretation of video is the most common "automated" process of pedestrian data collection. Nearly thirty percent of equipment users reported application of this technology. Computer visioning (described below) is generally focused on a specific counting project.
All of the technologies identified, other than video, are usable for permanent counting. Active infrared is more suitable for indoor use. Computer visioning is generally not transferrable between counting projects. Most of the webinar attendees have fewer than five permanent bicycle or pedestrian count locations. (Question 15 - How many permanent bike and or pedestrian counters do you operate on an ongoing basis?)
The infrared and video technologies can be used for portable counts.
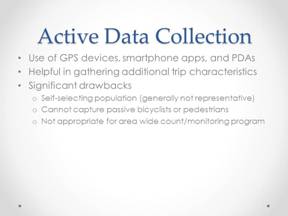
Active data collection technologies (typically GPS enabled devices) are not currently considered suitable to conduct long-term count data collection for pedestrians although Bluetooth monitoring may have potential.
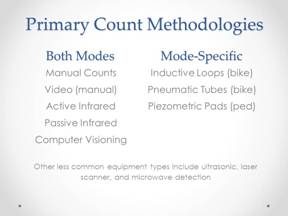
The Task 1 literature review indicated that a wide variety of techniques and equipment types are currently used to count pedestrians on trails and within the roadway environment. The equipment types included in this section of the literature review were presented during the webinars and most were reported by the webinar participants to be in widespread use. The majority of techniques can be applied to both modes, while some are mode-specific by nature. This section identifies and briefly describes the primary counting equipment types, as well as their key inherent advantages and disadvantages for pedestrian counts.
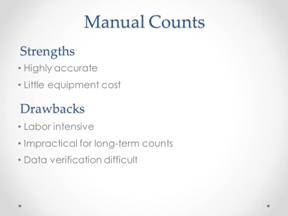
Manual counts, in which a person situated in the field counts pedestrians as they pass the count station, likely remains the most prevalent type of data collection technique because equipment is not required. The observer merely counts facility users using pen and paper or a clicker-type device. Manual counts have the potential to be the most accurate type of count, but the observers must be well-trained and, in some cases, well-supervised. Furthermore, field observers can easily gather other user characteristics (e.g. direction of travel, gender, group size, strollers) with relative ease. Despite not requiring equipment and the potential for high accuracy, manual counts are frequently not conducted because of several inherent drawbacks. These drawbacks include the significant labor cost, the associated impracticality of conducting long-term or permanent counts, and an inability to verify data, which is particularly important if volunteer staff are used.
Another common variation on manual counts is to videotape the facility and have an observer count users while watching the resulting video. Video-based counts offer some advantages over other manual counts. Specifically, the ability to re-watch footage improves accuracy and allows for data verification while the ability to bypass periods of inactivity can reduce labor costs and thereby increase the span of data collection. However, the camera setups can be expensive to acquire, install, and maintain.
Computer visioning refers to any type of video-based data collection that counts and classifies users through a computer model or algorithm rather than through a manual process. Computer visioning applications have proliferated in recent years because of the inherent advantages they offer (e.g., data verification, labor reduction, and success in crowded settings) and improvements in technology. However, each computer visioning process tends to be different because of its complex nature and the lack of a standardized approach.
The processes documented in the research and discussed during the subsequent interviews were developed by researchers to test algorithms that can be used to detect individual pedestrians, determine their direction and speeds, and in some cases map their movements. The algorithms developed are specific to the equipment used, its orientation and the environment in which it is deployed. As a result, there are no "off-the-shelf" products to implement the computer visioning methods documented in the research and the technology remains largely non-transferable.
Active infrared detectors sense and count pedestrians when an infrared beam is broken. Active infrared detectors are often used because they are highly portable for counting at different locations, they allow for longer-term counts, and they are relatively low-cost compared to other automated count equipment. Active infrared detectors remain more appropriate for indoor use because of their sensitivity to interference from objects that are not intended to be counted such as rain, leaves, and animals. While this drawback is reported to be lessening as technology improves, it remains less practical for installation along outdoor transportation facilities than other devices.
Passive infrared detectors produce an image of heat that indicates the presence of a pedestrian or bicyclist. The literature review suggests that passive infrared detectors are the most widely tested and perhaps the most widely used of the automated count technologies. These devices are viewed favorably by many researchers and practitioners because they are widely available, relatively low-cost, have been thoroughly tested, and have generally been shown to produce good accuracy rates. There is a range of error rates, however, which is usually related to passive infrared detectors' frequent inability to distinguish distinct users when they are traveling side by side or in groups.
Piezometric pads are devices embedded within the walking surface used to detect pressure that is applied as pedestrians traverse them. This is another equipment type that provides a permanent source of count data and it has the added benefit of low maintenance costs following installation. That installation, however, can be expensive unless performed in conjunction with an ongoing construction project. It is worth noting that similar devices, sometimes referred to as piezometric strips, can be used to count bicycles using a similar technique.
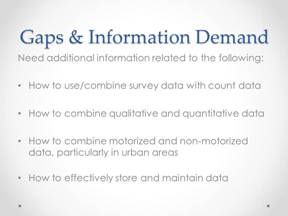
Very little information was obtained on data processing activities both through the webinars and the practitioner discussions. This can be traced to the large number of participants with little or no experience in the area and the limited numbers of counts conducted. Almost half the webinar attendees reported fewer than 10 pedestrian counts a year. (Question 13 - How many pedestrian counts do you do a year?) The Traffic Monitoring guide update is working to improve procedures in this area.
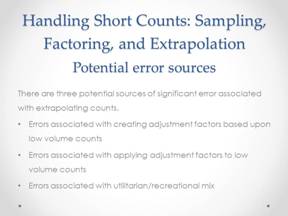
Select practitioners indicated that various factoring methods exist and are appropriate for use. The National Bicycle and Pedestrian Documentation Project provides a series of tables to extrapolate hourly volume counts to annual volumes. Numerous practitioners have recognized that the NBPDP adjustment factors are based upon a significant amount of data. However, they also note that travel volume distributions vary greatly from location to location and should be confirmed at local (and frequently site specific) long term count sites. They also suggest that such factors were more likely location-specific than regionally or nationally transferable.
Information on data variance was limited. Several practitioners in discussing their count programs mentioned sources of error, as outlined in Table 1.
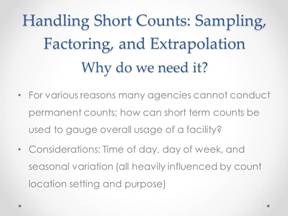
There is no documented information on how to determine the minimum number of counts or a sampling procedure. Ideally, multiple counts would be conducted over similar time periods and checked for consistency and confidence level. The sample size and number of counts required to obtain a desirable level of confidence is dependent upon the variation in the sample and the level of confidence one wants to attain. For hour of day counts, the distribution would need to be evaluated to determine the confidence of level of hourly-to-daily factors.
The fourth webinar had a vigorous participant discussion on some of the recommended practices for sampling periods. Some of the practitioners had comments on use of portable counters and short period counts in their counting programs.
Colorado DOT is the only agency that identified a standard reporting format based on the traffic data software package they use for processing other traffic data. An example of Colorado DOT's online output format (December 8, 2011) follows.
Figure 1. Sample On-line Statistics Output - Colorado DOT
Active data collection with devices worn or carried by pedestrians is thought to have potential applications by several of the researchers. It is not, however, in common use for pure counting or monitoring programs. The individuals used for data collection purposes are self-selecting limiting the population and coverage areas. These biases cannot be satisfactorily addressed without use of significant supplemental data collection activities to obtaining data for factoring and other purposes that need to include the entire population.
A series of questions was asked to see what types of information webinar attendees considered relevant to a pedestrian count record:
Question 21 - Which of the following should be MANDATORY in a national pedestrian data record?
Question 22 - Which of the following would be nice to have in a national pedestrian data record?
Question 23 - Which of the following should be OMITTED from a national pedestrian data record?
Responses recommended as mandatory by sixty-five percent of poll participants are included in the "should" category. Responses selected by at least fifty percent of the respondents as either mandatory or nice are identified as "could be included".
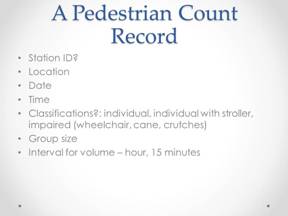
Based on the input of the attendees, a standard pedestrian count record should include the following items:
Additional potential record items that could be included are:
The fact that weather and location show up twice may reflect some uncertainty on how that variable would be quantified.
The purpose of the count was not recommended for inclusion in the record.
The distribution of responses from the webinar attendees by record item can be seen in Table 2.
Table 2. Pedestrian Data Record Field Options
| Pedestrian Data Record – Candidates for Data Fields | Mandatory | Nice | Omitted |
|---|---|---|---|
|
Station ID |
67% |
25% |
8% |
|
Location (latitude/longitude) |
75% |
33% |
4% |
|
Location (route/milepost) |
35% |
37% |
4% |
|
Location (street name/address) |
65% |
51% |
6% |
|
Date |
100% |
39% |
2% |
|
Time |
100% |
41% |
2% |
|
Direction |
59% |
53% |
8% |
|
Classifications |
39% |
53% |
10% |
|
Collection Method |
59% |
45%* |
4% |
|
Interval for volume (i.e. hour, 15 minutes) |
88 % |
33% |
2% |
|
Purpose |
14% |
41% |
51% |
|
Group size |
12% |
41% |
43% |
|
Weather |
75% |
53% |
6% |
*Exceeded 50% for mandatory
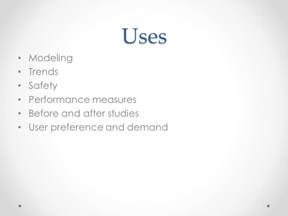
The most common reasons for pedestrian counts according to the webinar attendees are:
Before and after studies are anticipated to increase the need for pedestrian counts as reported in APPENDIX D – WEBINAR POLL RESULTS, Current and Anticipated Data Uses, Question 4 - Pedestrian counts are collected for: and Question 5 - Pedestrian counts are anticipated to be needed for:
As noted in the previous chapter, this project focused on continuous count practices. However, the majority of the experience claimed by the webinar participants was in the area of manual counts. For those who used automated methods, the most common ones were pneumatic tubes followed by manual video and inductive loops. Details on experience can be found in APPENDIX D – WEBINAR POLL RESULTS.
Equipment Experience:
Question 10 - Bicycle count methods used:
Question 11 - Which of the following technologies has your agency employed for bicycle counts?
Impact sensors can be used for bicycle data collection. However, sensors such as tubes which protrude above the surface can pose a tripping hazard to other users of the facility (rollerbladers, individuals with canes or other mobility assistance devices, strollers.)
Video data collection may involve manual interpretation of the data or computer visioning techniques. Manual interpretation of video is the most common "automated" process of bicycle data collection. Nearly thirty percent of equipment users reported application of this technology. Computer visioning is generally focused on a specific counting project.
All of the technologies identified are usable for permanent counting. Active infrared is more suitable for indoor use. Computer visioning is generally not transferrable between counting projects. Most of the webinar attendees have fewer than five permanent bicycle or pedestrian count locations. (Question 15 - How many permanent bike and or pedestrian counters do you operate on an ongoing basis?)
The tube sensor, infrared and video technologies can be used for portable counts.
Active data collection technologies are not currently considered suitable to do long-term count data collection for bicyclists although Bluetooth monitoring may have potential.
The Task 1 literature review indicated that a wide variety of techniques and equipment types are currently used to count bicycles and pedestrians on trails and within the roadway environment. The equipment types included in this section of the literature review were presented during the practitioner webinars and most were reported by the webinar participants to be in widespread use. The majority of techniques can be applied to both modes, while some are mode-specific by nature. This section identifies and briefly describes the primary counting equipment types, as well as their key inherent advantages and disadvantages for bicycle counts.
Manual counts, in which a person situated in the field counts bicyclists as they pass the count station, likely remains the most prevalent type of data collection because equipment is not required. The observer merely counts facility users using pen and paper or a clicker-type device. Manual counts have the potential to be the most accurate type of count, but the observers must be well-trained and in some cases well-supervised. Furthermore, field observers can easily gather other user characteristics (e.g. direction of travel, helmet use, gender) with relative ease. Despite not requiring equipment and the potential for high accuracy, manual counts are frequently not conducted because of several inherent drawbacks. These drawbacks include the significant labor cost, the associated impracticality of conducting long-term or permanent counts, and an inability to verify data, which is particularly important if volunteer staff is used.
Another common variation on manual counts is to videotape the facility and have an observer count users while watching the resulting video. Video-based counts offer some advantages over other manual counts. Specifically, the ability to re-watch footage improves accuracy and allows for data verification while the ability to bypass periods of inactivity can reduce labor costs and thereby increase the span of data collection. However, the camera setups can be expensive to acquire, install, and maintain.
Computer visioning refers to any type of video-based data collection that counts and classifies users through a computer model or algorithm rather than through a manual process. Computer visioning applications have proliferated in recent years because of the inherent advantages they offer (e.g., data verification, labor reduction, and success in crowded settings) and improvements in technology. However, each computer visioning process tends to be different because of its complex nature and the lack of a standardized approach. As a result, there are no "off the shelf" products and the technology remains largely non-transferable.
Active infrared detectors sense and count bicyclists when an infrared beam is broken. Active infrared detectors are often used because they are highly portable for counting at different locations, they allow for longer-term counts, and they are relatively low-cost compared to other automated count equipment. Active infrared detectors remain more appropriate for indoor use because of their sensitivity to interference from objects that are not intended to be counted such as rain, leaves, and animals. While this drawback is reported to be lessening as technology improves, it remains less practical for installation along outdoor transportation facilities than other devices.
Passive infrared detectors produce an image of heat that indicates the presence of a pedestrian or bicyclist. The literature review suggests that passive infrared detectors are the most widely tested and perhaps the most widely used of the automated count technologies. These devices are viewed favorably by many researchers and practitioners because they are widely available, relatively low-cost, have been thoroughly tested, and have generally been shown to produce good accuracy rates. There is a wide range of error rates, however, which is usually related to passive infrared detectors' frequent inability to distinguish distinct users when they are traveling side by side or in groups.
Inductive loops are specific to the bicycle mode. As with similar devices that are in widespread use to detect and count motor vehicles, bicycle loops are embedded within the pavement and use electricity to detect when metal objects (i.e. bicycles) pass over them. The primary advantage of inductive loops is that they provide a permanent bicycle count station. They can be susceptible to undercounting bicycles made of certain materials and they can be difficult to apply in shared lane environments (counting nearby motor vehicles in addition to the intended bicyclists). However, recent technological advances are mitigating both of these drawbacks.
Bicycles made from composite materials (primarily carbon fiber) are not detectable by inductive loops, a common type of bicycle count technology. Fortunately, only a small percentage of bicycles are carbon fiber thus this error source is minimal. On roadways frequented by high end road cyclists, an adjustment factor based upon could be obtained through observational counts. Observers would need to be very carefully trained to identify carbon fiber bicycles. Assuming a 1% or 2% carbon fiber mix, would probably provide an acceptable level of accuracy for count adjustment.
Pneumatic tubes are another device used to count bicyclists but not pedestrians. Rubber tubes are placed over the facility and triggered when a bicycle applies pressure to the tube as it is crossed. The fact that many transportation agencies already use such tubes to count motor vehicles offers a couple of key advantages: readily available devices and the output of automated data in familiar formats. Among the potential drawbacks of pneumatic tubes are the hazard they pose to certain users on shared use paths and the need for trained individuals to install and monitor the devices.
The only information provided during the webinars on weather effects on bicycle counts provided was anecdotal in nature.
Very little information was obtained on data processing activities both through the webinars and the practitioner discussions. This can be traced to the large number of participants with little or no experience in the area and the limited numbers of counts conducted. Nearly sixty percent of the webinar attendees reported fewer than 10 bicycle counts a year. (Question 14 - How many bicycle counts do you do a year?)
No information was obtained on factoring techniques for bicycle data that might be reproducible by others.
Information on data variance was limited. Several practitioners, in discussing their count programs, mentioned sources of error.
There is no documented information on how to determine the minimum number of counts or a sampling procedure.
Colorado DOT is the only agency that identified a standard reporting format based on the traffic data software package they use for processing other traffic data. An example of Colorado DOT's online output format is included in the Pedestrian Data Collection section of this report.
Active data collection using GPS enable devices carried or worn by bicyclists is thought to have potential by several of the researchers. It is not, however, in common use. The sole exception is the San Francisco County Transportation Authority CycleTracks activity, which is used for modeling travel patterns rather than counting users.
A series of question was asked to see what types of information webinar attendees considered relevant to a bicycle count record:
Question 24 - Which of the following should be MANDATORY in a national bicycle data record?
Question 25 - Which of the following would be nice to have in a national bicycle data record?
Question 26 - Which of the following should be OMITTED from a national bicycle data record?
Responses recommended as mandatory by sixty-five percent of the poll participants are included in the "should" category. Responses selected by at least fifty percent of the respondents as either mandatory or nice to have are identified as "could be included."
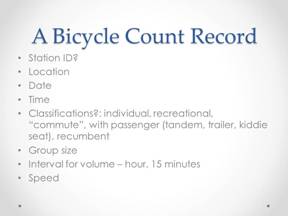
Based on the input of the attendees, a standard pedestrian count record should include the following items:
Additional potential items that could be included in the record are:
Speed is not recommended for inclusion in the record.
The distribution of responses from the webinar attendees by record item is summarized in Table 3.
Table 3. Bicycle Data Record Data Field Options
| Bicycle Data Record–Candidates for Data Fields | Mandatory | Nice | Omitted |
|---|---|---|---|
|
Station ID |
66% |
19% |
9% |
|
Location (latitude/longitude) |
64% |
30% |
2% |
|
Location (route/milepost) |
34% |
28% |
6% |
|
Location (street name/address) |
47% |
38% |
2% |
|
Date |
100% |
30% |
0% |
|
Time |
96% |
28% |
0% |
|
Direction |
28% |
51% |
15% |
|
Classifications |
53% |
28%* |
0% |
|
Collection Method |
66% |
9% |
4% |
|
Interval for volume (i.e. hour, 15 minutes) |
60% |
38%* |
9% |
|
Weather |
4% |
40% |
34% |
|
Speed |
4% |
36% |
70% |
|
Purpose |
12% |
9% |
43% |
*Exceeded 50% in mandatory.
The most common reasons for bicycle counts according to the webinar attendees are:
No changes are expected in the categories where more counting will be done as reported in APPENDIX D – WEBINAR POLL RESULTS, Current and Anticipated Data Uses, Question 6 - Bicycle counts are collected for: and Question 7 - Bicycle counts are anticipated to be needed for:
This appendix includes the slides from the webinar with the poll questions embedded at the appropriate locations. The figures of a pedestrian and a bicyclist indicate the slides following which poll questions were asked.
The slides and the questions were available for download by all participants via the library on the webinar site. The materials were also forwarded by e-mail to those individuals who requested them. Where questions were not visible to the participants because of software technical difficulties, copies of the poll were furnished on request. No responses were received following the e-mail of the questions.
| Presentation materials with poll questions inserted | |
|---|---|

|

|
|
What do You Want the Data for? (chat box) Open ended question with response via chat box |
|

|

|

|

|
For which type of agency do you work?
|
For how many years have you/ your agency been collecting bicycle and or pedestrian count data?
|
Is your pedestrian/bicycle data collection program -
|
|

|
|
|

|

|
|
Pedestrian counts are collected for -
|
Pedestrian counts are anticipated to be needed for -
|
Bicycle counts are collected for -
|
Bicycle counts are anticipated to be needed for -
|
 |
|
|
|
|

|

|
|
|

|

|
|
|
|
Pedestrian count methods used
|
Which of the following automated technologies has your agency employed for pedestrian counts?
|
Bicycle count methods used
|
Which of the following technologies has your agency employed for bicycle counts?
|
Has your agency independently evaluated the effectiveness of any automated count equipment types?
|
How many pedestrian counts do you do a year?
|
How many bicycle counts do you do a year?
|
How many permanent bike and or pedestrian counters do you operate on an ongoing basis?
|

|
|
|
|
 |

|

|
|
Do you have experience extrapolating short-term bicycle or pedestrian counts over longer periods of time using temporal adjustment factors (HOD, DOW, Seasonal or Annual)?
|
If the answer to #16 is yes, what is the source of your methodology? No vote required. |
Does your agency seek to estimate system/network usage based on screenline counts?
|
If so, are you aware of a reliable system/network estimation methodology?
|
Do you have a particularly effective and or unique data storage process to recommend?
|
|
 |
|
 |
Which of the following should be MANDATORY in a national pedestrian data record
|
Which of the following would be nice to have in a national pedestrian data record
|
Which of the following should be OMITTED in a national pedestrian data record
|
 |

|
Which of the following should be MANDATORY in a national bicycle data record
|
Which of the following would be nice to have in a national bicycle data record
|
Which of the following should be OMITTED from a national bicycle data record
|
|
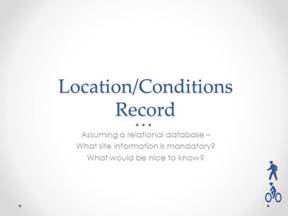 |
The following should be MANDATORY in a national pedestrian/bicycle count information (Location) record
|
 |

|
This project was intended to get participation from all 50 states and at least 10 Metropolitan planning organizations (MPOs.) State personnel to contact were identified through personal contacts, consultation with FHWA and the literature review. At least one contact was identified in all fifty states, the District of Columbia, and Puerto Rico, with invitations accepted by forty-one states and the District of Columbia. Twenty-four states and the District of Columbia had one or more personnel attend. Table 4 shows the number of individuals invited and the numbers attending each webinar by agency type where it could be identified. At some webinars, more than one attendee from an agency was present. Some agencies had personnel at more than one webinar. The totals reflect the number of unique agencies attending.
Table 4. Attendance Statistics
| Attendance Statistics | |||||
|---|---|---|---|---|---|
|
|
Webinar 1 |
Webinar 2 |
Webinar 3 |
Webinar 4 |
Total |
|
Invitations Sent |
94 |
41 |
67 |
37 |
* |
|
Attendance |
11 |
27 |
37 |
24 |
99 |
|
State |
6 |
9 |
8 |
14 |
25** |
|
MPO |
|
6 |
6 |
4 |
8** |
|
University |
2 |
1 |
|
1 |
4 |
|
Vendor |
1 |
|
|
1 |
2 |
|
Town/City |
|
2 |
2 |
1 |
5 |
|
Unknown/Other |
3 |
4 |
4 |
4 |
|
*Includes follow ups but does not include a total because number associated with the Highway CommunityExchange announcement (the FHWA community of practice web site) is unknown.
**Unique agencies represented
Table 5 identifies the states that participated in the webinars and provided input via the poll questions.
Table 5. States Represented at Pedestrian and Bicycle Data Collection Webinars
Alaska |
Arkansas |
Arizona |
Colorado |
Connecticut |
District of Columbia |
Florida |
Georgia |
Indiana |
Maryland |
Maine |
Michigan |
Minnesota |
Montana |
North Carolina |
North Dakota |
Nebraska |
Ohio |
Rhode Island |
South Carolina |
South Dakota |
Virginia |
Vermont |
Washington |
West Virginia |
Table 6 identifies the MPOs that participated in the webinars and provided input via the poll questions.
Table 6. MPOs Represented at Pedestrian and Bicycle Data Collection Webinars
|
Nashville Are MPO (TN) |
Capital Regional Council of Governments (CT) |
Miami-Dade MPO (FL) |
|
Pima Association of Governments (AZ) |
Baltimore Metropolitan Council (MD) |
Mid-Ohio Regional Planning Commission |
|
Des Moines Area MPO (IA) |
Region XII Council of Governments (IA) |
In addition to explicit invitations, an announcement matching the invitation was posted to HighwayCommunityExchange after the first webinar to make knowledge of the project generally available. (HighwayCommunityExchange is the web site for the FHWA community of practice. The Travel Monitoring section was where the announcement was posted.)
Table 7 identifies other organizations that participated in the webinars and provided input via the poll questions.
Table 7. Other Organizations Represented at Pedestrian and Bicycle Data Collection Webinars
| Other Municipalities | ||
|---|---|---|
City of Boulder (CO) |
City of Seattle (WA) |
City of Frederick (MD) |
Prince George's County (Parks and Rec) (MD) |
Arlington County Division of Transportation (VA) |
Lewis and Clark County (MT) |
| Educational/ Research Organizations | ||
|---|---|---|
|
Texas Transportation Institute |
University of Colorado Denver |
Portland State University |
| Others including Advocacy Groups and Vendors | ||
|---|---|---|
|
MNSU |
Bike Walk Twin City |
Minneapolis Publish |
|
National Park Service |
Centers for Disease Control |
Cambridge Systematics |
|
Alert Systems |
RDS Traffic |
PBIC |
The invitation process had two components: a targeted e-mail group and a general announcement. The targeted e-mail group included state agencies, MPOs, FHWA Division personnel and members of Transportation Research Board committees with an interest in the topic. The initial contacts at the state agencies and MPOs were contacted via e-mail (Figure 1) and one follow up to get a current list of individuals associated with pedestrian and bicycle data collection.
|
Dear _________: FHWA expects to include pedestrian and bicycle counting in the next version of the Traffic Monitoring Guide. In anticipation of the inclusion of these data FHWA is gathering relevant information on the state-of-the-practice and methods/processes used to collect this information. Such information includes proper counting techniques, quality assurance procedures, and processing techniques. As part of an ongoing research project on this subject, interactive webinars will be conducted on several dates in September 2011. The primary purpose of these webinars is to solicit practitioner input on both experiences and needs as they relate to bicycle and pedestrian counting activities. Participation by one or more individuals from each state's transportation department is desired. It is expected that the state bicycle and pedestrian coordinator will be the most appropriate webinar participant in many instances. If that is true in your case, please let us know and we will be back in touch soon with a formal invitation. If another individual within your agency would be a more appropriate attendee given the subject matter, please provide his or her e-mail address and phone number. Finally, please let us know if you are aware of regional or local transportation agencies within your state which would be particularly beneficial to include in the invitee list. Your participation (or designation of an alternate participant) is much appreciated. |
Figure 2. Initial Contact Note
Figure 2 shows the e-mail message which was sent to targeted participants as an initial invitation. The same invitation, edited to include only the remaining webinar dates, was also used to follow up with agencies that had not yet participated.
|
You are invited to attend a webinar on pedestrian and bicycle data collection at one of the following times (we have made 4 available to make attending one of them possible): August 24, 2011, 2-3 pm Eastern September 12, 2011, 2-3 pm Eastern September 19, 2011 11 am – 12 noon Eastern September 21, 2011 10-11 am Eastern To login: http://fhwa.adobeconnect.com/fhwatalkingtraffic Phone: 877-848-7030 passcode: 6217068 The FHWA research project on Pedestrian and Bicycle Data Collection is seeking information on the state-of-the-practice in collecting, storing and using pedestrian and bicycle count data. To solicit input from practitioners at the state and regional level, four identical webinars are being held. The results of the webinar will be used by FHWA in deciding what materials and methods should be included in the current revision of the Traffic Monitoring Guide on pedestrian and bicycle data collection. |
Figure 3. Final Webinar Invitation (Part 1)
|
The webinar will present results from a recent literature review of the topic using U.S. and international materials. We will be discussing equipment types, strengths and weaknesses; uses of and needs for pedestrian and bicycle data, factoring short counts, and the potential content of standard records for data storage. A series of inquiries will be posed to attendees about their current data collection practices and present anticipated needs for this data. The webinar will include: What type of bicycle and pedestrian data are you interested in and how do you report this data to your customers? What type of agency do you represent and how long has that agency been collecting pedestrian and or bicycle data? Is the data collected project specific or for trends/network evaluation? What kinds of equipment do you use? What information would you like to have about equipment? Are you using automated or manual methodologies? Do you use passive or active (i.e. GPS) technologies? What factoring methods do you use for short counts? Low volume counts? Screenlines? How do you store your data? What information do you need to store? What information would be nice to have? If you are not available for any of the proposed dates and would like to provide input, please contact Barbara Ostrom (Barbara.Ostrom@amec.com) or Peyton McLeod (pmcleod@sprinklecounsulting.com) for a copy of the webinar material. |
Figure 4. Final Webinar Invitation (Part 2)
During the course of the four webinars, input from the participants was collected in three formats:
1. Screenshots of poll results as broadcasted during the webinars,
2. CSV files downloaded from the software used for polling, and
3. Answers provided via the chat box.
Input received through the three formats was combined to provide the summary of results for each question. In some cases answers were not obtained in every format for each question as a result of software malfunctions.
Invitations for the first webinar targeted individuals and agencies that were known to have experience in the area. Later webinars were announced to a wider audience. The results of the individual webinars are reported in this appendix to provide a measure of variation or lack of it between the webinar groups.
The majority of the questions allowed multiple answers from the attendees. Questions that permitted multiple answers have percentages typically based on the maximum number of responses, not the number of respondents. In such cases, the rates are likely to be labeled frequency rather than percentage. Questions which were single answer per participant have percentages based on the number of respondents.
The questions are grouped into the following five categories:
1. Who is participating,
2. Current and anticipated data uses,
3. Experience (with equipment),
4. Data processing practices, and
5. Data sharing by means of a commonly accepted record format.
The first series of questions was asked to see who was responding to the questions posed during the webinar.
The first question asked was "Why are you attending the webinar?" The answers over the series of webinars showed roughly 40% of people attending were interesting in learning more about data collection, reporting methodologies and best practices for bicycle and pedestrian facilities. The target group, state agencies and MPOs, had a percentage closer to 50% for those same categories. About 20% of the respondents wanted data to help justify investment for pedestrian and bicycle facilities or for planning and design of pedestrian or bicycle facilities. That percentage increases to 30% for investment and 35% for planning and design for state agencies and MPOs as a group.
Through the four webinars hosted, over 100 people participated represented by 99 individual logins with about 50% of the attendees representing state agencies and another 20% representing MPOs.
The webinar attendees had little if any experience with data collection in this area, with 72% of agency personnel reporting three or fewer years of experience. A handful of state agencies acknowledge the greatest experience.
| Question 2 | Webinar 1 | Webinar 2 | Webinar 3 | Webinar 4 | Total | Percentage |
|---|---|---|---|---|---|---|
|
Not yet |
6 |
5 |
7 |
10 |
28 |
44% |
|
1-3 years |
4 |
7 |
4 |
3 |
18 |
28% |
|
4-7 years |
1 |
5 |
3 |
1 |
10 |
15% |
|
8-10 years |
0 |
1 |
2 |
2 |
5 |
8% |
|
11+ years |
0 |
1 |
1 |
1 |
3 |
5% |
Of the webinar attendees who have a pedestrian or bicycle data collection program, periodic scheduled counts, on demand counts, and recurring and on demand counts in combination were the most common descriptors of the counting program intervals.
| Question 3 | Webinar 1 | Webinar 2 | Webinar 3 | Webinar 4 | Total | Percentage |
|---|---|---|---|---|---|---|
|
Continuous counts |
3 |
3 |
0 |
2 |
8 |
13% |
|
Periodic scheduled counts |
3 |
8 |
0 |
4 |
15 |
24% |
|
On demand counts |
3 |
4 |
1 |
4 |
12 |
19% |
|
Recurring (continuous and periodic) only |
0 |
0 |
0 |
0 |
0 |
0% |
|
Recurring and on demand |
3 |
7 |
0 |
3 |
13 |
21% |
|
Do not count [Reason? Please use the chat box] |
0 |
1 |
5 |
8 |
14 |
23% |
Data collection practices will be strongly influenced by the requirements and needs driving the use of the data. Participants were asked to identify what they are using the data for now and what pedestrian and bicycle related activities they expect to need data for in the future.
Safety analyses, project design, project evaluation and trend analyses ranked the highest for the purpose of collecting pedestrian counts, followed by project selection (preliminary planning).
However, while looking at the results split by type of organization, state agencies typically selected project design, safety analyses and project evaluation. Regional agencies/MPOs selected trend analyses, safety analyses and project evaluation. Federal agencies collected pedestrian counts mainly for safety analyses, project selection and trend analyses. Research and educational institutions typically did pedestrian data collection for project evaluation and safety analyses.
| Question 4 | Webinar 1 | Webinar 2 | Webinar 3 | Webinar 4 | Total | Frequency |
|---|---|---|---|---|---|---|
|
Safety analyses |
5 |
9 |
10 |
5 |
29 |
22% |
|
Project selection (preliminary planning) |
3 |
5 |
7 |
2 |
17 |
13% |
|
Project design |
5 |
8 |
7 |
4 |
24 |
18% |
|
Project evaluation (before and after studies) |
5 |
8 |
9 |
4 |
26 |
19% |
|
Modeling - long range planning |
5 |
2 |
2 |
1 |
10 |
7% |
|
Modeling - simulation |
1 |
1 |
0 |
1 |
3 |
2% |
|
Trends analyses |
3 |
8 |
10 |
4 |
25 |
19% |
The anticipated needs for pedestrian data collection include project selection along with the top reasons why pedestrian counts are currently collected; i.e., safety analyses, project design, project evaluation and trend analyses. These anticipated needs for pedestrian data collection did not show any notable differences based on agency type.
| Question 5 | Webinar 1 | Webinar 2 | Webinar 3 | Webinar 4 | Total | Frequency |
|---|---|---|---|---|---|---|
|
Safety analyses |
4 |
9 |
13 |
8 |
34 |
16% |
|
Project selection (preliminary planning) |
4 |
11 |
10 |
6 |
31 |
15% |
|
Project design |
6 |
11 |
12 |
6 |
35 |
17% |
|
Project evaluation (before and after studies) |
6 |
13 |
13 |
10 |
42 |
20% |
|
Modeling - long range planning |
5 |
5 |
6 |
7 |
23 |
11% |
|
Modeling - simulation |
0 |
5 |
3 |
3 |
11 |
5% |
|
Trends analyses |
5 |
10 |
13 |
7 |
35 |
17% |
Safety analyses, project evaluation and trend analyses ranked the highest for the purpose of collecting bicycle counts, followed closely by project selection (preliminary planning) and project design.
Looking at the results on an agency basis, state agencies more commonly selected project design. Regional agencies/MPOs selected project evaluation and trend analyses. Research and educational institutions selected bicycle data collection for project evaluation most frequently among all organizations.
| Question 6 | Webinar 1 | Webinar 2 | Webinar 3 | Webinar 4 | Total | Frequency |
|---|---|---|---|---|---|---|
|
Safety analyses |
2 |
10 |
10 |
4 |
26 |
18% |
|
Project selection (preliminary planning) |
3 |
9 |
8 |
3 |
23 |
16% |
|
Project design |
4 |
6 |
8 |
5 |
23 |
16% |
|
Project evaluation (before and after studies) |
5 |
8 |
11 |
6 |
30 |
21% |
|
Modeling - long range planning |
4 |
1 |
3 |
3 |
11 |
8% |
|
Modeling - simulation |
0 |
0 |
1 |
1 |
2 |
1% |
|
Trends analyses |
3 |
10 |
11 |
5 |
29 |
20% |
|
Other |
0 |
0 |
2 |
0 |
2 |
1% |
The anticipated needs for bicycle data collection include project selection along with the top reasons why bicycle counts are currently collected; i.e., safety analyses, project evaluation and trend analyses, followed closely by project design. Regional agencies/MPOs selected project selection and trend analyses more often than state agencies. Research and educational institutions more often identified safety analyses.
|
Question 7 |
Webinar 1 | Webinar 2 | Webinar 3 | Webinar 4 | Total | Frequency |
|---|---|---|---|---|---|---|
|
Safety analyses |
7 |
10 |
14 |
11 |
42 |
18% |
|
Project selection (preliminary planning) |
5 |
9 |
9 |
11 |
34 |
15% |
|
Project design |
4 |
8 |
12 |
8 |
32 |
14% |
|
Project evaluation (before and after studies) |
7 |
9 |
11 |
12 |
39 |
17% |
|
Modeling - long range planning |
8 |
3 |
8 |
6 |
25 |
11% |
|
Modeling - simulation |
2 |
3 |
3 |
6 |
14 |
6% |
|
Trends analyses |
7 |
9 |
14 |
11 |
41 |
18% |
|
Other |
0 |
0 |
1 |
1 |
2 |
1% |
The types of methodologies and equipment currently in use were investigated.
The vast majority of attendees indicated that they used manual count methods for pedestrian counts with some using automated fixed location. State agencies were more likely to use automated fixed location methods for pedestrian counts than MPOs. One attendee mentioned an additional strength for manual counts as the ability to track additional attributes, like gender, helmet use, strollers, wheelchairs, etc.
| Question 8 | Webinar 1 | Webinar 2 | Webinar 3 | Webinar 4 | Total | Percentage |
|---|---|---|---|---|---|---|
|
Manual |
4 |
17 |
18 |
12 |
51 |
61% |
|
Automated fixed location |
4 |
6 |
6 |
2 |
18 |
22% |
|
Active collection (GPS, Smartphone) |
0 |
0 |
1 |
0 |
1 |
1% |
|
None |
3 |
1 |
5 |
4 |
13 |
16% |
Agencies with automated equipment experience include Colorado DOT, Vermont Agency of Transportation, Arlington County DOT (Virginia) and Bike Walk Twin Cities,
For the attendees who reported using automated technologies for pedestrian counts, active infrared, passive infrared and manual video were the most popular ones, with at least a third of users selecting each. State agencies most commonly used active infrared, followed by manual video. The summary table provided below includes both the experience of all respondents and the distribution of equipment types by users with at least some equipment experience.
|
Question 9 |
Webinar 1 | Webinar 2 | Webinar 3 | Webinar 4 | Total | All Respondents | Respondents with Experience |
|---|---|---|---|---|---|---|---|
|
Piezoelectric Pad |
1 |
0 |
0 |
0 |
1 |
1% |
3% |
|
Active Infrared |
2 |
2 |
1 |
2 |
7 |
10% |
23% |
|
Passive Infrared |
2 |
2 |
2 |
2 |
8 |
11% |
26% |
|
Computer Visioning |
0 |
1 |
0 |
2 |
3 |
4% |
10% |
|
Manual Video |
0 |
5 |
2 |
2 |
9 |
13% |
29% |
|
Not certain/Other (identify technology or equipment in chat box) |
0 |
0 |
1 |
2 |
3 |
4% |
10% |
|
None |
6 |
11 |
14 |
9 |
40 |
56% |
-- |
The majority of attendees indicated that they used manual count methods for bicycle counts. A larger percentage indicated using automated fixed location equipment than for pedestrian counts. State agencies and MPOs showed similar trends while research and educational institutions more were more likely to use automated fixed location equipment.
| Question 10 | Webinar 1 | Webinar 2 | Webinar 3 | Webinar 4 | Total | Percentage |
|---|---|---|---|---|---|---|
|
Manual |
1 |
15 |
14 |
6 |
36 |
49% |
|
Automated fixed location |
6 |
9 |
6 |
3 |
24 |
33% |
|
Active collection (GPS, Smartphone) |
0 |
0 |
1 |
0 |
1 |
1% |
|
None |
2 |
0 |
6 |
4 |
12 |
16% |
Agencies which have automated fixed location equipment experience for bicycle data collection include the Arizona, Colorado, Iowa, Nebraska, South Carolina, Vermont and Washington DOTs, Arlington County DOT(Virginia), Erie County (Ohio), Prince Georges County Park and Planning (Maryland), Bike Walk Twin Cities, Seattle, Mid-Ohio Regional Planning Commission and Region XII COG (Iowa).
For the attendees who reported using automated technologies for bicycle counts, pneumatic tubes were the most common with almost 40% of attendees reporting their use. Inductive loop, passive infrared and manual video were also popular with about a quarter of attendees reporting their use. State agencies were more likely to use inductive loops and manual video than MPOs. The summary table provided below includes both the experience of all respondents and the distribution of equipment types by users with at least some equipment experience.
| Question 11 | Webinar 1 | Webinar 2 | Webinar 3 | Webinar 4 | Total | Respondents | Users |
|---|---|---|---|---|---|---|---|
|
Inductive Loops |
2 |
1 |
3 |
1 |
7 |
9% |
15% |
|
Pneumatic Tubes |
1 |
5 |
4 |
2 |
12 |
16% |
25% |
|
Active Infrared |
2 |
2 |
1 |
0 |
5 |
7% |
10% |
|
Passive Infrared |
2 |
2 |
4 |
0 |
8 |
11% |
17% |
|
Computer Visioning |
0 |
0 |
1 |
2 |
3 |
4% |
6% |
|
Manual Video |
1 |
4 |
3 |
0 |
8 |
11% |
17% |
|
Not certain/Other (identify technology or equipment in chat box) |
0 |
2 |
2 |
1 |
5 |
7% |
10% |
|
None |
3 |
8 |
7 |
8 |
26 |
35% |
-- |
During one of the webinars, there was discussion of the EcoCounter equipment that is capable of distinguishing between horses, pedestrians, bicycles, cars, etc., which is something other automated technologies cannot do.
Only about a quarter of the attendees have independently evaluated the effectiveness of automated count equipment with research and educational institutions and advocacy groups having higher percentages than other agencies, although research and educational institutions were a smaller percentage of the participants.
| Question 12 | Yes | No |
|---|---|---|
|
Webinar 1 |
5 |
2 |
|
Webinar 2 |
4 |
12 |
|
Webinar 3 |
2 |
16 |
|
Webinar 4 |
3 |
10 |
|
Total |
14 |
40 |
|
Percentage |
26% |
74% |
Almost 50% of the attendees conduct less than 10 pedestrian counts a year. Approximately another 20% conduct between 10 and 20 counts a year. There were no notable differences between agency types.
| Question 13 | Webinar 1 | Webinar 2 | Webinar 3 | Webinar 4 | Total | Percentage |
|---|---|---|---|---|---|---|
|
Under 10 |
4 |
8 |
5 |
3 |
20 |
47% |
|
10 to 20 |
0 |
4 |
3 |
2 |
9 |
21% |
|
21 to 50 |
1 |
2 |
1 |
2 |
6 |
14% |
|
51 to 100 |
0 |
2 |
2 |
0 |
4 |
9% |
|
100 plus |
0 |
0 |
2 |
2 |
4 |
9% |
Almost 60% of attendees conduct less than 10 bicycle counts a year. For other attendees, 11% and 20% reported conducting 10 to 20 and 21 to 50 counts a year, respectively. Regional agencies and MPOs were more likely than state agencies to conduct more than 10 counts a year.
| Question 14 | Webinar 1 | Webinar 2 | Webinar 3 | Webinar 4 | Total | Percentage |
|---|---|---|---|---|---|---|
|
Under 10 |
6 |
9 |
7 |
3 |
25 |
57% |
|
10 to 20 |
0 |
3 |
1 |
1 |
5 |
11% |
|
21 to 50 |
2 |
2 |
2 |
3 |
9 |
20% |
|
51 to 100 |
0 |
2 |
0 |
0 |
2 |
5% |
|
100 plus |
0 |
0 |
2 |
1 |
3 |
7% |
Over 80% responding have fewer than 5 permanent bicycle or pedestrian permanent counters. Fewer than 10% of attendees indicated having more than 10 permanent counters.
| Question 15 | Webinar 1 | Webinar 2 | Webinar 3 | Webinar 4 | Total | Percentage |
|---|---|---|---|---|---|---|
|
Under 5 |
4 |
13 |
4 |
7 |
28 |
82% |
|
5 to 10 |
0 |
1 |
2 |
0 |
3 |
9% |
|
11 to 20 |
0 |
0 |
0 |
0 |
0 |
0% |
|
21 to 30 |
0 |
1 |
0 |
0 |
1 |
3% |
|
31 or more |
1 |
0 |
0 |
1 |
2 |
6% |
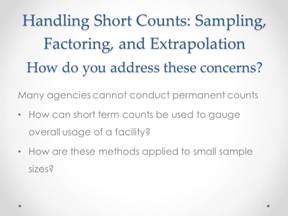
Covering large areas with counters to obtain pedestrian and bicycle counts is not common practice. In most cases counts are done in specific areas or for a specific purpose. The ability to use these counts to draw inferences about long periods or other locations is an area in which more investigation is needed as demonstrated by the experience reported by the participants.
The majority of attendees do not have experience extrapolating short-term bicycle or pedestrian counts over longer periods of time using temporal adjustment factors. During the course of the webinars, there were several questions asked about extrapolating short-term bicycle and pedestrian counts. Attendees were interested in the best practice for this.
| Question 16 | Yes | No |
|---|---|---|
|
Webinar 1 |
1 |
6 |
|
Webinar 2 |
1 |
17 |
|
Webinar 3 |
1 |
7 |
|
Webinar 4 |
3 |
11 |
|
Total |
6 |
41 |
|
Percentage |
13% |
87% |
It was mentioned that some attendees do use seasonal counts to develop seasonal adjustment factors. There was no in-depth discussion of using any type of adjustment factors for extrapolating short-term bicycle or pedestrian counts. However, there was interest expressed in receiving guidance on this topic.
The majority of attendees do not seek to estimate system/network usage based on screenline counts.
| Question 18 | Yes | No |
|---|---|---|
|
Webinar 1 |
2 |
6 |
|
Webinar 2 |
0 |
14 |
|
Webinar 3 |
5 |
6 |
|
Webinar 4 |
1 |
12 |
|
Total |
8 |
38 |
|
Percentage |
17% |
83% |
There seemed to be very limited awareness of reliable system/network estimation methodology with only one person indicating yes. That individual did not elaborate on his or her experience.
| Question 19 | Yes | No |
|---|---|---|
|
Webinar 1 |
0 |
7 |
|
Webinar 2 |
0 |
11 |
|
Webinar 3 |
0 |
10 |
|
Webinar 4 |
1 |
2 |
|
Total |
1 |
30 |
|
Percentage |
3% |
97% |
The vast majority did not have a particularly effective and or unique data storage process to recommend. Some of the processes indicated were Excel and Oracle Traffic Count Database. With many attendees either looking to start bicycle and pedestrian counts or grow their currently limited counts, effective data storage for these new counts was of interest to many.
| Question 20 | Yes | No |
|---|---|---|
|
Webinar 1 |
2 |
6 |
|
Webinar 2 |
1 |
12 |
|
Webinar 3 |
0 |
14 |
|
Webinar 4 |
1 |
7 |
|
Total |
4 |
39 |
|
Percentage |
9% |
91% |
The ability to share data is based on a common understanding of the data, most typically through use of a generally accepted format. One of the items to be identified as an outcome of this project was a recommended format for pedestrian volume counts.
Most attendees felt that date, time and interval for volume should be mandatory in a national pedestrian data record. Station ID, location (latitude/longitude), location (street name/address), direction, collection method, and weather were also selected by the majority of attendees to be included as mandatory information for a national pedestrian data record. There were no large differences between agency types. The items selected as mandatory most often refer to information about the count that will be needed for efficient analysis of data. The summary table provided below has the number of times a response was selected and the percentage of respondents who selected a particular item.
| Question 21 | Webinar 1 | Webinar 2 | Webinar 3 | Webinar 4 | Total | Percentage of Respondents |
|---|---|---|---|---|---|---|
|
Station ID |
4 |
10 |
9 |
11 |
34 |
67% |
|
Location (latitude/longitude) |
6 |
11 |
11 |
10 |
38 |
75% |
|
Location (route/milepost) |
3 |
5 |
5 |
5 |
18 |
35% |
|
Location (street name/address) |
5 |
13 |
7 |
8 |
33 |
65% |
|
Date |
8 |
16 |
13 |
14 |
51 |
100% |
|
Time |
8 |
18 |
11 |
14 |
51 |
100% |
|
Direction |
6 |
8 |
6 |
10 |
30 |
59% |
|
Classifications |
5 |
5 |
3 |
7 |
20 |
39% |
|
Collection Method |
4 |
11 |
6 |
9 |
30 |
59% |
|
Interval for volume (i.e. hour, 15 minutes) |
7 |
15 |
9 |
14 |
45 |
88% |
|
Purpose |
1 |
2 |
2 |
2 |
7 |
14% |
|
Group size |
1 |
3 |
0 |
2 |
6 |
12% |
|
Weather |
5 |
16 |
8 |
9 |
38 |
75% |
|
Other (enter in chat box as ped - mandatory - suggested item) |
0 |
1 |
0 |
1 |
2 |
4% |
Location (street name/address), direction and classifications were the items indicated most as information that would be nice to have in a national pedestrian data record. Almost all items were selected by between 30-50% of attendees. The percentages and number of responses here are much lower than the percentages and responses for the items the attendees felt were mandatory, but the overall number of respondents was roughly the same.
The responses to this question have two percentages computed. The first, Respondents to question, is the percentage of respondents who selected a particular answer for this question. The second, Respondents to mandatory, is the percentage based on the number of participants who responded to the mandatory question. This was taken to represent the maximum number of people with any input to the question and was used to compensate for the fact that no guidance was provided on whether having selected mandatory a vote for nice could or not also occur.
| Question 22 | Webinar 1 | Webinar 2 | Webinar 3 | Webinar 4 | Total | Respondents to Question | Respondents to mandatory |
|---|---|---|---|---|---|---|---|
|
Station ID |
2 |
5 |
1 |
5 |
13 |
48% |
25% |
|
Location (latitude/longitude) |
5 |
4 |
2 |
6 |
17 |
63% |
33% |
|
Location (route/milepost) |
6 |
5 |
3 |
5 |
19 |
70% |
37% |
|
Location (street name/address) |
9 |
5 |
6 |
6 |
26 |
96% |
51% |
|
Date |
5 |
7 |
3 |
5 |
20 |
74% |
39% |
|
Time |
5 |
7 |
3 |
6 |
21 |
78% |
41% |
|
Direction |
6 |
8 |
6 |
7 |
27 |
100% |
53% |
|
Classifications |
4 |
9 |
7 |
7 |
27 |
100% |
53% |
|
Collection Method |
5 |
7 |
4 |
7 |
23 |
85% |
45% |
|
Interval for volume (i.e. hour, 15 minutes) |
5 |
4 |
2 |
6 |
17 |
63% |
33% |
|
Purpose |
5 |
5 |
4 |
7 |
21 |
78% |
41% |
|
Group size |
3 |
6 |
7 |
5 |
21 |
78% |
41% |
|
Weather |
7 |
5 |
6 |
9 |
27 |
100% |
53% |
|
Other (enter in chat box as ped - nice - suggested item) |
0 |
1 |
0 |
0 |
1 |
4% |
2% |
Purpose and group size were the items selected by the majority as information that should be omitted from a national pedestrian data record. There was some discussion between webinar attendees that purpose is not as important as many trails/facilities are either used primarily by recreational users or commuters, and therefore purpose was not important. There was also mention that purpose is not included in records for vehicles. Purpose also would need to be obtained from a survey, as it is not apparent by observation.
The responses to this question have two percentages computed. The first, Respondents to question, is the percentage of respondents who selected a particular answer for this question. The second, Respondents to mandatory, is the percentage based on the number of participants who responded to the mandatory question. This was taken to represent the maximum number of people with any input to the question and was used to compensate for the fact that no guidance was provided on whether having selected mandatory a vote for nice could or not also occur.
| Question 23 | Webinar 1 | Webinar 2 | Webinar 3 | Webinar 4 | Total | Respondents to Question | Respondents to mandatory |
|---|---|---|---|---|---|---|---|
|
Station ID |
1 |
1 |
1 |
1 |
4 |
15% |
8% |
|
Location (latitude/longitude) |
0 |
1 |
0 |
1 |
2 |
8% |
4% |
|
Location (route/milepost) |
0 |
0 |
0 |
2 |
2 |
8% |
4% |
|
Location (street name/address) |
1 |
1 |
0 |
1 |
3 |
12% |
6% |
|
Date |
0 |
1 |
0 |
0 |
1 |
4% |
2% |
|
Time |
0 |
1 |
0 |
0 |
1 |
4% |
2% |
|
Direction |
0 |
1 |
1 |
2 |
4 |
15% |
8% |
|
Classifications |
1 |
2 |
0 |
2 |
5 |
19% |
10% |
|
Collection Method |
0 |
2 |
0 |
0 |
2 |
8% |
4% |
|
Interval for volume (i.e. hour, 15 minutes) |
0 |
1 |
0 |
0 |
1 |
4% |
2% |
|
Purpose |
3 |
9 |
6 |
8 |
26 |
100% |
51% |
|
Group size |
7 |
6 |
2 |
7 |
22 |
85% |
43% |
|
Weather |
0 |
2 |
0 |
1 |
3 |
12% |
6% |
|
Other (enter in chat box as ped - omit - suggested item) |
0 |
0 |
0 |
0 |
0 |
0% |
0% |
The ability to share data is based on a common understanding of the data, most typically through use of a generally accepted format. One of the items to be identified as an outcome of this project was a recommended format for bicycle volume counts.
Most attendees felt that date and time should be mandatory in a national bicycle data record. Station ID, location (latitude/longitude), interval volume, and weather were also selected by the majority of attendees to be included as mandatory information for a national bicycle data record. There were no large differences between agency types. Similar to the pedestrian data record, attendees felt that items regarding information about the count were most important for the data records. The summary table provided below has the number of times a response was selected and the percentage of respondents who selected a particular item.
| Question 24 | Webinar 1 | Webinar 2 | Webinar 3 | Webinar 4 | Total | Percentage of Respondents |
|---|---|---|---|---|---|---|
|
Station ID |
6 |
9 |
4 |
12 |
31 |
66% |
|
Location (latitude/longitude) |
6 |
11 |
8 |
5 |
30 |
64% |
|
Location (route/milepost) |
3 |
5 |
3 |
5 |
16 |
34% |
|
Location (street name/address) |
4 |
8 |
6 |
4 |
22 |
47% |
|
Date |
9 |
17 |
9 |
12 |
47 |
100% |
|
Time |
9 |
17 |
8 |
11 |
45 |
96% |
|
Classifications |
3 |
6 |
2 |
2 |
13 |
28% |
|
Collection Method |
6 |
8 |
3 |
8 |
25 |
53% |
|
Interval for volume (i.e. hour, 15 minutes) |
8 |
11 |
3 |
9 |
31 |
66% |
|
Weather |
4 |
13 |
1 |
10 |
28 |
60% |
|
Speed |
0 |
0 |
1 |
1 |
2 |
4% |
|
Purpose |
1 |
1 |
0 |
0 |
2 |
4% |
|
Other (enter in chat box as bike- mandatory - suggested item) |
0 |
1 |
0 |
1 |
2 |
4% |
Most every option was selected between 25-45% of attendees with the exception of interval for volume and station ID as information that would be nice to have in a national bicycle data record. Classifications had the largest percentage selected at 44%. Other information indicated by the attendees that would be nice to have in a national bicycle data record included helmet use, gender, lights, sidewalk versus roadway use, trail surfacing, land use characteristics, and roadway volumes. Again, the percentages and number of responses here are much lower than the percentages and responses for the items the attendees felt were mandatory, but the overall number of respondents was roughly the same.
The responses to this question have two percentages computed. The first, Respondents to question, is the percentage of respondents who selected a particular answer for this question. The second, Respondents to mandatory, is the percentage based on the number of participants who responded to the mandatory question. This was taken to represent the maximum number of people with any input to the question and was used to compensate for the fact that no guidance was provided on whether having selected mandatory a vote for nice could or not also occur.
| Question 25 | Webinar 1 | Webinar 2 | Webinar 3 | Webinar 4 | Total | Respondents to Question | Respondents to mandatory |
|---|---|---|---|---|---|---|---|
|
Station ID |
2 |
4 |
1 |
2 |
9 |
38% |
19% |
|
Location (latitude/longitude) |
4 |
4 |
0 |
6 |
14 |
58% |
30% |
|
Location (route/milepost) |
5 |
5 |
2 |
1 |
13 |
54% |
28% |
|
Location (street name/address) |
8 |
5 |
1 |
4 |
18 |
75% |
38% |
|
Date |
4 |
5 |
2 |
3 |
14 |
58% |
30% |
|
Time |
4 |
5 |
1 |
3 |
13 |
54% |
28% |
|
Classifications |
2 |
10 |
4 |
8 |
24 |
100% |
51% |
|
Collection Method |
4 |
5 |
1 |
3 |
13 |
54% |
28% |
|
Interval for volume (i.e. hour, 15 minutes) |
3 |
|
0 |
1 |
4 |
17% |
9% |
|
Weather |
4 |
5 |
6 |
3 |
18 |
75% |
38% |
|
Speed |
4 |
7 |
4 |
4 |
19 |
79% |
40% |
|
Purpose |
3 |
4 |
4 |
6 |
17 |
71% |
36% |
|
Other (enter in chat box as bike - nice - suggested item) |
0 |
2 |
1 |
1 |
4 |
17% |
9% |
Purpose and speed were the items selected by the majority of the attendees as information that should be omitted from a national bicycle data record. There was some discussion between attendees regarding speed, whether that was referring to the speed of the bicycle or the speed of the facility the bicycle was using. The speed of the facility can often be an important factor for safety analyses.
The responses to this question have two percentages computed. The first, Respondents to question, is the percentage of respondents who selected a particular answer for this question. The second, Respondents to mandatory, is the percentage based on the number of participants who responded to the mandatory question. This was taken to represent the maximum number of people with any input to the question and was used to compensate for the fact that no guidance was provided on whether having selected mandatory a vote for nice could or not also occur.
| Question 26 | Webinar 1 | Webinar 2 | Webinar 3 | Webinar 4 | Total | Respondents to Question | Respondents to mandatory |
|---|---|---|---|---|---|---|---|
|
Station ID |
1 |
1 |
2 |
0 |
4 |
12% |
9% |
|
Location (latitude/longitude) |
0 |
0 |
0 |
1 |
1 |
3% |
2% |
|
Location (route/milepost) |
1 |
1 |
0 |
1 |
3 |
9% |
6% |
|
Location (street name/address) |
0 |
0 |
0 |
1 |
1 |
3% |
2% |
|
Date |
0 |
0 |
0 |
0 |
0 |
0% |
0% |
|
Time |
0 |
0 |
0 |
0 |
0 |
0% |
0% |
|
Classifications |
3 |
1 |
0 |
3 |
7 |
21% |
15% |
|
Collection Method |
0 |
0 |
0 |
0 |
0 |
0% |
0% |
|
Interval for volume (i.e. hour, 15 minutes) |
0 |
1 |
1 |
0 |
2 |
6% |
4% |
|
Weather |
1 |
2 |
0 |
1 |
4 |
12% |
9% |
|
Speed |
6 |
5 |
2 |
3 |
16 |
48% |
34% |
|
Purpose |
3 |
15 |
7 |
8 |
33 |
100% |
70% |
|
Other (enter in chat box as bike - nice - suggested item) |
1 |
0 |
0 |
0 |
1 |
3% |
2% |
The most important items chosen as information about the count and or its location that would be useful for a bicycle/pedestrian station record selected by the majority of attendees were station ID, location (latitude and longitude), location (street name/address), start date, end date, start time, end time, method, and interval for volume. Other information indicated by attendees that would be beneficial to have about the count and or its location include bicycle facility type, pavement type, pavement condition, lighting, and surrounding land use and facilities.
This question was not asked as a multiple choice in the first webinar, but rather as a free form discussion.
| Question 27 | Webinar 2 | Webinar 3 | Webinar 4 | Total | Percentage of Respondents |
|---|---|---|---|---|---|
|
Station ID |
10 |
8 |
11 |
29 |
97% |
|
Location (latitude/longitude) |
13 |
7 |
9 |
29 |
97% |
|
Location (route/milepost) |
7 |
3 |
5 |
15 |
50% |
|
Location (street name/address) |
12 |
9 |
5 |
26 |
87% |
|
Start Date |
12 |
9 |
9 |
30 |
100% |
|
End Date |
11 |
9 |
9 |
29 |
97% |
|
Start Time |
10 |
7 |
7 |
24 |
80% |
|
End Time |
11 |
7 |
7 |
25 |
83% |
|
Method |
10 |
8 |
9 |
27 |
90% |
|
Equipment make/model for automated equipment |
7 |
3 |
2 |
12 |
40% |
|
Equipment technology for automated equipment |
3 |
5 |
4 |
12 |
40% |
|
Classification scheme |
3 |
4 |
3 |
10 |
33% |
|
Interval for volume (i.e. hour, 15 minutes |
7 |
9 |
9 |
25 |
83% |
|
Weather |
9 |
5 |
6 |
18 |
67% |
|
Speed |
1 |
2 |
0 |
3 |
10% |
|
Purpose |
0 |
0 |
0 |
0 |
0% |
|
Other (enter in chat box as bike- omit - suggested item) |
2 |
0 |
1 |
3 |
10% |
Subsequent to the interactive webinars, a series of more detailed one-on-one discussions were held. Individuals were selected for these discussions because of their extensive and or unique experience on the subject, as discovered through the Task 1 literature review, the webinars, or both. Each of the selected individuals was contacted by phone and asked if he or she would be willing to participate in a more detailed interview to obtain specific information about their experience, practice, and recommendations. The last webinar was held on September 21 2011, and the phone interviews were conducted between September 26 and October 3, 2011. E-mail requests to potential international survey participants were sent on September 30, 2011.
A list of scripted questions was prepared for the discussions to create some degree of consistency, though interviewees were encouraged to provide more information about any aspect of their experience and topics varied to some degree based on the individuals' areas of interest and expertise. Among the targeted discussion topics were the following:
The questions asked of the participants were submitted to the FHWA prior to being asked of the survey participants. These questions are provided below:
The individuals who agreed to provide input are shown in Table 8.
Table 8. Individual Discussion Participants
| Organization/Agency | Individual | Title/Position |
|---|---|---|
|
Colorado Department of Transportation |
Ms. Liz Stolz |
Traffic Analysis Unit Manager |
|
Minnesota Department of Transportation |
Ms. Lisa Austin |
Bicycle and Pedestrian Planner |
|
City of Boulder, Colorado |
Mr. Michael Sweeney |
Transportation Operations and Planning Coordinator |
|
City of St. Petersburg, Florida |
Ms. Cheryl Stacks |
Bicycle and Pedestrian Coordinator |
|
San Francisco County Transportation Authority |
Ms. Elizabeth Sall |
Acting Deputy Director for Technology Services |
|
University of California, Berkeley |
Dr. Robert Schneider |
Researcher |
|
Texas Transportation Institute |
Mr. Shawn Turner |
Division Head |
|
Transport for London |
Mr. Brett Little |
Manager, London Pedestrian Monitoring Program |
The list of scripted questions was prepared for the discussions to create some degree of consistency, though interviewees were encouraged to provide more information about any aspect of their experience and topics varied to some degree based on the individuals' areas of interest and expertise. Among the targeted discussion topics were the following: general count program experience, specific technologies used or tested, observed problems with inaccuracies, the potential role of "active" data collection, best uses for count data (particularly related to safety, funding, and facility design), and best practices for both storing/sharing data and extrapolating to system-wide or network-wide counts.
The breakdown of principal topic areas by practitioner is shown in Table 9.
Table 9. Practitioners and Principal Topics
| Practitioner | Technology Evaluation | Video Counting | Count Programs | Sampling | Factoring | Count Accuracy |
|---|---|---|---|---|---|---|
|
Ms. Lisa Austin |
X |
X |
X |
|||
|
Ms. Cheryl Stacks |
Manual |
X |
||||
|
Dr. Robert Schneider |
X |
X |
X |
X |
X |
|
|
Ms. Elizabeth Sall |
X* |
|||||
|
Mr. Michael Sweeney |
X |
X |
||||
|
Mr. Shawn Turner |
X |
X |
X |
X |
X |
|
|
Ms. Liz Stolz |
X |
X |
X |
|||
|
Mr. Brett Little |
CCTV |
*Active data collection
Ms. Austin is a Bicycle and Pedestrian Planner for the Minnesota Department of Transportation. Minnesota has been the site of much bicycle and pedestrian monitoring research over the past decade and, while she has not directly tested or evaluated any specific count technologies, Ms. Austin and her agency are well-informed of and highly interested in the subject. Minnesota DOT is just beginning a new research project related to bicycle and pedestrian counting, and Ms. Austin believes the timing of this FHWA research is perfect for her agency and others around the United States.
Ms. Austin described research conducted in Minnesota several years ago that tested video recognition software. Video recognition is able to establish user types, but the consensus was that the technology was not yet ready for widespread implementation because there is no standard manual for use and it requires a good bit of "cockpit intelligence" on the part of the user. Another recent research project conducted by the University of Minnesota described the pros and cons of existing count technologies. Research conducted in Minneapolis regarding bicycle and pedestrian activity levels shows the same general trends as the American Community Survey. Based on this research, Ms. Austin suggests that adjustments to the peak periods identified through the National Bicycle and Pedestrian Documentation Project are warranted. Furthermore, she stresses the importance of agencies conducting at least some 24-hours counts to verify shorter-term counts. She believes that adjustment factors will always be needed to account for automated technologies' undercounting of bicyclists and pedestrians traveling in groups.
Minnesota DOT is currently more interested in in-road counts than with trail counts, recognizing that the former is more difficult. Another area of interest is whether there is a maximum appropriate level of detail for state DOTs with regard to collecting and disseminating bicycle and pedestrian count data. Among the valuable uses for bicycle and pedestrian count data, Ms. Austin notes investment decisions, analysis of trends, knowing what level of service is being provided, tracking benefits related to tourism and economic development, the impacts of building complete streets (before and after studies), safety analysis (particularly for gathering exposure data), and determining complete street facility types based on variations in demand.
As the City of St. Petersburg's Bicycle and Pedestrian Coordinator, Ms. Stacks oversees an ambitious city-wide bicycle count program. The City conducts routine counts for its bike lane locations, of which there are several dozen. The counts are rotated by City region, such that each location is counted every six months on average. Before and after counts are routinely performed when a new bike lane is installed. In addition, counts occur on demand in response to particular incidents or citizen inquiries. The counts are performed using pneumatic tubes and are conducted for an entire week. Two City staff members from the traffic unit install the equipment and one picks it back up, thereby requiring little effort on the part of the City.
St. Petersburg also conducts pedestrian counts, but only on its system of shared use paths. These counts are conducted using battery-operated cameras placed on utility poles. The cameras allow for remote viewing, with the operator having the ability to tilt and zoom the view as needed. The cameras record digital still photos every one-half second, but the resolution is not particularly good. Ms. Stacks reports that it takes a staff person two to three hours to reduce a day's worth of video data because of the ability to fast forward.
Ms. Stacks reports that she has not observed inaccuracies resulting from group travel, but inaccuracies have resulted from vandalism of the tube counters and from the location of the "before" counts when motorists drive over the bicycle counters in the shared lane environment. In addition, the City has grappled over the treatment of strollers (not knowing whether the stroller counts as a pedestrian or even if it necessarily contains a child) and with the classification of certain vehicles such as motorized bicycles.
Among the safety-related benefits of the City's count program, Ms. Stacks notes that enforcement activities can be stepped up in high activity areas. The City sometimes uses the counts as a way to bolster Transportation Enhancements funding because the level of use is seen as a justification for new facilities.
Dr. Schneider, a researcher for UC Berkeley's SafeTREC, is the author of several research reports that were reviewed as part of the Task 1 literature review. In 2005, he was the Project Manager for an FHWA project that identified nationwide bicycle and pedestrian data collection trends. While the research, which explored plans and programs in 29 U.S. communities, was broader than just counting/monitoring-based data collection, it did include communities which were early adapters of using technologies such as inductive loops, pneumatic tubes, piezometric film, and active and passive infrared detectors for the purpose of counting bicyclists and or pedestrians.
In 2008, Dr. Schneider conducted research for Alameda County, California that used a combination of two-hour manual counts and automated infrared counts at intersections. One outcome of the research was a set of temporal adjustment factors used to extrapolate the short-term counts to longer-term pedestrian volumes. These adjustment factors use weather data that corresponded to the actual times of the manual counts. Dr. Schneider suggests that these temporal factors from Alameda County are probably not transferable enough nationwide for a Traffic Monitoring Guide type of application, but he notes that they are likely just as good as what is used currently for the auto mode.
The comparison of manual and automated counts from Alameda County initially suggested that undercounting was relatively minimal and did not vary significantly between low-volume and high-volume locations. However, more recent follow-up research that Dr. Schneider conducted for the San Francisco Municipal Transportation Agency indicates that undercounting remains consistent (and low) at lower pedestrian volumes but reaches 40-50% in crowded locations. As a result, he suggests that if adjustment factors are created to account for undercounting, the adjustment should not be linear (i.e. they could be exponential as a function of the pedestrian volume) and might not be transferable to all locations. A related observation from both studies is that infrared detector counts can be affected by people walking back and forth. This means that sorting through the data is not an automatic process and that placing counters near bus stops or other similar locations is not ideal.
Dr. Schneider also has experience evaluating inductive loop counts for the bicycle mode, citing an accuracy rate of 90-95%. He mentioned that Eco-counter has a bicycle/auto filter that works well for shared lane environments. Further, he noted that adjustment factors can be developed to account for sidewalk riding that is missed by in-roadway inductive loops.
Regarding active data collection, Dr. Schneider believes it would have to be used for a very specific purpose, not for traffic monitoring or pure volume counts, in order to be appropriate, citing the problems of sampling bias and behavioral changes that result from participants knowing that their habits are being observed.
Dr. Schneider believes that a key element of bicycle and pedestrian monitoring is capturing exposure data for crash analysis. He states that simply knowing how many people are bicycling and walking is important to overcome general public unawareness and the perception that these modes of transportation may be trivial. Regarding facility design, Dr. Schneider suggests that count data can be used not only for roadway cross section allocation, but also for appropriate signal timing.
Regarding the sharing of data, Dr. Schneider believes that a standard count record, in which very basic things are identified for every agency to collect, is how it almost has to be done. He recognizes that this is tough to do, and that the flexibility to allow participating agencies to collect additional information is important. He believes that in such a program FHWA should actually be responsible for acquiring the actual data rather than having the local agency, which would only submit the location and raw count, to it.
Ms. Sall is a Principal Transportation Planner and the Acting Deputy Director for Technology Services for SFCTA. She was chosen for a discussion because of the desire to have a representative with extensive experience related to active bicycle and pedestrian data collection. Ms. Sall works with SFTCA's CycleTracks, which is a GPS-based smartphone application used to record users' bicycle route choices.
Ms. Sall was asked about the potential application of CycleTracks or other related active data collection applications within a broad traffic monitoring context. In the case of CycleTracks, she explained that the ultimate goal is to be able to create a bicycle travel demand model, not to validate or explain what is happening on the ground. Ultimately, Ms. Sall confirms what other interviewees and webinar participants have expressed by saying that any program in which a user has to opt in is not appropriate for the aims of FHWA. This is based on the commonly noted problem of having to possess a smartphone in order to enter data, which leads to a lack of good representation of what is really happening on an area's street or trail system.
Ms. Sall notes that there are many ways to be more "big brother-ish," and that one of the less invasive techniques is Bluetooth-based monitoring, something that is currently done for speed monitoring more than for activity counts. She suggests that a survey would be needed for correction factors, and that it would ultimately become more passive than active in nature.
Mr. Sweeney is the City of Boulder's Transportation Operations and Planning Coordinator. The City of Boulder is well-known for its efforts in promoting non-motorized transportation, as summarized by Mr. Sweeney in citing a general City policy to "enhance mobility through alternative modes of transportation." The City therefore needs metrics to determine how well the policy is working ("Boulder is fascinated with data"), which has led to an emphasis on bicycle and pedestrian monitoring. The two primary count programs are pedestrian counts performed in conjunction with intersection turning movement counts (Mr. Sweeney cites a constant struggle with the accuracy of these counts) and inductive loop-based bicycle counts on the shared use path system. The City has also experimented with video data collection, but it ultimately proved infeasible.
Boulder's bicycle monitoring program began in 1998 with the installation of twelve permanent count stations on paths. The loops generally work well, but Mr. Sweeney has experienced some problems over the years, including the following:
a. Data is sometimes lost because of power outages to the loop amps,
b. Adequate staffing is a constant struggle, which can lead to languishing of the data unless a researcher is inclined to examine it,
c. There is no standardized data validation procedure,
d. The loops are not time stamped (though times can be roughly back-calculated based on the time of the download),
e. While staff can tell if the loops fail completely, they cannot tell if they are merely off by 10%, and
f. The accuracy has been shown to deteriorate after years of use.
One of the most successful uses of the data has been the ability to compare actual ridership with travel diaries that are regularly completed by residents and employees. Mr. Sweeney also uses the data to track trends; for example, he knows that bicycle travel peaked in Boulder in 2008.
More recently a thirteenth loop, the first to be used in a roadway setting, was installed. Mr. Sweeney reports an error range of ±5% for this counter. He notes that the "inductive footprint" of bicycles is decreasing and that Eco-counter (the manufacturer of this newer detection device) does a good job of dealing with composite-material bicycles.
Mr. Sweeney is among those who cite the use of counts to measure exposure data for crash analysis rather than just the frequency of bicycle and pedestrian crashes. Another significant benefit of the City's count program is that "a lot of the debate has gone away" regarding the need to provide facilities for bicycling and walking because of the amount of use that the counts show. Ultimately, he believes that the count program is an important piece of the City's bicycle and pedestrian planning puzzle, but certainly not the whole puzzle.
Mr. Sweeney, citing the difficulty in storing and sharing count data, suggested that it would be easier to offer "not best practices" than best practices on the subject. He did indicate that the City is looking into creating web-based access to the data through a future grant.
Boulder continues to be challenged by how to either expand the count program or extrapolate the existing counts for a better city-wide estimate of use. They have considered implementing a spreadsheet-based model to do just that, but they worry about inappropriate extrapolation and wonder whether the twelve or thirteen existing locations constitute a representative sample.
Mr. Turner, in his role as a Division Head for TTI, has led or been involved in much research on the subject of bicycle and pedestrian monitoring. He is part of the research team applying existing Traffic Monitoring Guide principles to the bicycle and pedestrian modes. He cites a general philosophy that employing numerous short-term counts plus at least a couple of permanent counters for validation is the current leading approach, with the primary outstanding question being how to do that over a large bicycle and pedestrian network.
Mr. Turner's research has included projects in which he evaluated various count technologies to determine their effectiveness. He states that most of these technologies have their own issues, and that the selection of an appropriate device is highly dependent on the user and the environment in which it is deployed. Among sources of inaccuracies, Mr. Turner mentions selection of sites where people are milling about (near a trailhead, for example) or frequently traveling side by side (rather than a location where people tend to filter down to single file), as well as inductive loop detectors that receive interference from power lines, particularly for trails which run along utility corridors.
On the subject of active data collection, Mr. Turner would like to see it used more, as long as it can be calibrated somehow, because there is so much of that data "floating around" not to take advantage of it. He has experience using CycleTracks to establish travel patterns and believes that Bluetooth systems could ultimately replace intercept surveys. That said, he views active data collection as a "different piece of the (bicycle and pedestrian monitoring) puzzle."
Mr. Turner believes that bicycle and pedestrian monitoring is important for the same reasons that automobile counts are important: to show the need for facilities and appropriate accommodation. It may be even more important for the non-motorized modes because politicians and others tend to discuss bicycle and pedestrian facilities in terms of whether or not they are needed at all.
Regarding the potential for a standard count procedure, Mr. Turner is struck by the current system for storing auto travel data and believes that the bicycle and pedestrian community should be able to take advantage of that. He is aware that the Colorado Department of Transportation is doing just that by calculating reports that are already set up. He has the impression that those using the National Bicycle and Pedestrian Documentation Project system are sending data to the clearinghouse in an inconsistent format. He wonders whether someone at the Federal level should be in charge of a similar program, though it might not be mandatory.
Mr. Turner notes that extrapolation of counts is a key question, and that it is very expensive to try to do so in a responsible way. He suggests that one needs to focus on high-activity areas and recognize the inherent statistical shortcomings. More than anything, he is alarmed by some of the city-wide or region-wide count estimates he has seen that are estimated based on minimal counts (duration, locations, or both).
Mr. Turner sees the ongoing update to the Traffic Monitoring Guide as a "best first stab" at documenting procedures for bicycle and pedestrian monitoring, and he is hopeful that further research, specifically National Cooperative Highway Research Program project 7-19, will significantly improve the state-of-the-practice.
Ms. Elizabeth Stolz is the Traffic Analysis Unit Manager for the Colorado Department of Transportation (CDOT). For two and a half years she has been working with CDOT's Bicycle and Pedestrian Program to incorporate bicycle counts into their traffic monitoring program. A specification has been developed for the types of counters to be used on CDOT projects.
A Kaiser Grant was used to start the bicycle and pedestrian count program off with six permanent count stations. The Colorado Traffic Data Committee, MPOs and other planning contacts were asked to recommend locations for count stations. More than 100 responses were received in just two days. Initial screening criteria - including the recommended roadway being on a connector to a CDOT facility and a willingness on the part of the local agency to help install, maintain and review data – were used to reduce the suggested locations to a top ten list. Through site visits and further conversations with local agencies six final locations were selected to be included in the initial count program. Five movable counters are included in the program. Two of these were placed and have not been moved; consequently, there are essentially eight permanent count locations.
The type of technology deployed at Colorado count stations varies. On a trail in Broomfield, loops and infrared detectors (Eco-counter) are used to detect pedestrians and bicycles and their direction of travel. Directional data was desired at this location so options were limited. Other count stations use a single (Eco-counter) loop. On U.S. 36 near Boulder two loops are used to count bicycles on the shoulder of the roadway and within the travel lane. There have been some problems keeping infrared sites up and running.
Data are compiled at a centralized data location. Local partners submit the data in a variety of formats including spreadsheets and TrafX among others. One person at CDOT is responsible for translating all data into TRADAS software (altered for bicycle and pedestrian counts). The infrared counters were tested to determine if they could detect the number of users in a group; the results suggest undercounting.
Ms. Stolz believes some sort of group factor would be desirable. She also confirmed the need for seasonal, day of week, and facility type adjustment factors, and weather related factors. She would also like to see AADTs for bicyclists created. Ms. Stolz noted that although they are using the TRADAS software they cannot identify these factors yet. She would like to have a process for creating factors and using counts in much the same way as motor vehicle counts are used.
For long-term count stations, Ms. Stolz suggests that less than 24 hours of counts should not be included in datasets. The TRADAS software requires 12:00 – 12:00 (24 hours) of data per day. Errors have occurred during cell phone provider transitions, power outages, and during translation of local partner data.
Ms. Stolz related that another data collection error occurred with their infrared counter. It reported 30,000 users in a day on a facility known to have approximately 2,500 users per day.
Ms. Stolz does believe that active data collection efforts (using GPS-enabled devices) will be used in a national bicycle and pedestrian monitoring program. She does not, however, foresee such a data collection effort being administered through the CDOT Traffic Analysis Program.
With regard to how the data can be used to address safety, funding and design topics, Ms. Stolz gave several examples. The City of Durango used counts to justify adjustments to signal timing for bicyclists. Count stations have also been used to justify snow plowing of trails; counts reveal 100–200 users will use trails where snow has fallen if the trails are plowed. Because of bicycle counts, Boulder is considering building a trail adjacent to a 60 mph roadway. She also observed that some funding – that uses either incentives or mandates – would require counts.
Ms. Stolz also indicated that for a DOT count program to be useful, there must be a centralized data warehouse.
Based on the international portion of the Task 1 literature review, several international practitioners were identified for potential inclusion in this series of one-on-one discussions. Ultimately, only one of the contacted individuals (Mr. Brett Little of the City of London, United Kingdom's transportation agency) responded, and he provided his experiences electronically.
Mr. Little researched, procured, and implemented London's Pedestrian Monitoring Programme. He researched the effectiveness of both infrared and closed-circuit television (CCTV) programs and ultimately employed CCTV, a video-based technology, for use in London's program. While the City's program is generally working well, Mr. Little notes several sources of inaccuracies including power failures, removal of poles that the cameras were mounted on, and construction work that obstructs the camera view for periods of time. Recognizing potential inaccuracies related to traveling in groups, the chosen CCTV technology includes an adjustment factor that is believed to be representative of reality.
Among London's uses of pedestrian monitoring data, Mr. Little cites the illustration in real terms of the numbers of pedestrians using routes and crossing facilities, which in turn influences both safety and design. Counts are also used as a justification of where to allocate resources and funding.


