U.S. Department of Transportation
Federal Highway Administration
1200 New Jersey Avenue, SE
Washington, DC 20590
202-366-4000
Federal Highway Administration Research and Technology
Coordinating, Developing, and Delivering Highway Transportation Innovations
| REPORT |
| This report is an archived publication and may contain dated technical, contact, and link information |
| Publication Number: FHWA-HRT-10-035 Date: September 2011 |
Publication Number: FHWA-HRT-10-035 Date: September 2011 |
HTML Version of Errata for FHWA-HRT-10-035
PDF Version of Errata (84.0 KB)
PDF files can be viewed with the Acrobat® Reader®
The dynamic modulus, |E*|, is a fundamental property that defines the strain response characteristics of asphalt concrete mixtures as a function of loading rate and temperature. The significance of this material property is threefold. First, it is one of the primary material property inputs in the Mechanistic Empirical Pavement Design Guide (MEPDG) and software developed by National Cooperative Highway Research Program Project 1-37A.(1,2) MEPDG uses a master curve and time-temperature shift factors in its internal modulus computation.(1) In MEPDG, the master curve is constructed using a hierarchical structure of inputs ranging from estimates based on mixture volumetrics and binder tests to full-scale mixture |E*| testing. |E*| is one of the primary properties measured in the Asphalt Mixture Performance Test protocol that complements the volumetric mix design.(3,4) Additionally, it is one of the fundamental linear viscoelastic material properties that can be used in advanced pavement response models based on viscoelasticity.
Given the significance of |E*|, this study evaluated existing prediction models, developed new models, and populated the Long-Term Pavement Performance database to provide a valuable data source for the pavement community. Supplementing the full suite of material properties, performance history, traffic, and climate with |E*| estimates will be advantageous in conducting MEPDG calibration, validation, and implementation.
Jorge E. Pagán-Ortiz
Director, Office of Infrastructure
Research and Development
This document is disseminated under the sponsorship of the U.S. Department of Transportation in the interest of information exchange. The U.S. Government assumes no liability for the use of the information contained in this document. This report does not constitute a standard, specification, or regulation.
The U.S. Government does not endorse products or manufacturers. Trademarks or manufacturers' names appear in this report only because they are considered essential to the objective of the document.
The Federal Highway Administration (FHWA) provides high-quality information to serve Government, industry, and the public in a manner that promotes public understanding. Standards and policies are used to ensure and maximize the quality, objectivity, utility, and integrity of its information. FHWA periodically reviews quality issues and adjusts its programs and processes to ensure continuous quality improvement.
Technical Report Documentation Page
| 1. Report No.
FHWA-HRT-10-035 |
2. Government Accession No. | 3 Recipient's Catalog No. | ||
| 4. Title and Subtitle
LTPP Computed Parameter: Dynamic Modulus |
5. Report Date September 2011 |
|||
| 6. Performing Organization Code | ||||
| 7. Author(s)
Y. Richard Kim, B. Underwood, M. Sakhaei Far, |
8. Performing Organization Report No. 1240.10 |
|||
9. Performing Organization Name and Address Nichols Consulting Engineers, Chtd. |
10. Work Unit No. (TRAIS) |
|||
11. Contract or Grant No. DTFH61-02-D-00139 |
||||
| 12. Sponsoring Agency Name and Address
Turner-Fairbank Highway Research Center |
13. Type of Report and Period Covered
Final Report |
|||
14. Sponsoring Agency Code
|
||||
15. Supplementary Notes Prepared in cooperation with the U.S. Department of Transportation, the Contracting Officer’s Technical Representative (COTR) was Larry Wiser, Long-Term Pavement Performance Team. |
||||
| 16. Abstract
The dynamic modulus, |E*|, is a fundamental property that defines the stiffness characteristics of hot mix asphalt (HMA) mixtures as a function of loading rate and temperature. In spite of the demonstrated significance of |E*|, it is not included in the current Long-Term Pavement Performance (LTPP) materials tables because the database structure was established before |E*| was identified as the main HMA property in the Mechanistic Empirical Pavement Design Guide (MEPDG). The objective of this study was to use readily available binder, volumetric, and resilient material properties in the LTPP database to develop |E*| estimates. This report provides a thorough review of existing prediction models. In addition, several models have been developed using artificial neural networks for use in this project. This report includes assessments of each model, quality control checks applied to the data, and the final structure and format of the dynamic modulus data added to the LTPP database. A program was also developed to assist in populating the LTPP database, and the details of the program are provided in |
||||
| 17. Key Words
Dynamic modulus, MEPDG, LTPP, Hot mix asphalt, Artificial neural network (ANN) |
18. Distribution Statement
Document is available to the U.S. public through the National Technical Information Service, Springfield, VA, 22161 |
|||
19. Security Classification Unclassified |
20. Security Classification Unclassified |
21. No. of Pages 263 |
22. Price | |
| Form DOT F 1700.7 | Reproduction of completed page authorized |
SI* (Modern Metric) Conversion Factors
*SI is the symbol for the International System of Units. Appropriate rounding should be made to comply with Section 4 of ASTM E380.
(Revised March 2003)
| A | Regression intercept |
|---|---|
| AASHTO | American Association of State Highway and Transportation Officials |
| AC | Asphalt concrete |
| ALF | Accelerated loading facility |
| AMPT | Asphalt mixture performance tester |
| ANN | Artificial neural network |
| ANNACAP | Artificial Neural Networks for Asphalt Concrete Dynamic Modulus Prediction |
| ASTM | American Society for Testing and Materials |
| A-VTS | Regression intercept-regression slope of viscosity temperature susceptibility |
| BBR | Bending beam rheometer |
| CAM | Christensen Anderson Marasteanu |
| DSR | Dynamic shear rheometer |
| FHWA | Federal Highway Administration |
| G-GR | |G*| binder and gradation-based |
| GPL | Generalized power law |
| GPS | General Pavement Study |
| GR | Gradation |
| G-V | Preliminary |G*|-based model used in phase 1 of the study |
| GV | |G*|-based model using consistent aged binder data |
| GV-PAR | |G*|-based model using inconsistent aged binder data of pressure-aging vessel and rolling thin film oven aging conditions |
| HMA | Hot mix asphalt |
| IDT | Indirect tensile |
| LOE | Line of equality |
| LTOA | Long-term oven aging |
| LTPP | Long-Term Pavement Performance |
| LVE | Linear viscoelastic |
| MEPDG | Mechanistic Empirical Pavement Design Guide |
| NCDOT | North Carolina Department of Transportation |
| NCHRP | National Cooperative Highway Research Program |
| NCSU | North Carolina State University |
| NMSA | Nominal maximum-sized aggregate |
| pANN | Pilot artificial neural network |
| PAV | Pressure-aging vessel |
| PG | Performance grade |
| QC | Quality control |
| R&BT | Ring and ball temperature |
| RTFO | Rolling thin film oven |
| SHRP | Strategic Highway Research Program |
| SPS | Specific Pavement Study |
| STOA | Short-term oven aging |
| TFHRC | Turner-Fairbank Highway Research Center |
| TP | Test protocol |
| VFA | Percentage of voids filled with asphalt |
| Visc-GR | Viscosity-gradation model |
| Visc-V | Viscosity-volumetric model |
| VMA | Percentage of voids in mineral aggregate |
| VTS | Slope of temperature susceptibility relationship |
| VV | Viscosity-based model |
| VV-grade | Viscosity-based model using specification grade of the asphalt binder as recommended in the Mechanistic Empirical Pavement Design Guide |
| WLF | Williams-Landel-Ferry Model |
| WRI | Western Research Institute |
| |E*| | Dynamic modulus |
|---|---|
| |G*| | Dynamic shear modulus |
| MR | Resilient modulus |
| t-T | Time-temperature shift factors |
| ρ200 | Percentage of aggregate passing #200 sieve |
| ρ4 | Percentage of aggregate retained #4 sieve |
| ρ3/8 | Percentage of aggregate retained 3/8-inch sieve |
| ρ¾ | Percentage of aggregate retained ¾-inch sieve |
| Va | Percentage of air void |
| Vbeff | Percentage of effective asphalt content (by volume of mix) |
| f | Loading frequency |
| η | Binder viscosity |
| |G*|b | Dynamic shear modulus of asphalt binder |
| δb | Binder phase angle associated with |G*|b |
| fs | Dynamic shear frequency |
| T | Temperature |
| TR | Temperature in Rankine scale |
| |E*|m | Dynamic modulus of hot mix asphalt (pounds per square inch) |
| Pc | Aggregate contact volume |
| ø | Phase angle of hot mix asphalt |
| |G*|g | Dynamic shear modulus of asphalt binder at the glassy state |
| Vmix | Air voids by volume of the mix |
| ω | Angular frequency in radians per second |
| t | Time |
| fR | Reduced frequency |
| me | Fitting coefficient |
| k | Fitting coefficient |
| δ | Binder phase angle (degree) |
| Gmb | Bulk specific gravity |
| Gmm | Maximum specific gravity |
| SSE | Sum of squared error |
| Sy | Standard deviation |
| Se | Standard error |
| σa | Applied stress |
| εr | Recoverable strain |
| ν | Poisson's ratio |
| P | Applied load |
| U | Recoverable horizontal displacement |
| V | Recoverable horizontal displacement |
| k1 | Constant value in NCHRP 1-28 elastic solution for Poisson's ratio |
| k2 | Constant value in NCHRP 1-28 elastic solution for Poisson's ratio |
| k3 | Constant value in NCHRP 1-28 elastic solution for Poisson's ratio |
| k4 | Constant value in NCHRP 1-28 elastic solution for Poisson's ratio |
| E | Young's modulus |
| D | Compliance |
| R | Radius of specimen |
| χ | Horizontal distance from center of specimen |
| E' | Storage modulus |
| E" | Loss modulus |
| E∞ | Equilibrium modulus |
| ωr | Angular reduced frequency |
| Ei | Modulus of the ith Maxwell element |
| ρi | Relaxation time of the ith Maxwell element |
| Akj | Matrix element in the kth row and jth column of matrix A |
| Bk | Vector element in the kth row of vector B |
| τj | Retardation time of the jth Voigt element determined a priori |
| tk | Time of interest |
| α1 | Shift factor coefficient 1 |
| α2 | Shift factor coefficient 2 |
| α3 | Shift factor coefficient 3 |
| (log|E*|ANN)i | Logarithm of the modulus determined from the ANN models at a particular temperature frequency combination |
| (log|E*|fit)i | Logarithm of the modulus determined from the optimized sigmoidal fit |
| (log|E*|avg)i | Logarithm of the average modulus determined from the ANN models for a given layer |
| A | Intercept of temperature susceptibility relationship |
| Tcritical | Temperature in Rankine at which the viscosity is exactly equal to 2.7 x 10¹² cP (0.0027 x 10¹² Pas) |
| PEN | Penetration number at given test temperature |
| ν | Kinematic viscosity (cSt) |
| ρ | Density (oz/in3 (g/cm3)) |
| aT | Time-temperature shift factor |
| ωT | Frequency at the physical temperature |
| ωTR | Reduced frequency of ωT at the reference temperature |
| ωc | Fitting coefficient |
| C1 | Fitting coefficient |
| C2 | Fitting coefficient |
| C3 | Fitting coefficient |
| S(t) | Beam stiffness |
| D0 | Regression coefficient |
| D1 | Regression coefficient |
| |D*| | Dynamic axial creep compliance |
| ∂|G*|/∂T | Derivative |G*| with respect to time |
| E(t) | Uniaxial relaxation modulus |
| E'(ω) | Storage modulus |
| D(t) | Creep compliance |
| KT | Temperature factors |
| Kω | Frequency factors |
| β1 | Second order polynomial coefficient |
| β2 | Second order polynomial coefficient |
| β3 | Second order polynomial coefficient |
| f(T) | Transfer function |
| Value of the nodes at the first hidden layer | |
| Transferred value of the nodes at the first hidden layer | |
| Value of the nodes at the second hidden layer | |
| Transferred value of the nodes at the second hidden layer | |
| Value of output node l (MR ANN) | |
| Value of the output node (GV ANN and VV ANN) | |
| Transferred value of the output node l, normalized output (MR ANN) | |
| Transferred value of the output node, normalized output (GV ANN and VV ANN) | |
| Pi | Input variables |
| Weight factors for the first hidden layer | |
| Weight factors for the second hidden layer | |
| Bias factors for the first layer | |
| Bias factors for the second layer | |
| Bias factors for the outer layer (MR ANN) | |
| B0 | Bias factor for the outer layer (GV ANN and VV ANN) |
| (Sigl)max | Maximum value for sigmoidal coefficient l in the trained data (MR ANN) |
| (Sigl)min | Minimum value for sigmoidal coefficient l in the trained data (MR ANN) |
| log |E*|max | Maximum log |E*| of the trained data (GV ANN and VV ANN) |
| log |E*|min | Minimum log |E*| of the trained data (GV ANN and VV ANN) |
| Normalized value for given input variable, i | |
| MINi | Minimum value of variable, i, in calibration dataset |
| MAXi | Maximum value of variable, i, in calibration dataset |
| Sig1 | First sigmoidal function coefficient |
| Sig2 | Second sigmoidal function coefficient |
| Sig3 | Third sigmoidal function coefficient |
| Sig4 | Fourth sigmoidal function coefficient |
| Resilient modulus at 41° F (5 °C), MPa | |
| Resilient modulus at 77° F (25 °C), MPa | |
| Resilient modulus at 104° F (40 °C), MPa | |
| R | Coefficient in WLF function |
| Ea | Coefficient in WLF function |
| tR | Inverse of reduced frequency of loading (Hz) |
| δ | Sigmoidal function fitting coefficient |
| β | Sigmoidal function fitting coefficient |
| D' | First vector component of |D*| |
| D" | Second vector component of |D*| |
| Vbe | The effective volume of the binder |
The dynamic modulus, |E*|, is a fundamental property that defines the stiffness characteristics of hot mix asphalt (HMA) mixtures as a function of loading rate and temperature. Given the significance of |E*| in pavement engineering, this project was undertaken to provide the Long-Term Pavement Performance (LTPP) database with |E*| estimates using material properties currently available for LTPP test sections. In this report, existing models used to estimate |E*| values and additional models that have been developed based on the use of artificial neural networks (ANNs) were evaluated. Using the results of the model evaluation, the research team developed a model selection hierarchy and populated the LTPP database with |E*| estimates at five temperatures and six frequencies. It also developed shift factors and sigmodial functions that can be used to construct mastercurves.
The seven models identified at the outset of this project as potentially suitable for the task at hand include the following:
The existing predictive models (1–4 above) are collectively referred to in this report as “closed-form models.” Specific comparisons are drawn regarding their forms and required input parameters.
An extensive independent database was required to develop the ANN models and to fairly assess the predictive capabilities of each model in the list of possible models. At the outset of the project, the most comprehensive material database available was compiled through the efforts of Dr. Matthew Witczak at Arizona State University. Witczak's database consists of 7,400 data points from 346 mixtures, all of which were used in the calibration of the NCHRP 1-40D predictive models.(5) A smaller subset of the data (2,750 data points from 205 mixtures) was also used in developing the NCHRP 1-37A predictive model.(2) In addition, the database contains |G*| data obtained from different materials and aging conditions. Through this research project, the Witczak database was combined with mixtures from other national projects and efforts undertaken at North Carolina State University (NCSU). The expanded mixture database currently includes 22,505 data points.
In addition to a mixture database, binder properties were compiled into a similarly expansive database. Substantial efforts have been expended to develop the appropriate binder data processing techniques. The required processing varied depending on the type of data available (i.e., |G*|, viscosity, or binder grade). Only the critical points are presented in this report, and the details are provided in the appendices.
Closed-form models were compared using datasets that were not used in the calibration of the respective models. It was found that the law of mixtures parallel model shows a significant bias, but the Hirsch model shows reasonable predictions, except for insensitivity under extreme conditions.(7,6) For the verification database, the Hirsch model shows slightly better statistical predictions than either of the Witczak models.(6) This finding, along with other statistical analyses, led the research team to adopt the Hirsch model input parameters into the viscosity-based (VV) and |G*|-based ANN models.
Comparisons between the ANN models and the closed-form models were made. Overall, the ANN models provide better predictability than any of the closed-form solutions. Additionally, the ANN models are more sensitive to the input parameters. Based on these findings, the ANN models were chosen to populate the LTPP database moduli values. The primary advantage of using ANN modeling over statistical regression techniques is that the functional form of the relationship is not needed a priori. Considering that many variables affect |E*| values and their interactions, the ANN technique may capture complicated nonlinear relationships between |E*| and other mixture variables better than regression analysis.
Early in the project, concerns arose because the database combined moduli that had been measured using two different methods, the American Association of State Highway and Transportation Officials (AASHTO) test protocol (TP)-62 and the asphalt mixture performance tester (AMPT) protocol.(8,9,4) A study of the available databases revealed that the mixtures that are tested according to the AASHTO TP-62 protocol tend to yield higher moduli values than similar mixtures tested using the AMPT protocol. Statistical analysis to assess the significance of the difference was not performed, but the two data ranges tend to overlap, suggesting a lack of statistical significance in their differences. A limited experimental study wherein the modulus of a single mixture was measured using the two protocols is also discussed. The study shows a statistically significant difference of about 12 percent in the measured moduli across all studied temperatures and frequencies. However, in light of the fact that both protocols are readily available and that neither of the available protocols can be discounted without a more comprehensive and controlled experimental program, the decision was made to include all available data from both the AMPT protocol and AASHTO TP-62 in the calibration process.
Details of the three ANN models, including the required input parameters, model structure, and input range, are presented in this report. The models are prioritized based on engineering judgment and statistical analysis. From this prioritization, a decision tree was developed for populating |E*| of the LTPP layers (see figure 1). A user may follow this decision structure and determine the best model to use for the available input parameters.
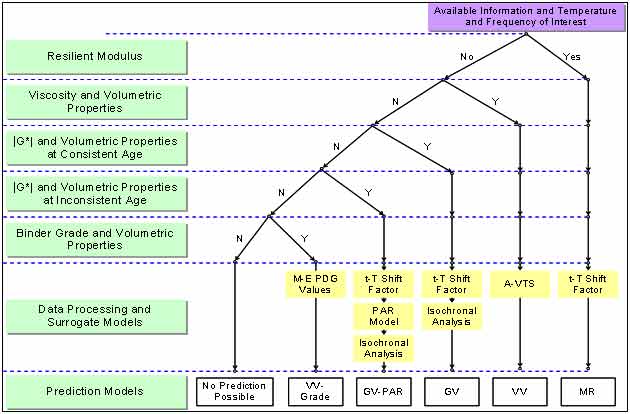
Figure 1. Illustration. Modulus prediction model decision tree.
At the end of phase I of this study, it was discovered that some State agencies report effective binder content by mass instead of by volume (i.e., gravimetric instead of volumetric). As a result, there were concerns about the use of a predictive model based on the volumetric properties of the asphalt mixtures. After reviewing the database and carrying out some volumetric computations, volumetric-based properties could still be calculated when gravimetric quantities were reported. Details of how these volumetric-based quantities were computed are provided in this report.
A key component to the prediction of moduli values is ensuring that the predicted values are rational and acceptable. To meet this criterion for the finalized ANN predictions, a set of quality control (QC) checks on both the input parameters and model predictions were performed. In total, seven QC checks were developed, one for the inputs and six for the modulus predictions, and are described in detail in section 6.2 of this report. Executable software, Artificial Neural Networks for Asphalt Concrete Dynamic Modulus Prediction (ANNACAP), was developed as part of this project for this purpose. The software can be run for individual layers (manual mode) or all layers simultaneously (batch mode). An unpublished manual for the software is provided in appendix E of this report.
Statistics for the population effort are also presented in this report. The LTPP database contains information for 1,806 layers that meet the criteria established for this project. These layers have binder data available at a combination of different aging conditions, including unaged or original-aged, rolling thin film oven (RTFO)-aged, pressure-aging vessel (PAV)-aged, and field-aged. For the field-aged data, 2,223 records are available because some layer properties have been measured at different dates. The total resulting number of records is 7,641. Using the combined ANN models and requisite internal QC checks, modulus values are predicted for 363 records/layers in the original-aged level, 469 records/layers in the RTFO-aged level, 1 record/layer in the PAV-aged level, and 503 records in the field-aged level. Combined, these numbers translate to predictions for 17.5 percent of the total number of records available. However, these records are distributed in such a way that a higher percentage of the layers has some sort of valid prediction. Of the 1,806 layers in the database, 1,010 layers, or 56 percent, have a modulus prediction for some aging condition. Of these 1,010 layers, 615 layers, or 34 percent of the total 1,806 layers, have reasonable predictions (i.e., an “A” grade), and 89 layers, or 4.9 percent of the total 1,806 layers, have unreasonable predictions (i.e., an “F” grade). The remaining 306 layers, representing 17 percent of the 1,806 layers, have questionable predictions (i.e., a “C” grade). Thus, the total percentage of layers with a completely valid or questionable prediction is 51 percent. The quality grading system referenced is different from the standard record status definition used in the LTPP database.(10) The research team established strict QC checks to ensure that only the highest quality data were assigned an “A” grade. The data that did not achieve an “A” grade were not considered unusable data. All predictions are included in the database so that users can determine the data that are suitable for their needs. In addition, the Federal Highway Administration (FHWA) can revise the criteria used for the quality checks as deemed appropriate based on the opinions of its experts.

