| Concrete Strength | |
Acceptance Method Used in the Prototype PRS
Concrete strength is one of the four AQC’s included in the prototype PRS developed under the previous FHWA PRS study.(1,2,3) The prototype required that flexural strength be measured directly from beam specimens or indirectly from cylinder strength tests and used for the acceptance of the as-constructed portland cement concrete (PCC) slab. The prototype PRS recommended using core testing as an indirect measure of the in situ flexural strength. With this method, cores are taken at some reference maturity equivalent (for example, 3 days at 22 °C). To provide rapid feedback to the contractor, the 28-day flexural strength is then projected from the early age in situ strength data. The inter-strength relationship between flexural and compressive strength would be established for the approved mix design (prior to construction) using project-approved aggregates, cement, and admixtures. The previous PRS study concluded that there is no statistical difference between the compressive strength of cores and cylinders cured under identical curing conditions.(3) The literature search focused on obtaining information related to these processes, as well as the typical standard deviations associated with the different strength sampling methods.
Variation of Concrete Compressive Strength
A discussion of the overall variation of in-place concrete core strengths in structures was included in a draft report prepared by the American Concrete Institute (ACI) Committee 214.(4) This report referenced findings from a previous study which reported coefficients of variation (COV) for structures as a function of one or many members, and one or many batches of concrete.(5) These findings are presented in table 1. Although these reported COV’s are specific to structures, the core COV expected in a PCC pavement is most likely close to the 13.0-percent value associated with many members and many cast-in-place batches.
Table 1. Coefficient of variation due to in-place strength variation within the structure.(4)
|
Structure Composed of: |
One Member |
Many Members |
|
|---|---|---|---|
| One Batch of Concrete |
7% |
8% |
|
|
Many Batches of Concrete |
Cast-in-place |
12% |
13% |
|
Precast |
9% |
10% |
|
The ACI Committee 214 report also includes a section dealing with the
conversion of core strengths to equivalent in-place strengths (again,
focusing on structures).(4)
The report presents an equation that is used to calculate the equivalent
compressive strength (f’C
(EQUIVALENT))
in terms of measured core compressive strength (fCORE)
and four correction factors. The correction factors account for
the effects of core length-to-diameter ratio (Fl/d),
core diameter (FDIAMETER),
moisture condition of the core (FMOISTURE),
and damage sustained during drilling (FDAMAGE).
The correcting equation is defined in equation 1.
f’C (EQUIVALENT) = Fl/d * FDIAMETER * FMOISTURE * FDAMAGE * fCORE (1)
The report also contained a table of guidelines for estimating the specific correction factors required in the equation. These values are shown in table 2.
|
Factor |
Mean Value |
COV, % |
|---|---|---|
| Fl/d: l/d ratio | ||
|
soaked |
1 – {0.117 – 4.3 * (10–4) * fcore}(2 – l/d)2 |
2.5 * (2 – l/d)2 |
|
air dried |
1 – {0.144 – 4.3 * (10–4) * fcore}(2 – l/d)2 |
2.5 * (2 – l/d)2 |
| Fdia: core diameter | ||
|
50 mm |
1.06 |
11.8 |
|
100 mm |
1.00 |
0.0 |
|
150 mm |
0.98 |
1.8 |
|
Fmc: core moisture content |
||
|
soaked |
1.09 |
2.5 |
|
air dried |
0.96 |
2.5 |
|
Fd: damage due to drilling |
1.06 |
2.5 |
- Notes: 1 To obtain the equivalent in-place concrete strength, multiply the observed core strength by the appropriate factor(s) in accordance with equation 1.
- 2 fcore is expressed in terms of MPa.
- 3 Standard soaked and air dried conditions are specified in American Society for Testing and Materials (ASTM) C 42.
Core data for one pavement project in Indiana were presented in the 1996 Hughes report titled Variability in Highway Pavement Construction.(6) This 28-day core compressive strength data consisted of 63 cores taken over a 6-week period. A statistical analysis of the data resulted in a mean and standard deviation of 35.1 and 6.0 MPa, respectively. The COV was then calculated to be 17.0 percent for this project.
A 1995 Illinois Department of Transportation (IDOT) report presented structural and pavement strength data (contained in IDOT’s MISTIC database).(7) Both structural and pavement data were included in the report because most of the mix designs were "indistinguishable." Each calculated variability is specific to one mix design, one construction year, and in some cases, one producer. Table 3 contains a summary of the reported concrete cylinder compressive strength variability data.
|
Mix Number |
Class |
Year |
n |
Mean, MPa |
Std Dev, MPa |
COV, % |
|---|---|---|---|---|---|---|
|
1 |
pavement |
1992 |
110 |
30.81 |
2.69 |
8.7 |
|
2 |
pavement |
1992 |
38 |
28.31 |
3.87 |
13.7 |
|
3 |
pavement |
1993 |
16 |
34.70 |
2.69 |
7.8 |
|
4 |
pavement |
1992 |
82 |
33.47 |
5.51 |
16.5 |
|
5 |
pavement |
1993 QA/QC |
10 |
33.21 |
3.53 |
10.6 |
|
6 |
pavement |
1993 Non-QA/QC |
8 |
31.32 |
3.84 |
12.3 |
|
7 |
pavement |
1992 Non-QA/QC |
12 |
33.14 |
3.44 |
10.4 |
|
8 |
pavement |
1991 Non-QA/QC |
18 |
29.88 |
2.75 |
9.2 |
|
9 |
pavement |
1993 QA/QC |
31 |
35.23 |
6.27 |
17.6 |
|
10 |
pavement |
1992 |
23 |
34.51 |
2.92 |
8.5 |
|
11 |
pavement |
1993 |
15 |
35.11 |
1.69 |
4.8 |
|
12 |
pavement |
1992 Non-QA/QC |
28 |
35.88 |
5.58 |
15.5 |
|
13 |
structural |
1992 |
29 |
33.07 |
4.63 |
14.0 |
|
14 |
structural |
1993 |
23 |
35.20 |
4.01 |
11.4 |
|
15 |
structural |
1992 |
94 |
32.76 |
4.61 |
14.0 |
|
16 |
structural |
1993 |
30 |
33.27 |
5.73 |
17.2 |
|
17 |
structural |
1992 |
110 |
30.81 |
2.69 |
8.7 |
|
18 |
structural |
Unknown |
40 |
35.80 |
6.34 |
17.7 |
|
19 |
structural |
Unknown |
11 |
34.58 |
9.16 |
23.9 |
|
20 |
structural |
1993 QA/QC |
34 |
29.61 |
4.72 |
16.0 |
|
Pavement Data Only Averages |
32.96 |
3.73 |
11.3 |
|||
|
Structural Data Only Averages |
33.14 |
5.23 |
15.4 |
|||
|
All Data (Pavement and Structural) Averages |
33.03 |
4.33 |
12.9 |
|||
QA/QC = Quality assurance/quality control.
An analysis of the compressive strength data in table 3 shows little difference between the averages of the pavement and structural 28-day cylinder compressive strength means (32.96 MPa for pavement and 33.14 MPa for structural concrete). The data did show, however, that greater variation (a higher standard deviation) was typically associated with the structural data (average structural standard deviation of 5.23 MPa, compared to an average pavement standard deviation of 3.73 MPa).
A 1972 paper by Darter specifically discussed compressive strength variability.(8) He presented results from a West Virginia study in which the variation from materials, sampling, and testing was investigated for seven different projects. Table 4 contains highlighted data from the West Virginia study.
Table 4. Components of 28-day compressive strength variability for seven West Virginia projects.(8)
|
Project Number |
Mean |
Overall |
Testing |
Sampling |
Materials |
||||
|---|---|---|---|---|---|---|---|---|---|
|
Std Dev, MPa |
COV, % |
Std Dev, MPa |
COV, % |
Std Dev, MPa |
COV, % |
Std Dev, MPa |
COV, % |
||
|
Paving Concrete |
|||||||||
|
1 |
32.23 |
3.76 |
11.7 |
2.60 |
8.1 |
0.63 |
0 |
2.73 |
8.3 |
|
2 |
25.89 |
2.90 |
11.2 |
2.22 |
8.5 |
0.29 |
0 |
1.86 |
7.1 |
|
3 |
25.65 |
3.96 |
15.5 |
2.19 |
8.5 |
— |
— |
3.41 |
13.3 |
|
4 |
32.82 |
3.22 |
9.8 |
1.38 |
4.2 |
0.23 |
0 |
2.90 |
8.8 |
|
5 |
32.32 |
5.05 |
16.5 |
4.03 |
12.5 |
— |
— |
3.76 |
11.7 |
|
Structural Concrete |
|||||||||
|
1 |
29.20 |
3.00 |
10.0 |
1.17 |
4.0 |
1.63 |
5.6 |
2.14 |
7.2 |
|
2 |
30.47 |
3.32 |
10.9 |
2.23 |
7.3 |
0.27 |
0 |
2.48 |
8.1 |
|
Paving Data Only Averages |
3.78 |
12.9 |
2.48 |
8.4 |
0.39 |
— |
2.93 |
9.8 |
|
|
Structural Data Only Averages |
3.16 |
10.5 |
1.70 |
5.7 |
0.95 |
2.8 |
2.31 |
7.7 |
|
|
All Data (Pavement and Structural) Averages |
3.60 |
12.2 |
2.26 |
7.6 |
0.61 |
0.8 |
2.75 |
9.2 |
|
The data from these seven projects show an average overall project standard
deviation of 3.60 MPa and a corresponding overall project average COV
of 12.2 percent. Darter noted that the sampling and testing error
make up a significant portion of the overall variation, and the materials
COV is about three-fourths of the overall COV. Figure 1 illustrates
the relationships among the materials, sampling, and testing standard
deviations. It is important to note that the standard deviations
are not additive; therefore, the sum of the standard deviation shown does
not equal the overall standard deviation of the concrete strength.(9)
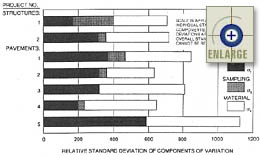 |
Figure 1. PCC relative standard deviation of components of variation for compressive strength.(9) |
Similar data was presented in a 1973 report by Di Cocco.(10) He analyzed 28-day cylinder compressive test data from nine projects (the data included concrete placed using three different mixer types—central mixer, paver, and truck mixer). The results showed an overall standard deviation of 4.98 MPa for the nine projects.
Darter also combined 28-day cylinder compressive strength data from 11 different sources—a total of 56 projects in all. It is important to note that the data are comprised of test values in which one test represents the average of three replicate cylinder tests. The data collected for these 56 projects are presented in table 5. The data show an average overall project standard deviation of 3.72 MPa (averages of three cylinder tests) and an average overall project COV of 12.1 percent.
Table 5. Summary of 28-day cylinder compressive strength statistics of various projects.(8)
|
Project Number |
Class |
No. of Tests |
Mean, MPa |
Std. Dev., MPa |
COV, % |
|---|---|---|---|---|---|
|
1 |
pavement |
536 |
31.19 |
2.73 |
8.8 |
|
2 |
pavement |
292 |
33.65 |
3.72 |
11.1 |
|
3 |
pavement |
96 |
39.20 |
3.75 |
9.6 |
|
4 |
pavement |
192 |
38.11 |
3.90 |
10.2 |
|
5 |
pavement |
196 |
35.15 |
3.98 |
11.3 |
|
6 |
pavement |
112 |
33.27 |
4.19 |
12.6 |
|
7 |
pavement |
258 |
37.71 |
4.60 |
12.2 |
|
8 |
pavement |
320 |
36.16 |
4.65 |
12.9 |
|
9 |
pavement |
232 |
36.47 |
4.90 |
13.4 |
|
10 |
pavement |
176 |
33.97 |
5.00 |
14.7 |
|
11 |
pavement |
126 |
34.94 |
5.05 |
14.4 |
|
12 |
pavement |
46 |
24.13 |
3.19 |
13.2 |
|
13 |
pavement |
12 |
28.90 |
3.52 |
12.2 |
|
14 |
pavement |
12 |
28.10 |
2.18 |
7.8 |
|
15 |
pavement |
15 |
29.65 |
1.92 |
6.5 |
|
16 |
pavement |
14 |
37.48 |
4.38 |
11.7 |
|
17 |
pavement |
22 |
28.33 |
3.79 |
13.4 |
|
18 |
pavement |
27 |
36.41 |
3.30 |
9.0 |
|
19 |
pavement |
31 |
30.34 |
2.89 |
9.5 |
|
20 |
pavement |
24 |
30.45 |
2.75 |
9.0 |
|
21 |
pavement |
14 |
27.53 |
6.74 |
24.5 |
|
22 |
pavement |
25 |
28.46 |
1.99 |
7.0 |
|
23 |
pavement |
10 |
26.82 |
3.56 |
13.3 |
|
24 |
pavement |
15 |
31.76 |
3.31 |
10.4 |
|
25 |
pavement |
13 |
26.73 |
2.68 |
10.0 |
|
26 |
pavement |
93 |
29.75 |
3.56 |
12.0 |
|
27 |
pavement |
82 |
33.74 |
3.01 |
9.0 |
|
28 |
pavement |
845 |
33.45 |
5.12 |
15.3 |
|
29 |
pavement |
5318 |
31.35 |
4.36 |
13.9 |
|
30 |
pavement |
8468 |
29.35 |
4.29 |
14.6 |
|
31 |
pavement |
146 |
33.17 |
4.58 |
13.8 |
|
32 |
pavement |
39 |
29.79 |
5.01 |
16.8 |
|
33 |
pavement |
68 |
15.58 |
2.10 |
13.5 |
|
34 |
pavement |
208 |
36.19 |
3.38 |
9.3 |
|
35 |
pavement |
861 |
35.71 |
3.72 |
10.4 |
|
36 |
pavement |
296 |
40.33 |
10.62 |
25.6 |
|
37 |
pavement |
51 |
19.51 |
2.79 |
14.3 |
|
38 |
pavement |
44 |
20.13 |
3.19 |
15.8 |
|
39 |
pavement |
153 |
26.06 |
2.81 |
10.8 |
|
40 |
pavement |
87 |
23.37 |
3.80 |
16.2 |
|
41 |
pavement |
81 |
25.30 |
3.09 |
12.2 |
|
42 |
pavement |
89 |
24.13 |
2.50 |
10.4 |
|
43 |
pavement |
61 |
22.61 |
3.30 |
14.6 |
|
44 |
pavement |
19 |
32.41 |
2.09 |
6.4 |
|
45 |
pavement |
23 |
41.09 |
2.39 |
5.8 |
|
46 |
pavement |
33 |
25.17 |
2.16 |
8.6 |
|
47 |
pavement |
74 |
36.34 |
4.62 |
12.7 |
|
48 |
pavement |
44 |
30.27 |
4.01 |
13.3 |
|
49 |
pavement |
14 |
35.85 |
2.94 |
8.2 |
|
50 |
pavement |
28 |
34.68 |
4.41 |
12.7 |
|
51 |
pavement |
47 |
17.75 |
2.28 |
12.8 |
|
52 |
pavement |
63 |
22.25 |
2.96 |
13.3 |
|
53 |
pavement |
63 |
29.18 |
3.40 |
11.6 |
|
54 |
pavement |
187 |
35.64 |
4.23 |
11.9 |
|
55 |
pavement |
65 |
33.25 |
3.67 |
11.1 |
|
56 |
pavement |
90 |
40.55 |
5.12 |
12.6 |
|
Average |
— |
— |
30.87 |
3.72 |
12.1 |
Note: One test usually indicates the average of three replicate cylinders.
The standards for 28-day cylinder compressive test COV (recommended by the American Concrete Institute [ACI] in 1972) were also presented in the 1972 paper by Darter.(8) These standards are summarized in table 6. A comparison of the summary results from the 56 projects (COV of 12.1 percent) shows that the average observed project quality falls in the "Good" range. In the conclusions of his 1972 report, Darter recommends that a compressive strength COV of 15 percent be used for design.
Table 6. ACI 1972 recommended standards for 28-day cylinder compressive test COV.(8)
|
Class of Operation |
Coefficients of Variation for Different Control Standards |
|||
|---|---|---|---|---|
|
Excellent |
Good |
Fair |
Poor |
|
| Overall variations: | ||||
|
General construction |
Below 10.0 |
10.0 to 15.0 |
15.0 to 20.0 |
Above 20.0 |
|
Laboratory control |
Below 5.0 |
5.0 to 7.0 |
7.0 to 10.0 |
Above 10.0 |
| Within-test variations: | ||||
|
Field control |
Below 4.0 |
4.0 to 5.0 |
5.0 to 6.0 |
Above 6.0 |
|
Laboratory control |
Below 3.0 |
3.0 to 4.0 |
4.0 to 5.0 |
Above 5.0 |
Neaman and Laguros presented 28-day cylinder compressive strength results
from a 12.9-km project in Oklahoma.(11)
Two-hundred pairs of cylinders (400 total cylinders) were tested for the
project, resulting in an overall 28-day cylinder compressive strength
mean and standard deviation of 26.22 and 4.97 MPa, respectively.
A histogram of this strength data is presented in figure 2.
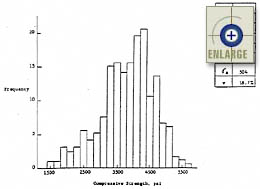 |
Figure 2. Histogram of 28-day cylinder compressive strength data for a project constructed in Oklahoma (200 pairs of 2 cylinders).(11) |
In a 1992 report, Wood presented tables of data showing normalized compressive strength means and standard deviations for different ages.(12) In addition to age, the report also looked at the influence of curing condition and type of cement. Concrete compressive strength values at 1, 3, and 7 days were normalized by dividing by the corresponding 28-day compressive strength. These results, for the four different curing conditions, are presented in tables 7 through 10.
|
Age at Test |
Type of Cement |
|||||||||||
|---|---|---|---|---|---|---|---|---|---|---|---|---|
|
I |
II |
III |
IV |
|||||||||
|
No. |
Mean, MPa |
Std. Dev., MPa |
No. |
Mean, MPa |
Std. Dev., MPa |
No. |
Mean, MPa |
Std. Dev., MPa |
No. |
Mean, MPa |
Std. Dev., MPa |
|
|
Moist Curing |
||||||||||||
|
1 day |
46 |
0.18 |
0.07 |
13 |
0.16 |
0.04 |
10 |
0.30 |
0.11 |
11 |
0.13 |
0.03 |
|
3 days |
46 |
0.46 |
0.10 |
3 |
0.35 |
0.02 |
24 |
0.62 |
0.11 |
3 |
0.24 |
0.03 |
|
7 days |
64 |
0.70 |
0.09 |
13 |
0.61 |
0.08 |
28 |
0.81 |
0.08 |
11 |
0.48 |
0.06 |
|
28 days |
64 |
1.0 |
— |
13 |
1.0 |
— |
28 |
1.0 |
— |
11 |
1.0 |
— |
Note: Data from 152-mm modified cubes and 152- x 305-mm cylinders are included.
|
Age at Test |
Type of Cement |
||||||||
|---|---|---|---|---|---|---|---|---|---|
|
IS |
IP |
IA |
|||||||
|
No. |
Mean, MPa |
Std. Dev., MPa |
No. |
Mean, MPa |
Std. Dev., MPa |
No. |
Mean, MPa |
Std. Dev., MPa |
|
|
Moist Curing |
|||||||||
|
1 day |
20 |
0.22 |
0.07 |
15 |
0.10 |
0.03 |
9 |
0.14 |
0.06 |
|
3 days |
20 |
0.42 |
0.09 |
15 |
0.32 |
0.09 |
— |
— |
— |
|
7 days |
20 |
0.62 |
0.10 |
15 |
0.53 |
0.11 |
9 |
0.69 |
0.09 |
|
28 days |
20 |
1.0 |
— |
15 |
1.0 |
— |
9 |
1.0 |
— |
Note: Data from 152-mm modified cubes and 152- x 305-mm cylinders are included.
Table 9. Variation of normalized concrete compressive strength with age—air curing.(12)
|
Age at Test |
Type of Cement |
|||||||||||
|---|---|---|---|---|---|---|---|---|---|---|---|---|
|
I |
III |
IS |
IP |
|||||||||
|
No. |
Mean, MPa |
Std. Dev., MPa |
No. |
Mean, MPa |
Std. Dev., MPa |
No. |
Mean, MPa |
Std. Dev., MPa |
No. |
Mean, MPa |
Std. Dev., MPa |
|
|
Air Curing |
||||||||||||
|
1 day |
10 |
0.16 |
0.08 |
6 |
0.24 |
0.08 |
20 |
0.21 |
0.06 |
15 |
0.10 |
0.03 |
|
3 days |
19 |
0.44 |
0.10 |
15 |
0.56 |
0.13 |
20 |
0.40 |
0.08 |
15 |
0.33 |
0.08 |
|
7 days |
19 |
0.67 |
0.09 |
15 |
0.78 |
0.10 |
20 |
0.59 |
0.08 |
15 |
0.54 |
0.10 |
|
28 days |
19 |
1.0 |
— |
15 |
1.0 |
— |
20 |
1.0 |
— |
15 |
1.0 |
— |
Note: Data from 152-mm modified cubes and 152- x 305-mm cylinders are included.
Table 10. Variation of normalized concrete compressive strength with age—outdoor exposure.(12)
|
Age at Test |
Type of Cement |
|||||
|---|---|---|---|---|---|---|
|
I |
III |
|||||
|
No. |
Mean, MPa |
Std. Dev., MPa |
No. |
Mean, MPa |
Std. Dev., MPa |
|
|
Outdoor Exposure |
||||||
|
1 day |
— |
— |
— |
— |
— |
— |
|
3 days |
21 |
0.53 |
0.10 |
21 |
0.69 |
0.15 |
|
7 days |
21 |
0.78 |
0.09 |
21 |
0.88 |
0.12 |
|
28 days |
21 |
1.0 |
— |
21 |
1.0 |
— |
Note: Data from 152-mm modified cubes.
A large amount of cylinder compressive strength data was collected at a 1993 paving project in Colorado.(13) The project consisted of 25.7 km of paving on I-70 near the town of Vona. A mean and standard deviation of 37.02 and 3.14 MPa, respectively, were calculated for the 436 cylinders tested for 28-day compressive strength. A histogram showing the testing results is presented in figure 3.
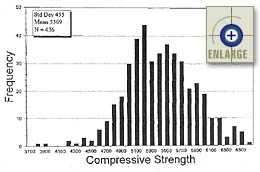 |
Figure 3. Histogram of 28-day cylinder compressive strength results—1993 project on I-70 near Vona, Colorado.(13) |
An article published by the American Concrete Pavement Association (ACPA) in 1995 discussed the typical 28-day compressive strength standard deviation expected from ready-mix plants.(14) It reported that historical records from past plant operations showed that this standard deviation could be expected to be less than 2.76 MPa for concrete coming from a well-controlled ready-mix operation. In addition, it reported that ready-mix concrete historically has COV’s in the 7- to 13-percent range, whereas COV’s for central-mix concrete generally fall in the 5- to 12-percent range.
A 1990 report contained a reprint of an article by McMahon et al. that discussed the quality assurance (QA) of PCC pavement.(9) The authors reported the following information related to concrete strength:
- Strength is not always the most important characteristic of concrete quality, but it is the one that is most often measured. It is assumed to be indicative of the water-cement ratio and, accordingly, an indicator of durability. The magnitude of the variability in strength, is, therefore, an indicator of the magnitude of variability of the other characteristics.
- Variability in concrete strengths can be attributed to two other types of variability: (1) Inherent variability in the materials and processes that results from chance causes, which cannot be controlled, and (2) variability from assignable causes that can be controlled.
- The measurement of variability from chance or inherent causes is complicated by the inherent variability of each of the ingredients in the mix, which can interact with the processes of blending, mixing, and placing, and result in a much larger variability in the concrete itself.
- The assignable causes of variability are more numerous and more difficult to isolate, but the production of quality concrete is dependent on the reduction of all variables. However, the isolation and restriction of variables can be carried only as far as economic conditions warrant. Under the present state of knowledge, the ultimate uniformity of concrete production cannot be precisely stated. Extensive research will be necessary to isolate variables and to determine the extent to which variation can be reduced.
McMahon et al. present variability data from many different published sources in their article. Table 11 summarizes their results.
Table 11. Average deviation of 28-day concrete compressive strengths.(9)
|
Agency |
Concrete Type |
Data Source |
Average Standard Deviation, MPa |
|---|---|---|---|
| Bureau of Public Roads |
Paving |
Research |
4.03 |
| Bureau of Public Roads |
Paving |
Historical |
3.26 |
| Bureau of Public Roads |
Structural |
Historical |
3.97 |
| Virginia Dept of Highways |
Structural |
Special |
3.22 |
| Virginia Dept of Highways |
Paving |
Cores |
4.57 |
| Ontario Dept of Highways |
Paving |
Routine |
3.41 |
Note: The average standard deviation is for all data presented.
Results of an analysis of historical cylinder compressive strengths by the State Road Department of Florida were also presented in the article by McMahon et al.(9) These results included data from two different concrete types (class A and class NS). It was noted that "routine control is normally exercised over class A concrete, whereas class NS concrete is spot checked only occasionally." Tables 12 and 13 contain the results from the Florida study (table 12 presents the results by project, and table 13 presents the results by concrete production source).
|
Project Number |
Number of Samples |
Mean, MPa |
Overall Std. Dev., MPa |
COV, % |
Testing Error, MPa |
|---|---|---|---|---|---|
|
28-day cylinders—class A concrete |
|||||
|
1 1 |
536 |
31.19 |
2.73 |
8.8 |
1.21 |
|
2 |
292 |
33.65 |
3.72 |
11.1 |
1.43 |
|
3 |
96 |
39.20 |
3.75 |
9.6 |
1.28 |
|
4 |
192 |
38.11 |
3.90 |
10.2 |
1.07 |
|
5 |
196 |
35.15 |
3.98 |
11.3 |
0.332 |
|
6 |
112 |
33.27 |
4.19 |
12.6 |
1.35 |
|
7 |
258 |
37.71 |
4.60 |
12.2 |
1.03 |
|
8 |
320 |
36.16 |
4.65 |
12.9 |
1.09 |
|
9 |
232 |
36.47 |
4.90 |
13.4 |
1.32 |
|
10 |
176 |
33.97 |
5.00 |
14.7 |
1.45 |
|
11 |
126 |
34.94 |
5.05 |
14.4 |
1.12 |
|
Average 3 |
230 |
35.44 |
4.23 |
13.1 |
1.23 |
|
Range |
224 |
5.93 |
1.32 |
5.1 |
0.41 |
|
28-day cylinders—NS concrete |
|||||
|
1 1 |
50 |
27.72 |
2.741 |
9.9 |
115 |
|
2 |
340 |
24.51 |
3.79 |
15.5 |
93 |
|
3 |
240 |
27.62 |
4.00 |
14.5 |
134 |
|
4 |
200 |
23.95 |
4.17 |
17.4 |
122 |
|
5 |
240 |
26.07 |
4.62 |
17.7 |
96 |
|
6 |
196 |
28.90 |
5.03 |
17.4 |
160 |
|
7 |
148 |
29.05 |
5.05 |
17.4 |
92 |
|
8 |
94 |
29.23 |
5.34 |
18.3 |
87 |
|
9 |
108 |
25.21 |
5.34 |
21.2 |
116 |
|
10 |
182 |
25.33 |
5.35 |
21.1 |
113 |
|
11 |
156 |
28.34 |
5.35 |
18.9 |
70 |
|
12 |
224 |
28.81 |
5.69 |
19.8 |
127 |
|
13 |
138 |
27.17 |
6.09 |
22.4 |
161 |
|
Average 3 |
178 |
27.07 |
4.81 |
17.8 |
114 |
|
Range |
246 |
5.27 |
2.30 |
7.9 |
91 |
- Notes: 1 Values are not included in range calculations.
- 2 Statistical outlier—not included in calculation of range or average.
- 3 Averages are not weighted and include all values except the outlier.
|
Source |
Concrete Class |
Number of Samples |
Mean Strength, MPa |
Pooled Std. Dev., MPa |
COV, % |
|---|---|---|---|---|---|
|
1 |
A |
480 |
33.09 |
4.09 |
12.4 |
|
NS |
218 |
28.21 |
4.27 |
15.2 |
|
|
2 |
A |
540 |
33.83 |
4.63 |
13.7 |
|
NS |
360 |
29.03 |
4.55 |
15.7 |
|
|
3 |
A |
440 |
34.85 |
4.03 |
11.6 |
|
NS |
308 |
27.79 |
4.03 |
14.5 |
A 1966 paper by Steele et al. presented a summary of data collected for
two projects in West Virginia.(15)
A summary of the 28-day cylinder compressive strength results (reported
for both projects) is presented in table 14. The authors of this
report point out that although a typical project standard deviation
could be estimated to be around 3.17 MPa, it could range from 2.41 to
4.48 MPa. A calculated standard deviation for one lot may even
be higher.
Table 14. Strength parameters for Class A structural concrete—two projects in West Virginia.(15)
|
Project |
Number of Tests |
Avg 28-day Compressive Strength, MPa |
Standard Deviation Individuals, MPa |
|---|---|---|---|
| West Virginia—Project A |
190 |
29.20 |
3.00 |
| West Virginia—Project B |
200 |
30.47 |
3.32 |
| Average |
— |
29.84 |
3.17 |
A literature review conducted by ERES Consultants, Inc. for a report titled
Measurement and Specification of Construction Quality included
six different figures showing normal distributions of different types
of PCC strength data.(16)
These are presented in figures 4 through 9.
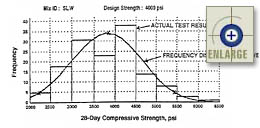 |
Figure 4. Histogram of 28-day concrete compressive strength.(16) |
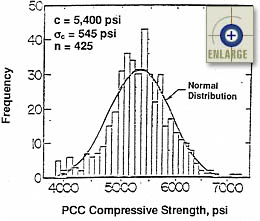 |
Figure 5. Distribution of PCC compressive strength. (16) |
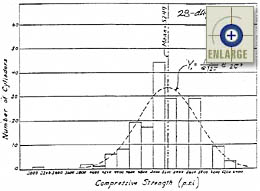 |
Figure 6. Histogram of 28-day cylinder concrete compressive strength.(16) |
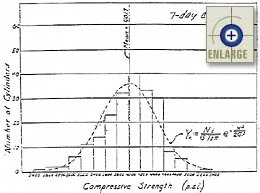 |
Figure 7. Histogram of 7-day cylinder concrete compressive strength.(16) |
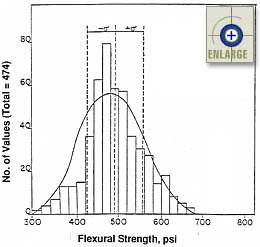 |
Figure 8. Histogram of concrete flexural strength.(16) |
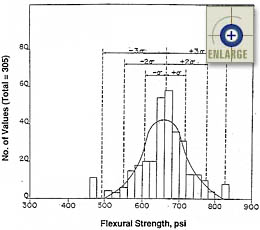 |
Figure 9. Histogram of concrete flexural strength.(16) |
Actual concrete strength compressive strength data were also collected for the Federal Highway Administration (FHWA)-sponsored project "Measurement and Specification of Construction Quality."(17) Both 28-day cylinder and core data were collected for three projects (one each for Illinois, Minnesota, and Ohio) constructed during the 1995 construction season. The results of the statistical analysis for both data sets are presented in table 15.
Table 15. 1995 28-day cylinder and core compressive strength data.(17)
|
Project Location |
Sample Type |
No. of Samples |
Mean, MPa |
Std Dev, MPa |
COV, % |
|---|---|---|---|---|---|
| Rochelle, IL |
Cylinder |
106 |
37.40 |
5.16 |
13.8 |
|
Core |
30 |
40.12 |
3.76 |
9.4 |
|
| Mankato, MN |
Cylinder |
56 |
36.62 |
3.36 |
9.2 |
|
Core |
30 |
41.26 |
7.38 |
17.9 |
|
| Bellefontaine, OH |
Cylinder |
100 |
29.53 |
2.43 |
8.2 |
|
Core |
31 |
41.45 |
5.32 |
12.8 |
|
| Cylinder Data Only—Averages |
3.65 |
10.4 |
|||
| Core Data Only—Averages |
5.49 |
13.4 |
|||
In 1996, Hughes compiled a table of typical 28-day PCC cylinder statistics in a report titled Variability in Highway Pavement Construction.(6) This table included data from two published State Highway Agency (SHA) reports (from Arizona and Pennsylvania), as well as data from databases and variability studies provided with a completed questionnaire. These data are presented in table 16. Hughes also reported that the New Jersey DOT’s typical standard deviation associated with a lot is approximately 2.07 MPa.
Table 16. Typical standard deviations for 28-day PCC cylinder strengths.(6)
|
Source |
Year |
Class |
Mean, MPa |
Std Dev, MPa |
COV, % |
|---|---|---|---|---|---|
| Georgia |
1993 |
Paving |
32.89 |
3.35 |
10.2 |
| New York |
1993 |
Gen Structural |
30.43 |
5.21 |
17.3 |
| New York |
1993 |
Thin Structural |
33.27 |
5.36 |
16.3 |
| New York |
1993 |
Pumping |
34.74 |
5.39 |
15.8 |
| Maine |
1992 |
Gen Structural |
35.66 |
4.05 |
11.4 |
| Maine |
1991 |
Gen Structural |
34.12 |
4.55 |
13.3 |
| Virginia |
1988 |
Gen Structural |
33.40 |
4.55 |
13.6 |
| Virginia |
1988 |
High Strength |
39.76 |
4.37 |
11.2 |
| Arizona |
1974 |
Paving |
30.16 |
4.15 |
13.8 |
| Pennsylvania |
1972 |
Gen Structural |
32.06 |
4.83 |
15.1 |
Note: Standard deviation based on single 28-day cylinders.
Variation of Concrete Flexural Strength
Flexural strength data from the Illinois Department of Transportation MISTIC database were summarized and presented in a 1995 report.(7) The results are shown in table 17. An analysis of the data shows a typical average beam flexural strength standard deviation of 0.44 MPa and an average COV of 8.1 percent.
|
Mix Number |
Class |
Year |
n |
Mean, MPa |
Std Dev, MPa |
COV, % |
|---|---|---|---|---|---|---|
|
1 |
Structural |
Unknown |
18 |
5.63 |
0.60 |
10.7 |
|
2 |
Structural |
Unknown |
129 |
5.41 |
0.34 |
6.4 |
|
3 |
Structural |
Unknown |
13 |
5.35 |
0.39 |
7.3 |
|
Structural Data Averages |
5.46 |
0.44 |
8.1 |
|||
Flexural stength variability data were also presented by Darter in a 1972 report.(8) This consisted of data from five Texas Highway Department projects, as well as some data from the original American Association of State Highway Officials (AASHO) Road Test. This information is summarized in table 18.
|
Project Number |
Number of Tests |
Mean, MPa |
Std Dev, MPa |
COV, % |
|---|---|---|---|---|
|
Texas Highway Department Data |
||||
|
1 |
135 |
4.78 |
0.57 |
11.8 |
|
2 |
305 |
4.56 |
0.39 |
8.4 |
|
3 |
474 |
3.38 |
0.46 |
13.7 |
|
4 |
258 |
2.82 |
0.14 |
4.9 |
|
5 |
270 |
4.67 |
0.45 |
9.6 |
|
AASHO Road Test Data |
||||
|
1 |
11 |
4.55 |
0.35 |
7.7 |
|
2 |
11 |
4.90 |
0.37 |
7.5 |
|
Texas Data Only—Averages |
4.04 |
0.40 |
9.7 |
|
|
AASHO Data Only—Averages |
4.72 |
0.36 |
7.6 |
|
|
All Project Data—Averages |
4.23 |
0.39 |
9.1 |
|
An analysis of the flexural strength data in table 18 shows a typical average beam flexural strength standard deviation of 0.39 MPa and an average COV of 9.1 percent. Darter does point out that the AASHO data show less variability than the Texas data (probably due to the stringent quality control procedures at the Road Test). In this report, Darter recommends that a flexural strength COV of 15 percent be used for design.(8)
In a 1996 report, Hughes presented typical flexural strength data collected from four different State studies.(6) It is interesting to note that one of these States (Indiana) presented contractor quality control data and State DOT acceptance data for the same project. The collected data are presented in table 19.
Table 19. Typical flexural strength data for different State studies.(6)
|
Data Source |
Test Type |
Mean, MPa |
Std. Dev., MPa |
COV, % |
|---|---|---|---|---|
| Midwestern State #1 |
mid-point loading |
5.63 |
0.72 |
12.7 |
| Midwestern State #2 |
third-point loading |
4.69 |
0.48 |
10.4 |
| Pennsylvania |
not reported |
5.45 |
0.69 |
12.7 |
| Indiana—Contractor Quality Control Tests |
not reported |
4.52* |
0.23* |
5.0 |
| Indiana—State Acceptance Tests |
not reported |
4.52* |
0.26* |
5.8 |
* Each "sample value" included in the statistical analysis represents the average of two beam breaks.
A report by Greer contained information regarding the within- and between-batch flexural strength variations in the laboratory and the field.(18) The study analyzed published data from more than 200 mixes (more than 765,000 m3 of concrete) placed at the Atlanta International Airport. In the laboratory, the within-test standard deviation represents the amount of variation among flexural strength tests from the same batch of concrete and is an indicator of the quality of the procedures performed by the laboratory personnel. The laboratory between-batch variation, however, "indicates the amount of variation between different batches of the same concrete materials." In the field, the within-test standard deviation is an indicator of the quality of the testing procedures performed by the field testing personnel. The field between-batch variability indicates the quality of the production and control procedures used by the contractor and supplier. The results of the Greer study are presented in table 20.
Table 20. Measured flexural strength variations at the Atlanta International Airport.(18)
|
Variation Type |
Std Dev Range, MPa |
Average Std. Dev., MPa |
|---|---|---|
| 28-day laboratory within-test |
Not available |
0.23 |
| 28-day laboratory between-batch |
Not available |
0.19 |
| 28-day field within-test |
0.22 – 0.28 |
0.24 |
| 28-day field between-batch |
0.18 – 0.36 |
0.24 |
| 3-day field within-test |
0.17 – 0.23 |
0.20 |
| 7-day field between-batch |
0.17 – 0.33 |
0.29 |
Greer noted that both the laboratory within-test and between-batch standard deviations for both sources are independent of the measured flexural strength.(18) Therefore, it can be concluded that the standard deviation is more appropriate than the COV when evaluating flexural strength tests. Table 21 contains proposed guidelines for assessing the level of quality associated with flexural strength testing data.(18)
|
Within-Test Standard Deviation (Testing Agency) |
Overall Standard Deviation (Contractor) |
Level of Quality (Quality Control) |
|---|---|---|
|
< 0.28 MPa |
< 0.28 MPa |
Excellent to Good |
|
0.28 – 0.45 MPa |
0.28 – 0.45 MPa |
Good to Fair |
|
> 0.45 MPa |
> 0.45 MPa |
Fair to Poor |
A large amount of data was collected at a 1993 Colorado paving project. The project consisted of 25.7 km of paving on I-70 near the town of Vona. Flexural strength was measured from third-point load testing (modulus of rupture) of 11 sets of 2 beams each. A mean and standard deviation of 4.69 and 0.44 MPa, respectively, were observed from the testing.(13)
An article published by ACPA in 1995 discussed the typical 28-day third-point flexural strength standard deviation expected from ready-mix plants.(14) It reported that historical records from past plant operations showed that this standard deviation could be expected to be less than 0.48 MPa for concrete coming from a well-controlled ready-mix operation.
Variation of Concrete Split Tensile Strength
Split tensile strength data were also collected at the 1993 Colorado paving project.(13) Split tensile strength tests were conducted on 39 sets of 2 cylinders each, resulting in an overall mean and standard deviation of 3.10 and 0.26 MPa, respectively.
Within-Test and Between-Batch Variability
A report by Gray reported on a study that investigated both the between- and within-laboratory variability.(19) The study looked at testing results obtained in interlaboratory or comparative testing programs that were operated in the three largest metropolitan areas of British Columbia and Alberta, Canada. The study separately analyzed laboratories that were and were not certified by the Canadian Standards Association (CSA). Figure 10 shows linear trends of within-laboratory variability versus average compressive strength for all programs. Figure 11 shows linear trends of average within-laboratory and between-laboratory variability versus average compressive strength. Figure 12 shows linear trends of between-laboratory variability versus average compressive strength for all programs. The following two conclusions were drawn from the study’s results:(19)
- The within-laboratory precision of the standard test method for determining the compressive strength of cylindrical portland cement concrete test specimens varies linearly with the compressive strength of the test concrete. As measured by the 95-percent repeatability limit (within a laboratory), this variability approaches 10 percent of the compressive strength. This implies that on the basis of test error alone, the difference in absolute value of two test results obtained in the same laboratory on the same material can be expected to exceed approximately 10 percent of the average compressive strength of the test concrete about 5 percent of the time, and there is reason to question one or both of the test results only if such a difference is found to be larger than this value.
- The between-laboratory precision of the standard test method also varies linearly with the compressive strength of the test concrete. As expressed by the 95-percent reproducibility limit (between laboratories), this variability approaches 15 percent of the compressive strength. This implies that on the basis of test error alone (including both the within and between-laboratory components), the difference in absolute value of two test results obtained in different laboratories on the same material can be expected to exceed approximately 15 percent of the average compressive strength of the test concrete about 5 percent of the time, and there is reason to question one or both of the test results only if such a difference is found to be larger than this value.
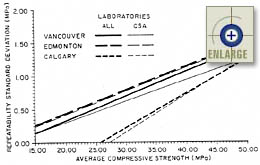 |
Figure 10. Repeatability (within a laboratory) standard deviation versus average compressive strength for all programs.(19) |
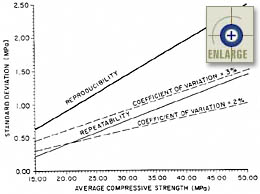 |
Figure 11. Average repeatability (within a laboratory) and reproducibility (between laboratories) standard deviations versus average compressive strength.(19) |
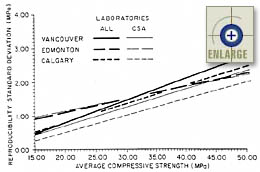 |
Figure 12. Reproducibility (between laboratories) standard deviation versus average compressive strength for all programs.(19) |
ACI 214-89 "Recommended Practice for Evaluation of Strength Test Results of Concrete" was reviewed as part of a literature review conducted by ERES Consultants, Inc. for a report titled Measurement and Specification of Construction Quality.(16) ACI Guidelines for determining the quality of a laboratory, based on observed within-test COV’s for compressive strength, are provided in table 22.
Table 22. Compressive strength within-test COV guidelines.(16)
|
Within-Test COV* |
Laboratory Control |
|---|---|
|
Below 3.0 |
Excellent |
|
3.0 to 4.0 |
Very Good |
|
4.0 to 5.0 |
Good |
|
5.0 to 6.0 |
Fair |
|
Above 6.0 |
Poor |
* Variation in compressive strength between replicate samples tested by the same operator.
Other information included in the literature review stated that typical COV values for 7-day flexural strength range from 2.8 to 17.6 percent, while COV’s for 28-day flexural strength range from 3.5 to 9.6 percent.(16)
Accelerated Testing Methods for Concrete Strength
Much can be learned about nondestructive testing (NDT) methods for concrete strength from the fast-track paving technology. Fast-track techniques are generally used to move up the traffic open date of a newly constructed or repaired PCC pavement. A number of different techniques have been developed to provide quick and reliable assessments of the concrete strength at early ages. One reviewed ACPA report describes the current state of fast-track paving techniques, including six nondestructive strength assessment methods that have been used.(20) A table outlining the six methods is presented as table 23. Of these six techniques, the most commonly used are the maturity and pulse-velocity methods (both of which are described in more detail in the following sections).
Table 23. Non-destructive test methods for concrete.(20)
|
Test Method |
Standard |
Basic Description |
Testing Precision to Baseline Cylinder Strength2 |
|---|---|---|---|
| Surface Hardness (Swiss Hammer) | ASTM C 805 | Rebound of hammer correlates to surface hardness & compressive strength |
± 40 % |
| Penetration Resistance (Windsor Probe) | ASTM C 803 | Penetration depth of gun-fired probe correlates to surface hardness & compressive strength |
± 20 % |
| Pullout1 | ASTM C 900 | Force to remove cast-in metal probe correlates to surface compressive strength |
± 15 % |
| Break-off | ASTM C 1150 | Force necessary to break a circular core cast or cut partially into slab correlates to flexural strength |
± 15 % |
| Maturity | ASTM C 1074 | Internal temperature of concrete relates directly to concrete strength |
± 5 % |
| Pulse Velocity | ASTM C 597 | Velocity of sound wave from transducer to receiver through concrete relates to concrete strength |
± 10 % |
- Notes: 1 Cap and pull-out (CAPO) variation of pull-out test not approved by ASTM.
- 2 These are estimates of precision based on cylinder strength tests made using recommended ASTM procedures. Inaccurate concrete strength characterization by destructive cylinder testing is a common problem.
Maturity Method
The following is an excerpt from the above-mentioned ACPA report that describes some of the maturity concepts.(20)
"Maturity testing provides strength evaluation through monitoring of internal concrete temperature in the field. The basis of maturity is that each concrete mix has a unique strength-time relationship. Therefore, a mix will have the same strength at a given maturity no matter what conditions (time or temperature) occur before measurement."
Two methods of maturity were introduced in the report—the Nurse-Saul method and the Arrhenius maturity equation. In the United States, the Nurse-Saul method is the more commonly used of the two methods. The Nurse-Saul method calculates maturity as a function of time and temperature using equation 2.
M(t) = S(TA – T0) Dt (2)
where
M(t) = Temperature-time factor, degree-days or degree-hours.
Dt = Time interval, days or hours.
TA = Average concrete temperature during time interval, °C.
T0 = Datum temperature, °C (typically –10 °C).
No specific information on the Arrhenius maturity method was provided; however, the report did refer to ASTM C 1074 as a source for more information on the method.
Estimated strength gain versus maturity is mix-specific. Therefore, laboratory testing is required to accurately assess the as-constructed slab strength. The following excerpt from the ACPA report describes the details of the required laboratory and field maturity procedures.(20)
"Laboratory testing requires preparation of trial batches using the actual field-mix materials. Technicians must monitor the batch temperature and break cylinders to develop a relationship between the strength criterion and the temperature-time factor. This relationship becomes the calibration curve for evaluating the field concrete strength.
Field maturity evaluation begins with the embedment of thermocouples of temperature probes in the concrete when practicable after finishing or curing. The probes must connect to either commercially available maturity meters or temperature recorders with an accuracy of 1 °C. Technicians take readings at regular intervals then estimate strength using the temperature-time relationship from the laboratory study."
Pulse-Velocity Method
The pulse-velocity method estimates concrete strength or stiffness by measuring the time required for an ultrasonic wave to pass through the concrete from one transducer to another. This method is also mix-specific; therefore, laboratory testing is required to accurately assess the as-constructed slab strength. The following excerpt from the ACPA report describes the details of the required laboratory and field pulse-velocity procedures.(20)
"Pulse-velocity testing requires laboratory calibration to produce meaningful field information. Pulse-velocity readings are sensitive to aggregate, water-cement-plus-pozzolan ratio, moisture content, and concrete consolidation. Therefore, trial batches must contain the same mix materials at similar proportions as the project mix. In the laboratory, technicians take pulse-velocity measurements through a representative number of cast specimens, test the specimens for strength, and plot the results against the pulse-velocity readings to create a calibration curve."
Finally, pulse-velocity measurements are taken in the field following the manufacturer’s recommendations for placement of the transducers. Early-age concrete strengths are then estimated using the laboratory-developed calibration curves.
Compressive Versus Flexural Strength
Historically, flexural strength testing has been used for acceptance and design; however, today the trend is toward using compressive strength testing for not only quality control, but acceptance as well.
Advantages of Compressive Strength Over Flexural Strength for Acceptance
The following list of the advantages of using compression test cylinders, as opposed to flexural test beams, was compiled by Kosmatka:(21)
- Cylinders are easier to make, handle, transport, and test.
- Construction and inspection personnel are better acquainted with proper casting and testing procedures for cylinders.
- Cylinders are less sensitive to variations in testing procedures.
- Compression tests have a lower coefficient of variation. For example, tests using concretes made with 56 aggregate combinations and 2 different cement contents had an average batch-to-batch COV of 5.73 percent for flexural tests and 3.25 percent for compression tests.
- Some of the most commonly used specifications and guidelines refer to concrete acceptance criteria based on compressive strength.
- Statistical data for ready-mix concrete design are usually available for compressive strength, but not necessarily for flexural strength.
- Durability criteria for mix design is usually based on compressive strength.
- Investigations on low in-place concrete strengths are much easier to perform using drilled cores than sawed beams.
Strength Type Conversion Equations
In the current PRS approach, flexural strength is used in the distress indicator models that are dependent on strength. As many SHA’s move toward strength acceptance based on compressive or tensile strength testing, it is becoming more important to understand the relationships between different strength types.
Many different strength-type relationships were discussed in Darter’s 1972 report.(8) A relationship between modulus of elasticity and compressive strength is presented as equation 3. (Note: Equation 3 was developed in English units.)
Ec = 33 w1.5 (f’c)0.5 (3)
where
Ec = Static modulus of elasticity of concrete, psi.
w = Air dry weight of concrete at time of test, pcf.
f’c = Compressive strength of concrete at time of test, psi.
Flexural strength is commonly estimated using an equation of the form shown in equation 4.
S = K (f’c)0.5 (4)
where
S = Flexural strength (modulus of rupture), MPa.
K = Constant usually between 0.6 and 0.8 MPa.
f’c = Compressive strength of concrete at time of test, MPa.
As stated, values for K typically range from 0.6 to 0.8 MPa, but can be as low as 0.5 or as high as 0.9 for normal strength concrete. Because of the possible wide range of values for K, estimated correlations are not advised for the design of large projects. However, once established, the correlation for a particular mix can be quite stable.(21)
Kosmatka presented an example of a flexural strength versus compressive strength relationship compiled by Walker, Stanton, and Bloem in 1956.(21) This relationship is presented in figure 13. This chart (compiled from data for various aggregate combinations) demonstrates the range associated with making correlations from compressive to flexural strength. (Note: Figure 13 is presented in both English and metric units.)
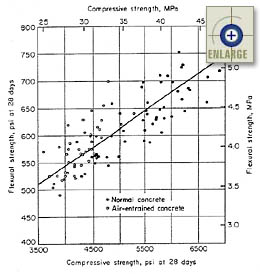 |
Figure 13. Relationship between flexural and compressive strength for various aggregate combinations.(21) |
Darter presented the results of a 1962 study conducted by the Bureau of Public Roads in which a relationship between flexural strength and modulus of elasticity was developed.(8) This relationship is presented as equation 5. (Note: Equation 5 was developed in English units.)
Ec = 14.4 w1.5 S0.77 (5)
where
Ec = Static modulus of elasticity of concrete, psi.
w = Air dry weight of concrete at time of test, pcf.
S = Flexural strength (modulus of rupture), psi.
The same Bureau of Public Roads report also produced a relationship between indirect splitting tensile strength and compressive strength. This relationship is presented as equation 6. (Note: Equation 6 was developed in English units.)
T = 1.37 (f’c)0.69 (6)
where
T = Indirect tensile strength, psi.
f’c = Compressive strength of concrete at time of test, psi.
A 1995 research work plan from Virginia was to focus on determining relationships between compressive strength, tensile strength, flexural strength, and wave propagation.(22) The developed relationships were then to be verified by field testing on construction projects using the same concrete mixtures evaluated in the laboratory. This study was being conducted with the ultimate goal of collecting enough data to develop a performance-related specification for Virginia.