U.S. Department of Transportation
Federal Highway Administration
1200 New Jersey Avenue, SE
Washington, DC 20590
202-366-4000
Federal Highway Administration Research and Technology
Coordinating, Developing, and Delivering Highway Transportation Innovations
 |
| This report is an archived publication and may contain dated technical, contact, and link information |
|
Publication Number: FHWA-HRT-09-035
Date: June 2009 |
|||||||||||||||||||||||||||||||||||||||||||||||||||||||||||||||||||||||||||||||||||||||||||||||||||||||||||||||||||||||||||||||||||||||||||||||||||||||||||||||||||||||||||||||||||||||||||||||||||||||||||||||||||||||||||||||||||||||||||||||||||||||||||||||||||||||||||||||||||||||||||||||||||||||||||||||||||||||||||||||||||||||||||||||||||||||||||||||||||||||||||||||||||||||||||||||||||||||||||||||||||||||||||||||||||||||||||||||||||||||||||||||||||||||||||||||||||||||||||||||||||||||||||||||||||||||||||||||||||||||||||||||||||||||||||||||||||||||||||||||||||||||||||||||||||||||||||||||||||||||||||||||||||||||||||||||||||||||||||||||||||||||||||||||||||
Safety Evaluation of Offset Improvements for Left-Turn LanesPDF Version (447 KB)
PDF files can be viewed with the Acrobat® Reader® FOREWORDThe goal of this research was to evaluate and estimate the safety effectiveness of offset improvements for left-turn lanes in the Evaluation of Low-Cost Safety Improvements Pooled Fund Study (ELCSI-PFS) Phase II. This strategy is intended to reduce the frequency of crashes by providing better visibility for drivers that are turning left. The estimate of effectiveness for offset improvements for left-turn lanes was determined by conducting scientifically rigorous before-after evaluations at sites where this strategy was implemented in the United States. The ELCSI-PFS provides crash reduction factor (CRF) and economic analysis for the targeted safety strategies where possible. This safety improvement and all other targeted strategies in the ELCSI-PFS are identified as low-cost strategies in the National Cooperative Highway Research Program (NCHRP) Report 500 Series. Participating States in the ELCSI-PFS are Arizona, California, Connecticut, Florida, Georgia, Illinois, Indiana, Iowa, Kansas, Kentucky, Maryland, Massachusetts, Minnesota, Mississippi, Montana, New York, North Carolina, North Dakota, Oklahoma, Pennsylvania, South Carolina, South Dakota, Tennessee, Texas, Utah, and Virginia. Dr. Chou-Lin Chen Acting Director, Office of Safety Research and Development Notice This document is disseminated under the sponsorship of the
U.S. Department of Transportation in the interest of information exchange. The
U.S. Government assumes no liability for the use of the information contained in this document. The
U.S. Government does not endorse products or manufacturers. Trademarks or manufacturers' names appear in this report only because they are considered essential to the objective of the document. Quality Assurance Statement The Federal Highway Administration (FHWA) provides high-quality information to serve Government, industry, and the public in a manner that promotes public understanding. Standards and policies are used to ensure and maximize the quality, objectivity, utility, and integrity of its information. FHWA periodically reviews quality issues and adjusts its programs and processes to ensure continuous quality improvement. Technical Report Documentation Page
Form DOT F 1700.7 (8-72) Reproduction of completed pages authorized Table of ContentsDEVELOPMENT OF SAFETY PERFORMANCE FUNCTIONS APPENDIX: SAFETY PERFORMANCE FUNCTIONS List of FiguresFigure 1. Chart. Illustration of negative, no, and positive offset left-turn lanes Figure 2. Photo. Example of a type 1 installation in Lincoln, NE (positive offset) Figure 3. Photo. Example of a type 2 installation in Lincoln, NE (lateral separation with no offset) List of TablesTable 1. Minimum and desirable offset distance by vehicle type and vehicle speed Table 2. Before period crash rate assumptions Table 3. Minimum required before period site-years for treated sites Table 4. Definitions of crash types Table 5. Data summary for treatment sites Table 6. Results for Florida strategy sites Table 7. Results for Nebraska strategy sites Table 8. Results for Wisconsin strategy sites Table 9. Summary of crash reduction factors Table 14. Nebraska proportions to apply to total crash model for other crash types Abbreviations and SymbolsAbbreviations
Symbols
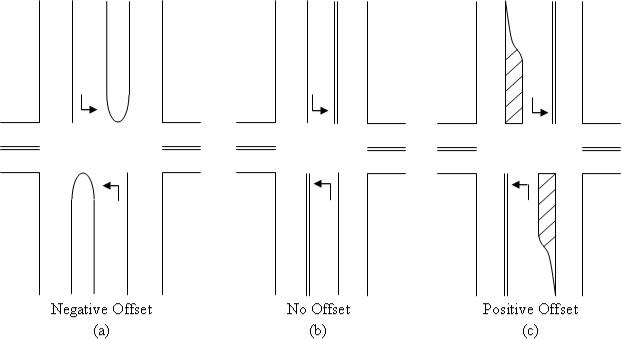
EXECUTIVE SUMMARYThe Federal Highway Administration (FHWA) organized a pooled fund study of 26 States to evaluate low-cost safety strategies as part of its strategic highway safety effort. The purpose of the FHWA Low-Cost Safety Improvements Pooled Fund Study was to evaluate the safety effectiveness of several of the low-cost safety strategies through scientifically rigorous crash-based studies. One of the strategies chosen to be evaluated for this study was offset improvements for left-turn lanes. This strategy is intended to reduce the frequency of crashes by providing better visibility for drivers who are turning left. The safety effectiveness of this strategy has not been thoroughly documented. This study is an attempt to provide an evaluation through scientifically rigorous procedures. Geometric, traffic, and crash data were obtained for 92 installations in Nebraska, 13 in Florida, 12 in Wisconsin, and for a number of untreated reference sites in each State. The configuration of offsets in Nebraska varied from site to site, but they all involved a simple modification of an existing left-turn bay. The striping was reconfigured with thermoplastic to narrow the existing left-turn lane, thereby shifting left-turn vehicles further to the left and improving the offset. The installations in Florida were somewhat more elaborate in that they involved shifting the left-turn lanes further into the median (on divided highways) either by restriping or by installing raised concrete channelizing islands. While the installations in Florida and Nebraska improved the offset, many of the installations did not result in a positive offset. The majority of the Wisconsin installations involved a combination of pavement markings and raised concrete channelizing islands to create a positive offset; three treatments involved pavement markings only. In Wisconsin, the results indicated substantial and highly significant crash reductions in all categories-total (34 percent), injury (36 percent), left-turn (38 percent), and rear-end (32 percent). Nebraska and Florida results showed little or no evidence that this strategy was effective for reducing total crashes. For the main target crashes (i.e., left-turn opposing crashes), a reduction in crashes was found in Florida, although it was not significant. While the results for Nebraska indicated a significant reduction in injury crashes, they also showed an increase in target crashes, including a 45-percent increase in left-turn opposing crashes and a 7-percent increase in rear-end crashes. Overall, the large variation in installation methods and resulting offset in the three States may help explain the large difference in observed effects. A disaggregate analysis of the Nebraska installations revealed that the percent reduction in crashes increased as the expected number of crashes increased. For intersections that had nine or more expected crashes per year in the before period, an 8-percent reduction in total crashes was found. An economic analysis was conducted to identify the level of the expected number of crashes that would yield a crash benefit that would justify the construction cost, with a benefit-cost ratio of at least 2:1. Based on this analysis, the installation of this strategy through reconstruction was cost-effective at intersections with at least nine expected crashes per year and where left-turn lanes were justified by traffic volume warrants. The Wisconsin installations had on average 7.52 mainline crashes per year pre-installation and yielded benefits on the order of a 30-percent reduction with a conservative benefit-cost ratio of approximately 2:1. INTRODUCTIONBackground on StrategyIntersections account for a small portion of the total highway system, yet, in 2006, approximately 2.42 million intersection-related crashes occurred. Intersection crashes accounted for 41 percent of all reported crashes and 21 percent (8,291) of all fatal crashes in 2006.(1) The disproportionately high percentage of intersection crashes is not surprising because intersections present more points of conflict than non-intersection locations. Crashes at signalized intersections represent about 51 percent (1.23 million) of all intersection-related crashes, of which 2,740 involved a fatality in 2006.(1) The typical geometry of signalized intersections can present several challenges. Visibility of oncoming vehicles is important for drivers to identify acceptable gaps. The geometry at some intersections actually creates a negative offset, as shown in figure 1(a), which further reduces sight distance for left-turning vehicles. Typical intersection alignments have opposing left-turn lanes directly across from one another and immediately adjacent to the through lanes, as shown by the intersection without an offset in figure 1(b). Thus, a left-turning vehicle in the opposite left-turn lane can obstruct the view of oncoming vehicles. Sight distance for left-turning vehicles can be improved by shifting the left-turn lanes to the left to create a positive offset, as shown in figure 1(c).(2) When initial offsets are negative, a variation of the offset improvement strategy can be applied by increasing the lateral separation between the left-turn and adjacent through lane (i.e., modifying the left-turn lane from a negative to less negative offset). Hence, the offset is still negative, but the sight distance to oncoming vehicles is slightly improved.
Figure 1. Chart. Illustration of negative, no, and positive offset left-turn lanes. This strategy may be particularly helpful for older drivers, but it should be noted that the strategy is most applicable when permissive or permissive/protective phasing for left-turn movements are in effect.(2) Left-turn movements that only operate as protected do not have the visibility concerns for gap acceptance. As such, this strategy would provide little if any benefit only for protected left-turn movements. The installation or upgrade of any pavement markings should follow the guidelines in The Manual on Uniform Traffic Control Devices (MUTCD) in order to maintain consistency throughout the given roadway.(3) Background on StudyIn 1997, the American Association of State Highway and Transportation Officials (AASHTO) Standing Committee on Highway Traffic Safety, with the assistance of the Federal Highway Administration (FHWA), the National Highway Traffic Safety Administration (NHTSA), and the Transportation Research Board (TRB) Committee on Transportation Safety Management, met with safety experts in the field of driver, vehicle, and highway issues from various organizations to develop a strategic plan for highway safety. These participants developed 22 key areas that affect highway safety. The National Cooperative Highway Research Program (NCHRP) published a series of guides to advance the implementation of countermeasures targeted to reduce crashes and injuries. Each guide addresses 1 of the 22 emphasis areas and includes an introduction to the problem, a list of objectives for improving safety in that emphasis area, and strategies for each objective. Each strategy is designated as proven, tried, or experimental. Many of the strategies discussed in these guides have not been rigorously evaluated; about 80 percent of the strategies are considered tried or experimental. The FHWA organized a pooled fund study of 26 States to evaluate low-cost safety strategies as part of this strategic highway safety effort. The purpose of the pooled fund study is to evaluate the safety effectiveness of several tried and experimental low-cost safety strategies through scientifically rigorous crash-based studies. Improving the offset for left-turn lanes at signalized intersections was selected as a strategy to be evaluated as part of this effort. Offset left-turn lanes are identified in the NCHRP Report 500 Series Volume 12 as a strategy to reduce crashes at signalized intersections.(2) This strategy is particularly applicable where crashes related to left-turn movements are an issue. Literature ReviewKhattak et al. analyzed the treatment of providing positive offset left-turn lanes at urban signalized intersections in Lincoln, NE.(4) The positive offset left-turn lanes were installed by increasing the lateral separation between the left-turn lanes and the adjacent through lanes, thereby improving the sight distance for left-turning vehicles. Six intersections were treated, and two intersections without offset left-turn lanes were selected as a control group. All treated intersections operated with protected/permitted left-turn phasing. The characteristics of the intersections varied, including the lane width, median type, median width, speed limit, and amount of offset. Nine years of crash and traffic data were analyzed. There were 298 left-turn related crashes at the study locations in the 9-year period. The study included an analysis of crash trends, regression analysis of crash rates, naïve and comparison group before-after studies, and ordered logit injury severity modeling. The comparison group method showed a reduction of 27 percent and 40 percent for total and property damage only accidents at the treated sites, respectively. However, the variances of these estimates were not reported, so it is unknown if these results were statistically significant. Poisson regression modeling of the before-after data indicated a slight non-significant reduction in crashes at the treated sites. Similarly, the injury severity modeling indicated that injury severity decreased in the after period, but the results were not statistically significant. McCoy et al. developed guidelines for positive offset distances for left-turning vehicles positioned at the stop line and opposed by a left-turning vehicle within the intersection.(5) The minimum and desirable positive offsets are shown in table 1 for various design speeds. Table 1. Minimum and desirable offset distance by vehicle type and vehicle speed.
a = Opposing left-turn vehicle is a passenger car b = Opposing left-turn vehicle is a truck 1 ft = 0.305 m 1 mi = 1.61 km This strategy may be particularly well suited for older drivers. Several studies have found that older drivers have more left-turn accidents at signalized intersections than younger drivers.(6) Common older driver errors include misjudging the oncoming vehicle speed, misjudging the available gap, assuming that the oncoming vehicle is going to stop or turn, and driving without seeing the other vehicle. Furthermore, older drivers may experience greater difficulties at intersections as a result of diminished visual capabilities, such as depth and motion perception. These traits, which are associated with older drivers, can increase the potential for collisions between vehicles turning left from the major road and through vehicles on the opposing major-road approach.(6) Staplin et al. studied the effects of both positive and negative offsetting left-turn lanes on the turning performance of drivers with respect to driver age and gender.(7) Left-turn performance of 100 subjects within 3 age groups (ages 25-45, 65-74, and 75+ years old) was evaluated under normal driving conditions at 4 intersections of different left-turn offset configurations. The results indicate that driver performance can be adversely affected by left-turn lanes that are offset by more than a 0.915-m (3-ft) negative offset. Such large negative offsets significantly increase the size of the critical gaps for drivers turning left and also seem to increase the likelihood of conflicts between left-turns and opposing through traffic. Surprisingly, driver perceptions of the level of comfort and degree of difficulty were not found to improve with the increased sight distance provided by larger (i.e., more positive) offsets. The 1.83-m (6-ft) positive offset was associated with a lower level of comfort and a higher degree of difficulty perceived by drivers making left-turns than the 0.915-m (3-ft) negative offset, which provided less sight distance. This may have been because the 0.915-m (3-ft) negative offset is much more common than the 1.83-m (6-ft) positive offset. OBJECTIVEThis research examined the safety impacts of offset improvements for left-turn lanes at signalized intersections in Florida, Nebraska, and Wisconsin. The objective was to estimate the safety effectiveness of this strategy as measured by crash frequency. Target crash types included the following:
A further objective addresses questions such as the following:
The evaluation of overall effectiveness included consideration of the installation costs and crash savings in terms of the benefit-cost ratio. Crash savings were computed by crash type and severity using crash costs recently developed by FHWA.(8) Meeting these objectives placed some special requirements on the data collection and analysis tasks including the need to complete the following:
STUDY DESIGNThe study design involved a sample size analysis and prescription of needed data elements. The sample size analysis assessed the sample size required to statistically detect an expected change in safety. It also determined what changes in safety can be detected with likely available sample sizes. Sample Size Estimation OverviewSample size estimations require assumptions of the expected treatment effect and the average crash rate at treatment sites in the before period. Minimum and desired sample sizes were calculated assuming a conventional before-after with reference group study design, as described in Hauer and a literature review of likely safety effects.(9) The sample size analysis undertaken for this study addressed the sample size required to statistically detect an expected change in safety. The sample size estimates were conservative because the Empirical Bayes (EB) methodology was incorporated in the before-after analysis rather than applying a conventional before-after analysis with a reference group. Sample sizes were estimated for various assumptions of the likely annual crash rate in the before period and likely safety effects of the strategy. Annual crash rates were assumed for four crash types (total, injury, left-turn, and rear-end crashes), as shown in table 2. The range of possible values for the expected safety effects was surmised from the literature review and knowledge of similar intersection treatments. These rates represent a range of mean crash rate. The large difference in the two rates is likely due to average annual daily traffic (AADT) differences. The study design assumed that the number of reference sites is equal to the number of strategy sites. Table 2. Before period crash rate assumptions.
Table 3 provides estimates of the required number of before and after period site-years for a 90-percent confidence level. The minimum sample indicates the level for which a study seems worthwhile; that is, it is feasible to detect with 90-percent confidence the largest effect that may reasonably be expected based on what is currently known about the strategy. In this case, a 10-percent reduction in total crashes was assumed as this upper limit on safety effectiveness. The minimum sample size was based on the larger expected annual crash rate before treatment (rate A). The desirable sample also assumes a 10-percent reduction in total crashes, but this corresponds to the smallest benefit that would be interesting in detect with 90-percent confidence. The logic behind this approach is that safety managers may not wish to implement a measure that reduces crashes by less than 10 percent, and the required sample size to detect a reduction smaller than 10 percent would likely be prohibitively large. The desirable sample size was conservatively based on the smaller expected annual crash rate before treatment (rate B). These sample size calculations were based on specific assumptions regarding the number of crashes per intersection and years of available data. Site-years are the number of intersections where the strategy was implemented multiplied by the number of years the strategy was in place at each intersection. For example, if a strategy is implemented at nine intersections and is in place for 3 years at all nine intersections, there are a total of 27 site-years available for the study. The sample size values recommended in this study are highlighted in bold in table 3. The sample size estimates provided are conservative in that the state-of-the-art EB methodology proposed for the evaluations would require fewer sites than a conventional before-after study with a reference group. A minimum sample size of 100 site-years and a desirable sample size of at least 263 site-years per period were calculated. Estimates that may be predicted with greater confidence or a smaller reduction in crashes will be detectable if there are more site-years of data available in the after period. The same holds true if there is a higher crash rate than expected in the before period. Note that much more data are necessary for analysis of injury, left-turn, or rear-end crashes. For example, in order to detect a 10-percent change in left-turn crashes with 90-percent confidence, 1,791 intersection-years of data would be desired. Table 3. Minimum required before period site-years for treated sites.
Note: Bold denotes the calculated minimum and desirable sample size for intersection-years per period. Rate A and rate B correspond to the assumed crash rates in table 2. METHODOLOGYThe EB methodology for observational before-after studies was used for the evaluation.(9) This methodology is rigorous in that it addresses the following:
In the EB approach, the change in safety for a given crash type at a site is given by the following:
Where: λ = The expected number of crashes that would have occurred in the after period without the strategy. π = The number of reported crashes in the after period. In estimating λ, the effects of regression-to-the-mean and changes in traffic volume were explicitly accounted for using safety performance functions (SPFs), relating crashes of different types to traffic flow and other relevant factors for each jurisdiction based on untreated sites (reference sites). Annual SPF multipliers were calibrated to account for temporal effects on safety (e.g., variation in weather, demography, and crash reporting). In the EB procedure, the SPF was used to first estimate the number of crashes that would be expected in each year of the before period at locations with traffic volumes and other characteristics similar to the one being analyzed (i.e., reference sites). The sum of these annual SPF estimates (P) was then combined with the count of crashes (x) in the before period at a strategy site to obtain an estimate of the expected number of crashes (m) in the before strategy. This estimate of m is as follows:
Where w1 and w2 are estimated from the mean and variance of the SPF estimate as the following:
Where: k = The constant for a given model. It is estimated from the SPF calibration process with the use of a maximum likelihood procedure. In that process, a negative binomial distributed error structure is assumed with k being the dispersion parameter of this distribution. A factor was then applied to m to account for the length of the after period and differences in traffic volumes between the before and after periods. This factor is the sum of the annual SPF predictions for the after period divided by P, the sum of these predictions for the before period. After applying this factor, the result was an estimate of λ. The procedure also produces an estimate of the variance of λ. The estimate of λ was then summed over all sites in a strategy group of interest (to obtain λ sum) and compared with the count of crashes observed during the after period in that group (x sum). The variance of λ was also summed over all sites in the strategy group. The Index of Effectiveness (θ) is estimated as the following:
The standard deviation of θ is given by the following:
The percent change in crashes was calculated as 100 (1− θ). Thus, a value of θ = 0.7 with a standard deviation of 0.12 indicated a 30-percent reduction in crashes with a standard deviation of 12 percent. DATA COLLECTIONFlorida, Nebraska, and Wisconsin provided installation data, including locations and dates for offset improvements to left-turn lanes. These States also provided roadway geometry, traffic volumes, and crash data for both installation and reference sites. This section provides a summary of the data assembled for the analysis. During the data collection process, the project team identified a variation in the design of offset left-turn lanes among the three States. For example, nearly all installations in Wisconsin were similar to the positive offset left-turn lane concept identified in the NCHRP Report 500 Series Volume 12 and shown previously in figure 1(c).(2) However, many of the installations in Florida and Nebraska did not result in a positive offset. Instead, the offset was improved by shifting the left-turn lane further away from the adjacent through lane, but the end result was a less negative offset or no offset (refer to figure 1 for definitions). Due to the variation in offset designs among the States, the project team adopted a classification scheme to define the installations as one of three types of offset improvements. The adopted classification scheme is presented below, and examples of the three types of offset improvements are provided in figure 2 to figure 4.
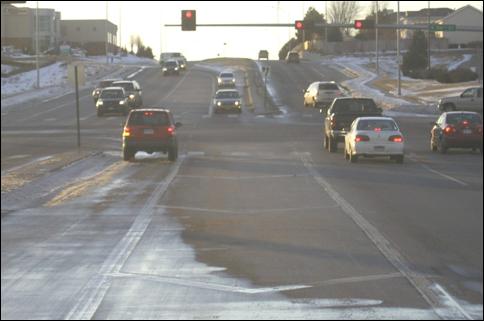
Figure 2. Photo. Example of a type 1 installation in Lincoln, NE (positive offset).
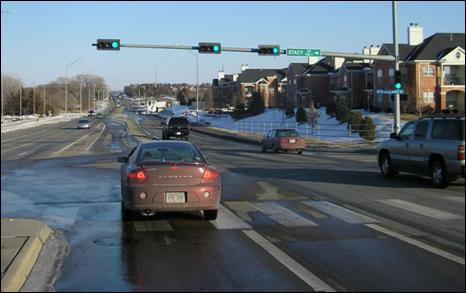
Figure 3. Photo. Example of a type 2 installation in Lincoln, NE (lateral separation with no offset).
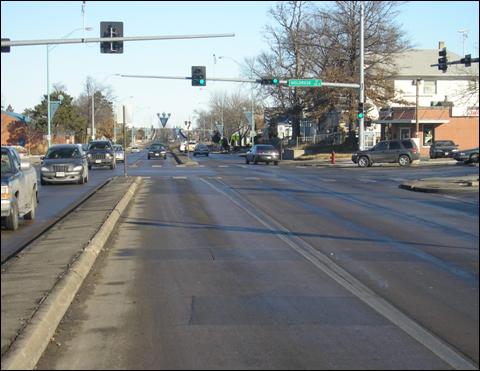
Figure 4. Photo. Example of a type 3 installation in Lincoln, NE (lateral separation with negative offset). FloridaBackgroundThe Florida Department of Transportation (FDOT) implemented offset improvements for left-turn lanes to increase safety at specific signalized intersections throughout the State. This was not a blanket strategy, so several districts were contacted to identify potential locations with offset improvements for left-turn lanes. Several potential intersections were initially identified, but it was later determined that some of these intersections had protected left-turn signal phasing, and they were dropped from the study. Those sites with permissive, protected-permissive, or permissive-protected left-turn signal phasing were retained in the study, and additional information was obtained. Installation DataDistrict engineers provided locations and installation dates of offset improvements for left-turn lanes. In total, 13 locations were identified in 3 districts, including districts 2, 4, and 7. Of these, eight installations were defined as type 2, and five were defined as type 3 according to the classification scheme. When available, data on other strategies installed at the study locations were also collected. Reference SitesDistrict engineers provided a list of signalized intersections which were to be used as reference sites. The reference sites were selected based on the availability of information (traffic counts, roadway geometry, etc.), and they were reflective of the study site characteristics. The difference was that the reference sites were not treated (i.e., no offset improvement). In total, 39 locations were identified in 3 districts including districts 2, 4, and 5. Roadway DataRoadway data were collected for both strategy sites and reference sites. Most roadway data were obtained from the crash database provided by FDOT, including number of lanes, area type, roadway type, and speed limit. Lane configuration as well as the presence and type of median were identified using aerial images. For locations where the images were not clear, field visits were conducted to obtain the necessary data. Traffic DataTraffic volume data were obtained from several sources, including the crash database provided by FDOT and county agencies. The major roads were all State-maintained routes, and as such, traffic volumes were available in the crash database. Minor road data were not available in the crash database unless the minor road was also a State-maintained route. In most cases, the minor road traffic volume had to be obtained from the corresponding county agency. When available, county Web sites were used to obtain the necessary traffic volume data. In other cases, county engineers were asked to provide estimates of the minor road traffic volume Major road traffic volumes were available for each year of the study period. Minor road traffic volumes were sparser. In some cases, only the 8-hour traffic counts were available for minor roads. In these cases, a multiplier was applied to estimate the average daily traffic from the 8-hour count. The multipliers were obtained from the county or district where the site was located, or they were computed using the 8-hour count and average daily traffic volume from the major road at the intersection. Growth factors were computed and applied to the traffic volumes to fill in years where data were not available. Crash DataFDOT provided a crash database containing all crashes on state-maintained roads from 1983 to 2005 inclusively. The crash data were matched to the strategy and reference sites using the section number and intersection milepost. A radius of 76.25 m (250 ft) was used to identify crashes at the strategy and reference intersections. NEBRASKABackgroundThe city of Lincoln, NE, improved offsets for left-turn lanes throughout the city to increase safety at signalized intersections. All three types of offset improvements for left-turn lanes, as defined by the project team, were implemented in Lincoln. The majority of offset improvements (44) included the reconfiguration of existing left-turn lanes to type 2 offsets. There were 9 intersections with type 1 offset left-turn lanes included in the study and 39 intersections with type 3 improvements. Installation DataThe Lincoln Department of Public Works provided a list of signalized intersections where offset left-turn lane improvements had been implemented. The list indicated the type of median and type of left-turn signal phasing (permissive, protected-permissive, permissive-protected, or fully-protected), but it did not indicate the type of offset improvement. Those sites with fully-protected left-turn signal phasing were excluded from the analysis as were sites with inadequate traffic volume data, leaving a total of 92 intersections to be included in the analysis. When available, data on other strategies installed at the study locations were collected as well. Reference SitesA list of potential reference locations in Lincoln was provided, which included signalized but untreated locations (i.e., no offset treatment). The final list of reference sites was selected based on data availability, resulting in a total of 64 reference sites. Roadway DataRoadway data were collected for both the strategy sites and reference sites. The presence and type of median as well as left-turn signal phasing were provided by the city engineers. The lane configuration was identified using electronic intersection design files from the city as well as aerial images. For locations where electronic files were not available and the aerial images were not clear, field visits were conducted to obtain the necessary data. Traffic DataTraffic volume data were obtained from Lincoln. Traffic volumes were available for 1998, 1999, 2000, 2002, and 2006. When the subject intersection was located between two count locations, an average of the two closest counts was computed. Growth factors were computed to fill in the counts for years that were not available. Crash DataThe Nebraska Department of Roads (NDOR) helped provide crash data for each of the strategy and reference sites. Crash data were obtained for each location from 1994 to 2006. NDOR does not use a specific distance to determine whether a crash is intersection-related. Rather, intersection-related crashes are determined by an analyst after careful review of each case. They include any crashes where any of the vehicles involved were in the process of stopping, turning, slowing down, or making any other type of maneuver that was a result of the presence of an intersection. WISCONSINBackgroundThe Wisconsin Department of Transportation (WisDOT) implemented offset improvements for left-turn lanes to increase safety at specific signalized intersections throughout the State. This is not a blanket strategy, but it is becoming a standard practice in some regions. For example, the southeast region indicated that they are beginning to install positive offset left-turn lanes whenever there is a sufficient median, particularly at signalized intersections. Installation DataThe University of Wisconsin provided a list of potential installation locations, including the region, project number, and intersection name. Regions were contacted to verify the installation and obtain more detailed information regarding the installation date and project cost. It was later determined that some of these intersections had protected left-turn signal phasing; those with fully protected phasing were dropped from the study. Those sites with permissive, protected-permissive, or permissive-protected left-turn signal phasing were retained in the study, and additional information was obtained. In total, 12 locations were identified in 2 regions. Of these, 10 were type 1 and only 2 were type 2. One region provided detailed cost information for each project. Reference SitesWisDOT provided a database of all state-maintained signalized intersections. This database was used to identify possible reference sites that were similar to the intersections included in the treatment group, but these sites did not have offset improvements or other recent safety improvements. The final reference group was selected based on the availability of traffic volume and intersection data. Roadway DataRoadway data were collected for both strategy sites and reference sites. WisDOT provided an electronic roadway inventory. The inventory provided the urban/rural designation, illustrated whether the roadway was divided or undivided, and indicated the presence of a shoulder. Specific intersection geometry, such as lane designations, was obtained from aerial photography. Traffic DataTraffic volumes were obtained from county AADT maps. Traffic volumes were not available for every year during the study period, and the years of available traffic counts varied by site. Linear interpolation was used to fill in years where counts were not available. Crash DataWisDOT provided electronic crash data from 1994 to 2006. The crash data were matched to the strategy and reference sites using the major and minor road names. A radius of 76.25 m (250 ft) was used to identify crashes at both the strategy and reference intersections. DATA CHARACTERISTICS AND SUMMARYTable 4 provides the definitions of crash types used. For the Florida data, the vehicle direction and movement were used to identify specific target crashes occurring on the treated roadway. The crash data from Nebraska did not include information on each vehicle involved prior to 2002. As such, the left-turn and rear-end crashes could not be restricted to only those occurring on the treated roadways, and all crashes identified as rear-end and left-turn were included. The Wisconsin crash data only included crashes coded to the mainline (treated approaches) and did not include the initial vehicle direction. As such, crash data in Wisconsin were coded as left-turn related if a vehicle was turning left and if the crash was not coded as rear-end. Table 4. Definitions of crash types.
1 ft = 0.305 m Table 5 provides summary information for the data collected. It is shown that the total three-State sample adequately satisfies the requirements for a minimum sample size of 100 site-years and a desirable sample size of 263 site-years per period. Nebraska alone satisfies both requirements; Florida comes close to satisfying the minimum requirement; and Wisconsin is close to the minimum for the before period. It is also evident from table 5 that the crash frequencies and major road volumes for the Nebraska and Wisconsin treatment sites are reasonably similar and substantially lower than the values for Florida. The information in table 5 should not be used to make simple before-after comparisons of crashes per site-year. Such an analysis would not account for factors, other than the strategy, that may cause a change in safety between the before and after periods. Such comparisons are properly done with the EB analysis, as presented in subsequent sections. Table 5. Data summary for treatment sites.
Note: Thirty-seven intersections in Nebraska, one in Florida, and two in Wisconsin did not have minor road volumes available. DEVELOPMENT OF SAFETY PERFORMANCE FUNCTIONSThis section presents the SPFs developed for each State. The SPFs were used in the EB methodology to estimate the safety effectiveness of this strategy.(9) Generalized linear modeling was used to estimate model coefficients using the software package SAS® assuming a negative binomial error distribution, which was consistent with the state of research in developing these models.(10) SPFs were calibrated separately for Florida, Nebraska, and Wisconsin using the corresponding reference sites from each State. The primary form of the SPFs is as follows: Crashes/year = α (MajAADT) β1 α (MinAADT) β2 (7) Where minor road AADT data are unavailable, the primary form of the SPFs is as follows: Crashes/year = α (MajAADT) β1 (8) Where: MajAADT = The average daily traffic on the major roadway. MinAADT = The average daily traffic on the minor roadway. α ,β1,β2 = Parameters estimated in the SPF calibration process. The SPFs without minor road AADT (equation 8) were calibrated only for those sites without minor road AADT data. In specifying a negative binomial error structure, the dispersion parameter, k, was estimated iteratively from the model and the data. The dispersion parameter relates the mean and variance of the SPF estimate and is used in equations 3 and 4 of the EB procedure. For a given dataset, smaller values of k indicate relatively better models. The safety performance functions developed are presented in appendix A. Note the following in interpreting the output:
RESULTSResults were obtained for several analyses. Each State was analyzed separately, and a composite effect was obtained for all sites in each State. The most pertinent and insightful results were obtained by conducting a disaggregate analysis of the Nebraska sites where sites were grouped by various characteristics to evaluate the impact of these variables on the safety effectiveness. A disaggregate analysis was not conducted for Florida or Wisconsin because of the small sample sizes. Florida and Wisconsin sites could not be combined with Nebraska for the disaggregate analysis because of the substantially higher AADTs and crash frequencies in Florida and the predominance of type 1 installations in Wisconsin compared to the other two States. AGGREGATE ANALYSISThe aggregate results for each State individually are shown in table 6 through table 8. Combined effects for the three analyses were not estimated because the treatments and their effects vary significantly among the jurisdictions. The tables show the EB estimate of the crashes expected in the after period if the treatment had not been installed, the actual number of crashes in the after period, and the change in safety. The change in safety is the estimated percent reduction in crashes due to the strategy along with the standard error (SE) of this estimate. A negative percent reduction indicates an increase in crashes. If the magnitude of the percent change is at least 1.96 times greater than the SE, the change is statistically significant at the 95-percent confidence level. Similarly, if the percent change is at least 1.64 times greater than the SE, the change is statistically significant at a 90-percent confidence level. Safety effects that are significant at the 95-percent confidence level are denoted by bold text, which begins starting with table 8. Table 6. Results for Florida strategy sites.
Note: A negative sign (-) indicates an increase in crashes. Table 7. Results for Nebraska strategy sites.
Note: A negative sign (-) indicates an increase in crashes. Bold denotes those safety effects that are significant at the 95-percent confidence level. Table 8. Results for Wisconsin strategy sites.
Note: Bold denotes those safety effects that are significant at the 95-percent confidence level. Unlike the case for the Nebraska and Florida, left-turn opposing crashes could not be precisely identified; thus, the analysis included all non rear-end crashes involving a left-turning vehicle. Left-turn and rear-end crashes were selected as target crash types for this strategy. As presented in table 4, varying definitions of left-turn crashes were selected as the primary target crash types for this strategy. A strict definition of left-turn opposing crashes, in which one vehicle is turning left while the second is proceeding straight on the treated roadway, was not possible in Nebraska or Wisconsin due to constraints with the data. Rear-end crashes were identified as a possible target crash with the belief that they may be affected by improved left-turning vehicle operation. Similarly, the definitions of rear-end crashes varied as shown in table 4. Separate analyses were completed for left-turn and rear-end crashes to determine potential differential effects. A separate analysis was also completed for injury crashes (i.e., fatal plus all injury crashes) to determine the effects of this strategy on crash severity. The results among the three States are relatively different. The following points summarize the results for the individual State analyses:
DISAGGREGATE ANALYSISA disaggregate analysis was completed for Nebraska, the only State with a sufficient sample size to facilitate this analysis. The objective was to determine if safety effects were more or less pronounced for specific conditions. Total crashes were the only crash type included in the disaggregate analysis because of the counterintuitive results for left-turn opposing crashes. Also, there were fewer target crashes than total crashes, which reduced the certainty of a disaggregate analysis. While the disaggregate analyses indicated significant crash reductions for specific circumstances, these estimates were based on limited sample sizes and were not intended to be used as individual crash reduction factors. The results of the disaggregate analysis are summarized below. Offset Improvement TypeThe most obvious variable to examine in the disaggregate analysis is the type of offset improvement (i.e., type 1, type 2, or type 3). However, the effects by group were not statistically significant. Also, the differential effects were not statistically different from each other. Expected Number of CrashesThe variable found to be most related to the safety effectiveness was the expected number of crashes in the before period. Analysis revealed that the percent reduction in crashes increased as the expected number of crashes increased. For example, the 30 sites in Nebraska with 9 or more expected crashes per year in the before period had an 8-percent reduction in crashes compared to an insignificant 0.5-percent increase in crashes for all 92 Nebraska locations. This finding seems logical in that safety treatments are generally expected to be most effective where a safety problem is manifested in a high frequency of crashes. ECONOMIC ANALYSISThe economic analysis was conducted from two perspectives. First, a benefit-cost ratio was estimated for Wisconsin, the only State for which an overall safety benefit was detected. Second, the disaggregate analysis for Nebraska was used to identify the level of expected number of crashes that would yield a crash reduction to justify the construction costs. Wisconsin installations were almost all of the type 1 variety, involving major reconstruction with capital costs that averaged $315,873 and an estimated service life of 20 years. Assuming a discount rate of 2.8 percent for a 20-year service life, as suggested by the Office of Management and Budget (OMB), this translates into an annualized cost of $20,840.(11) Wisconsin was the only State for which a safety benefit was detected overall and for which a benefit-cost ratio could be estimated. Using recent FHWA comprehensive crash cost estimates for signalized intersections with approach speeds less than 72.45 km/h (45 mi/h), the unit crash costs were identified as $15,788 for head-on crashes and $23,872 for rear-end crashes.(8) These estimated costs include all severities combined. The results in table 8 suggest a reduction of 2.39 total crashes per site-year (subtracting the observed crashes in the after period from the expected crashes and dividing by the total site-years from table 5). Using the lower comprehensive crash cost of $15,788 as a conservative estimate of the benefit, the savings due to the reduced crashes is $37,733. This conservative value compares favorably to the annualized installation cost of $20,840 giving (conservatively) a benefit-cost ratio of approximately 2:1. Nebraska installations were mostly of the type 2 and type 3 variety, typically involving a simple modification of an existing left-turn bay that was 45.75 m (150 ft) long, for which the striping was reconfigured with thermoplastic to improve the offset. The estimated cost was $200 per approach with an 8- to 10-year service life depending on traffic volumes. Florida installations were more elaborate versions of the type 2 and type 3 installations, involving the shifting of the left-turn lanes further into the median (on divided highways). The estimated cost is $15,000 per approach, assuming a left-turn bay length of 45.75 m (150 ft) and a lane width of 3.66 m (12 ft). The service life is estimated to be 14 years. The disaggregate analysis for Nebraska showed that the strategy may be effective if implemented at sites with high crash frequencies. Based on the disaggregate results, it is possible to estimate crash frequency levels for which implementation of the strategy would be economically justified. Restriping costs, similar to those in Nebraska, are so minimal that it can be assumed that this measure can be implemented at any signalized intersection with sufficient left-turn traffic to justify a left-turn lane and permissive or protected-permissive phasing. Therefore, the focus of the economic analysis was to determine the crash reduction factor and crash frequency levels that would justify the more expensive type 2 and type 3 treatments, similar to the Florida installations, which would involve minor construction. Based on a discount rate of 2.7 percent as suggested by OMB for a 10- to 15-year service life and assuming that four approaches are reconstructed, the annualized cost is $5,067.(11) The cost requires an annual crash savings of $10,134 to justify an installation based on a 2:1 benefit-cost ratio. The required crash savings, as a dollar value, can be converted into crash frequency using the recent FHWA comprehensive crash cost estimates.(8) As before, for signalized intersections with approach speeds less than 72.45 km/h (45 mi/h), the unit costs for crashes of all severities combined range from $15,788 for head-on crashes to $23,872 for rear-end crashes. Again, using the lower crash cost as a conservative estimate, the annual crash reduction needed to justify the installation cost is 0.64 crashes per year (i.e., a 2:1 benefit-cost ratio is calculated as $10,134/$15,788 = 0.64 crashes per year). The disaggregate analysis indicates that the crash benefits increased as the expected number of crashes increased. The required crash benefit of 0.64 crashes per year could be achieved at intersections with nine or more expected crashes per year, for which the crash reduction factor is at least 8 percent. Thus, the installation of the type 2 and type 3 varieties of this strategy through reconstruction similar to the Florida installations appears to be cost-effective at intersections with at least nine expected crashes per year and where left-turn lanes are justified by traffic volume warrants. SUMMARY AND CONCLUSIONSThis study used the EB methodology to evaluate the safety effectiveness of implementing offset improvements for left-turn lanes at signalized intersections. The evaluation was based on 92 installations in Nebraska, 13 in Florida, and 12 in Wisconsin. The offset improvements varied greatly in the three States. Many of the installations in Florida and Nebraska did not result in a positive offset. Nebraska installations mostly involved a simple modification of an existing left-turn bay for which the striping which was reconfigured with thermoplastic was used to narrow the existing left-turn lane, thereby shifting left-turn vehicles further to the left and improving the offset. The Florida installations were similar in principle, but they were somewhat more elaborate in that they involved shifting the left-turn lanes further into the median (on divided highways). However, the end results in Florida and Nebraska were often less negative offsets or no offsets rather than positive offsets. Wisconsin installations involved major reconstruction to improve the offset, and all but two were conversions from negative or no offset to a positive offset. In Wisconsin, the results indicated substantial and highly significant crash reductions in all categories-total (34 percent), injury (36 percent), left-turn (38 percent), and rear-end (32 percent). The aggregate results for Florida and Nebraska showed little or no evidence that would suggest that this strategy is effective for reducing total crashes. While the results for Nebraska indicated a significant reduction in injury crashes, they also showed an increase in target crashes, including a 45-percent increase in left-turn opposing crashes and a 7-percent increase in rear-end crashes. The minimal effect on total crashes in Nebraska may be due to the fact that the strategy was implemented at a majority of signalized intersections in the Nebraska study area, including sites where an improvement may not be justified based on a specific safety concern. Thus, the positive effects where the strategy is worthwhile and warranted may be diluted by the effects at sites where the strategy is not justified. Potential increases in left-turn volumes could also explain the significant increase in left-turn crashes in Nebraska. Overall, the large variation in installation methods in the three States may explain the large difference in observed effects. The disaggregate analysis revealed that the percentage reduction in crashes increased as the expected number of crashes increased. For example, the 30 sites in Nebraska with an expected frequency of 9 or more crashes per year in the before period had an 8-percent reduction in crashes (significant at the 5-percent level) compared to an insignificant 0.5-percent increase in total crashes for all 92 Nebraska locations. This finding seems logical in that safety treatments are generally expected to be most effective where a safety problem is manifested in a high frequency of crashes. On the basis of this disaggregate analysis, the economic analysis sought to identify the level of expected number of crashes that would yield a crash benefit that would justify the construction cost. Based on this analysis, type 2 or type 3 installations through reconstruction, as was undertaken in Florida, are cost-effective at intersections with at least nine expected crashes per year, for which the expected reduction in crashes is at least 8 percent. Needless to say, the provision of left turn lanes should be justified by traffic volume warrants. The crash reduction factors found in this study are summarized in table 9. Table 9. Summary of crash reduction factors.
Note: Crashes in Wisconsin were identified as mainline crashes only. Left-turn crashes were defined as all crashes involving a left-turning vehicle that were not coded as rear-end. This study did not address offset improvements at unsignalized intersections. While there are examples of offset improvements at unsignalized intersections in the United States, these results should not be extrapolated to that situation. Rather, it is more appropriate to conduct a separate evaluation once there are sufficient installations at unsignalized intersections. Appendix: Safety Performance Functions
Florida left-turn opposing: apply model for total crashes with a proportion of 11 percent.
Table 13. Nebraska total.
Table 14. Nebraska proportions to apply to total crash model for other crash types.
Note: totalthrumaj = total thru lanes on the major road.
Note: totalthrumaj = total thru lanes on the major road. Table 17. Wisconsin left-turn.
Note: totalthrumaj = total thru lanes on the major road.
Note: totalthrumaj = total thru lanes on the major road. ACKNOWLEDGEMENTSThe project team gratefully acknowledges the participation of the following organizations and individuals for their assistance in this study:
REFERENCES
|
|||||||||||||||||||||||||||||||||||||||||||||||||||||||||||||||||||||||||||||||||||||||||||||||||||||||||||||||||||||||||||||||||||||||||||||||||||||||||||||||||||||||||||||||||||||||||||||||||||||||||||||||||||||||||||||||||||||||||||||||||||||||||||||||||||||||||||||||||||||||||||||||||||||||||||||||||||||||||||||||||||||||||||||||||||||||||||||||||||||||||||||||||||||||||||||||||||||||||||||||||||||||||||||||||||||||||||||||||||||||||||||||||||||||||||||||||||||||||||||||||||||||||||||||||||||||||||||||||||||||||||||||||||||||||||||||||||||||||||||||||||||||||||||||||||||||||||||||||||||||||||||||||||||||||||||||||||||||||||||||||||||||||||||||||||


 (3)
(3) (4)
(4) (5)
(5) (6)
(6)