U.S. Department of Transportation
Federal Highway Administration
1200 New Jersey Avenue, SE
Washington, DC 20590
202-366-4000
Federal Highway Administration Research and Technology
Coordinating, Developing, and Delivering Highway Transportation Innovations
| SUMMARY REPORT |
| This summary report is an archived publication and may contain dated technical, contact, and link information |
|
Publication Number: FHWA-HRT-10-030
Date: March 2010 | |||||||||||||||||||||||||||||||||||||||||||||||||||||||||||||||||||||||||||||||||||||||||||||||||||||||||||||||||||||||||||||||||||||||||||||||||||||||||||||||||||||||||||||||||||||||||||||||||||||||||||||||||||||||||||
Summary Report: An Evaluation of Signing for Three-Lane RoundaboutsPDF Version (569 KB)
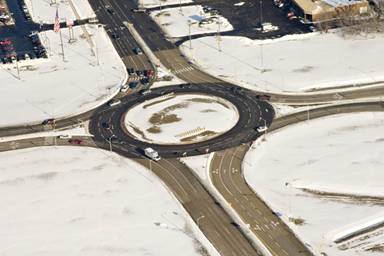
PDF files can be viewed with the Acrobat® Reader® FHWA Contact: Joe Bared, HRDS-05, (202) 493-3314, joe.bared@dot.gov INTRODUCTIONSince the introduction of the modern roundabout to North America nearly two decades ago, roundabout acceptance has continued to grow. As of 2007, there are more than 1,000 roundabouts in North America, and that number is growing rapidly.(1) This acceptance is attributed to the superior operational and safety performance of roundabouts relative to conventional signalized intersections in appropriate conditions.(2-4) Although multilane roundabouts have been found to be safer than conventional alternatives, especially with respect to injury and fatal crashes, they are not without safety challenges. One of these challenges is getting motorists to select and stay in their proper lanes as they navigate the roundabout. Some motorists take the fastest path through roundabouts by entering in the right lane, crossing to the center lane midway through the circular roadway, and then crossing back into the right lane at the exit.(5,6) This behavior creates a risk of sideswipe crashes. Another challenge for both safety and operational efficiency is that motorists sometimes have difficulty interpreting lane-control arrows in the roundabout context.(7,8) Even with these unresolved issues, the safety and operational advantages of one- and two- lane roundabouts are so substantial that engineers have begun to introduce three-lane roundabouts where traffic cannot be accommodated in one or two lanes.(9) Figure 1 shows a three-lane roundabout in Michigan.
Source: Michigan Department of Transportation Photography Unit Figure 1. Photo. Michigan three-lane roundabout. The use of three-lane roundabouts raises the concern that low comprehension and compliance could be a bigger problem than at two-lane roundabouts for the following reasons: (1) the larger radii of three-lane roundabouts enable higher speeds, (2) angles of impact in three-lane roundabouts may be more severe when errant vehicles stray across multiple lanes from their assigned lane, and (3) traffic volumes will be higher, and thus, more vehicles will be affected by incidents. The present study is intended to address this concern of low comprehension and compliance. ObjectivesThe objectives of this study are to identify signing and marking strategies that result in higher levels of comprehension and compliance in lane selection on the approach to roundabouts and to examine the effects of these strategies on lane use after an approach lane has been selected. ApproachParticipants first drove three times through a series of six different simulated three-lane roundabouts while their lane use was recorded. Following the driving simulation, participants watched videos of approaches to roundabouts and indicated which lanes they could use to reach a particular destination and which lanes they were restricted from using. These two measures indicated to researchers the extent to which participants understood roundabout lane restrictions. Probing for understanding was important because drivers tend to use the right lane for right turns and the left lane for left turns, and these selections would nearly always be appropriate. However, a three-lane roundabout might be marked such that particular turning movements could be legal from two or three lanes. If drivers do not use all allowed lanes, the roundabout might not operate at the capacity for which it was designed. The context for the evaluation was simulated roundabouts with four legs and three entry lanes. Exit leg geometry and marking configurations varied to conform to the lane restrictions. Fishhook lane restriction signs and markings, as described in the proposed revisions to the Manual on Uniform Traffic Control Devices (MUTCD), were used on all roundabout approaches except where the experimental design called for alternative navigation signage.(10) Compliance was assessed by observing which lanes drivers used on the approaches to and within the roundabouts and by assessing the extent to which drivers stayed in their initially selected lane as they navigated each roundabout. Comprehension was assessed by asking drivers to indicate which lanes they were permitted to use and which lanes they were restricted from using. Strategies employed to improve comprehension and compliance included the following:
MethodThe following three lane restriction signing conditions were tested:
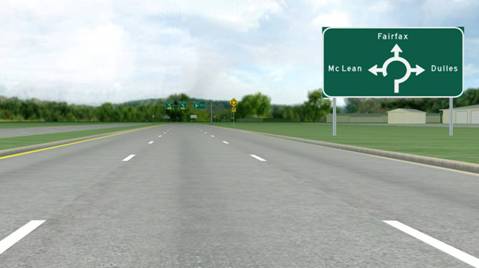
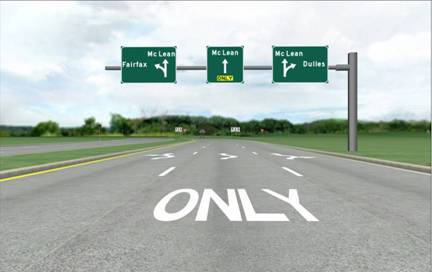
The experimental treatments were located 400 ft (122 m) from the roundabout entrance. Downstream from that location, signs and markings did not differ between signing conditions. In all three signing conditions, a diagrammatic navigation sign was located 800 ft (244 m) upstream of the entrance to the circular roadway (see figure 2). The sign was used to inform participants of the location of their destination, (i.e., the intended roundabout exit leg). Participants were instructed to drive to McLean. The exit to McLean varied from trial to trial. For each of six roundabout lane restrictions and layout combinations, the exit for McLean was to the right once, straight ahead once, and to the left once. The combination of six turn restrictions and three turning movements resulted in 18 unique trials.
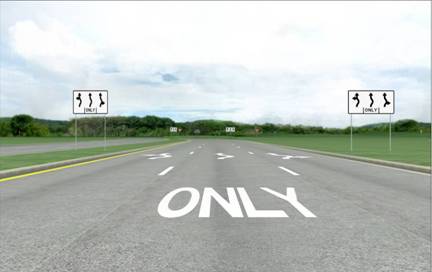
Figure 2. Screenshot. Guide sign located upstream of the circular roadway. A roundabout ahead warning sign (W2-6) was located 600 ft (183 m) upstream of each roundabout entrance. The experimental manipulation consisted of different signs 400 ft (122 m) upstream of the entrance. Figure 3 through figure 5 provide a view from the driver's perspective of the three sign conditions that include the roadside regulatory condition, the overhead regulatory condition, and the overhead navigation sign condition. Fishhook markings that matched the lane restrictions on the signs were placed in each lane 400 ft (122 m) upstream of the entrance.
Figure 3. Screenshot. Roadside regulatory condition.
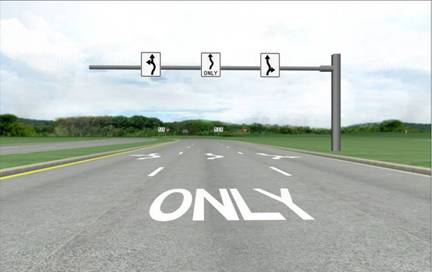
Figure 4. Screenshot. Overhead regulatory condition.
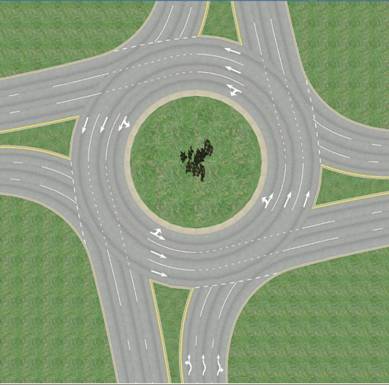
Figure 5. Screenshot. Overhead navigation condition. In all conditions, fishhook regulatory signs and markings were placed on both sides of the road 40 ft (12 m) upstream of the yield line. Fishhooks were not used on the overhead navigation signs due to space constraints and because conventional arrows were deemed sufficient for this application. All other signs and markings were consistent with the proposed amendments to the MUTCD.(10,11) Table 1 shows the six lane restrictions that were used. The geometry and markings of the circulatory roadway and roundabout exits were modified to correspond with the lane restrictions. An example of the lane restriction markings is shown in figure 6. Table 1. Six-lane restriction combinations used in the experiment.
L = Left turn only.
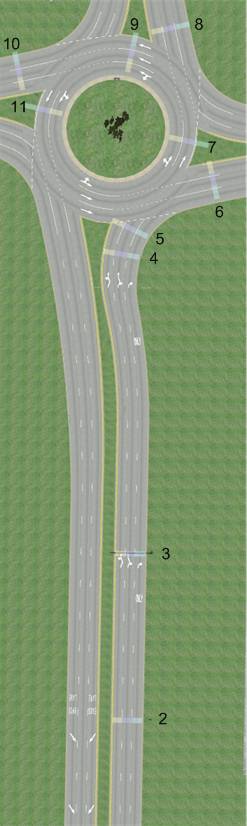
Figure 6. Screenshot. Geometry and markings for LT, T, and TR lane restrictions. Each of 18 simulated roundabouts was preceded by a one-lane roadway segment, which was 165 ft (50 m) long and widened to three lanes over a distance of 120 ft (37 m). Three lanes were available 100 ft (31 m) upstream of the diagrammatic sign for the next roundabout, which ensured that all participants started in the same lane (the center lane) at the beginning of each roundabout approach. The roadway and roundabout environment consisted of simulated grassy fields with a tree line visible in the distance. The only structure in the simulation scenario was a warehouse-like building that was to the right on the approach to all 18 roundabouts. The Driving SimulatorComponents of the Federal Highway Administration (FHWA) Highway Driving Simulator (HDS) included a 1998 Saturn SL1 chassis, five projectors each with a resolution of 2,048 by 1,536 pixels, and a 240-degree cylindrical projector screen situated 9 ft (2.7 m) from the driver's design eye point. The vehicle chassis was mounted on a 3 degree-of-freedom (roll, pitch, and heave) motion system. The vehicle dynamics model was calibrated to approximate the characteristics of a small passenger sedan. Data capture was synchronized to the frame rate of the graphics cards (mean @ 100 frames per second). Data recorded from the vehicle dynamics model included speed, vehicle position, and heading. Engine, wind, tire, and other environmental sounds were provided. ParticipantsParticipants from the Washington, DC, metropolitan area who responded to newspaper advertisements and internet postings or who heard of the study through word-of-mouth were recruited. Participants included individuals who had participated in previous FHWA studies as well as newly recruited people. Individuals who participated in the earlier roundabout signing and marking studies or had previously experienced simulator sickness were not recruited for this study. A total of 96 licensed drivers completed the study. Drivers were paid for their participation. Seven other participants dropped out before completing the study because of simulator sickness symptoms. ProceduresParticipants were randomly assigned to the 3 sign conditions, with 32 participants in each condition with equal numbers of males (24 under 65 years old and 24 at or over 65 years old) and females (24 under 65 years old and 24 at or over 65 years old). Upon arriving at the FHWA laboratory, participants were asked to read and sign an acknowledgment of informed consent. Their vision was then tested to ensure a minimum 20/40 acuity in at least one eye. Next, a brief health screening questionnaire was administered to ensure that they had no acute health impairments. Finally, participants were administered a Simulator Sickness Questionnaire (SSQ) and a postural stability test to establish a baseline for later administration of those same tests.(12,13) Simulator DrivesBefore beginning the main driving simulation, participants completed two drives that lasted about 5 minutes each to accustom themselves to the HDS. The first of these drives was on a wide roadway that was free of traffic or obstructions. On the roadway, participants were asked to accelerate, brake, and change lanes until they felt comfortable with the simulated vehicle handling. The second accustomization drive was intended to ensure that participants were exposed to simple single-lane roundabouts. Participants were instructed to drive towards McLean, which was the same instruction as in the experimental drive that followed. The specified destination was presented at least once in three directions: to the right, straight ahead, and to the left at successive single-lane roundabouts. The final drive in the simulator was the experimental drive. A series of 18 roundabouts were presented in a different random order to each participant. The roundabouts consisted of each of the six roundabout geometries coupled with the destination, McLean, which occurred once in each of three directions: to the right, straight ahead, or to the left. Participants were instructed to drive as they normally would and to obey all traffic laws. Each of the three drives was followed by an administration of the SSQ and postural stability tests to assess the extent of possible simulator sickness symptoms. QuestionnaireThe HDS was intended to allow the testers the opportunity to observe how participants drove given one of three sign conditions. It was assumed that lane choice varied in relation to how well the participants understood the signs and markings. However, the driving simulation could not unambiguously assess the extent to which participants fully understood the signs and markings. For instance, drivers might prefer to use the right lane when turning right and not use the center lane even when that use was permitted for right turns. Therefore, the driving simulation was followed by a questionnaire intended to more completely assess the participants' understanding of the lane restriction signs and markings. The questionnaire was administered on a touch screen video monitor. On an adjacent monitor, participants were asked to view the same 18 roundabout approaches that they had just driven through. The sign condition on those roundabouts was the same as that in the simulator, but the roundabouts were presented in a different random order. The video displayed the approach from before the diagrammatic sign up to the yield line, at which point, the video froze and a question appeared on the touch screen monitor. The lane-restriction markings were not visible in the frozen image. Above a picture of three lanes, the touch screen displayed the question "Which lanes can be used if you are going to McLean?" The participants were instructed to touch those lanes that could be used legally to proceed to McLean. When touched, a black ball appeared in the lane. A second touch in the same lane would remove the ball. When satisfied with the choice(s), the participants touched a box below the picture labeled "OK." The touch screen monitor then displayed "Which lanes could result in a traffic ticket if you used them to go to McLean?" above a picture of three lanes. Participants were instructed to touch the lanes that were not allowed. An orange ball appeared in the selected lanes. When the participant pressed "OK," a "Next Roundabout" button became available. Pressing that button grayed out the questionnaire screen, and a new roundabout approach was displayed on the adjacent monitor. After completing the questionnaire, participants were debriefed and compensated. Research DesignThe research design was a factorial design in which sign condition was a between-groups factor with three levels (roadside regulatory, overhead regulatory, and overhead guide sign). It was crossed with the within groups turning movement factor which also had three levels (left turn, through movement, and right turn). There were 32 participants in each sign condition. The dependent measures were all binary. The dependent measures for the HDS were lane use (correct/incorrect) and lane change within the roundabout (yes/no). The dependent measures for the questionnaire were lanes allowed (correct/incorrect) and lanes not allowed (correct/incorrect). ResultsThe findings from the driving simulation are presented first, describing the lane choice and lane-changing results. The questionnaire findings are presented after the driving simulation findings. Driving Simulation FindingsThe lane choice and lane change findings were analyzed using a generalized linear estimation model that was suitable for binary dependent measures and categorical independent variables with repeated measures.(14) Lane choice and lane changing were analyzed separately because, in many instances, more than one lane might have been an appropriate choice so that drivers could have changed lanes and still have been in an appropriate lane. However, lane changes within a roundabout were not appropriate. Therefore, once participants reached 40 ft (12.2 m) upstream of the yield line, changing lanes was not appropriate whether or not the new lane was appropriate for the assigned turning movement. Lane ChoiceLane choices were recorded at 11 locations at each of the 18 roundabouts. These locations, 10 of which are illustrated in figure 7, were as follows:
Figure 7. Screenshot. Lane selection measurement locations. At each of these locations, the lane occupied was classified as correct or incorrect. To be classified as correct, the vehicle had to be either wholly within an allowed lane or to have less than half of the vehicle's width outside of the allowed lane. Table 2 shows the percentage of drivers who were in inappropriate lanes 400 ft (122 m) upstream of the roundabout to exit the roundabout for the left-turning movement. At 400 ft (122 m), it is technically incorrect to label any lane as inappropriate; however, because there was no conflicting traffic in the simulation, there was also no reason at that point for drivers not to have moved to an appropriate lane for the upcoming maneuver. The 40-ft (12.2-m) location was where the lane demarcations became solid so that lane changes beyond that point were inappropriate. On the right side of table 2, the Wald chi-square statistic for sign condition test is shown, and the exact probability for that chi-square value is provided. The Wald chi-square value was evaluated with 2 degrees of freedom. Table 2. Percentage of drivers in an inappropriate lane upstream as a function of turning movement.
Note: Blank spaces indicate movements that do not exist, and the statistical measures are for one location at a time. Bold indicates that the probability is less than 0.05, and the condition is statistically significant. At each measurement location, from 400 ft (122 m) upstream until the appropriate exit for the assigned turning movement, a generalized linear model was fit to the data, in which direction (three categories) was treated as a repeated measure, and sign condition was treated as a between subjects categorical variable. The effects of sign condition, turn direction, and the interaction of turn direction with sign condition were tested using a generalized estimating equations model that used a binomial distribution and a logit link.(15) At location 3 (see figure 7), which was 400 ft (122 m) upstream of the yield line, the difference between signing conditions was not statistically significant, χ2 (2) = 5.1, p = 0.08. The effect of turn direction was significant, χ2 (2) = 45.0, p < 0.001, as more drivers that were intending to make left or through movements were out of position than drivers intending to turn right. The interaction of turn direction and signing condition was not statistically significant for this or any subsequent analysis. At location 4, which was 40 ft (12.2 m) upstream of the yield line, the overhead navigation sign condition was superior to either of the regulatory sign conditions. The main effect of sign condition was significant, χ2 (2) = 7.6, p < 0.05. Again, the errors were primarily associated with left and through movements averaged across sign condition as 97 percent of drivers preparing to turn right used an appropriate lane. The turning movement effect was significant, χ2 (2) = 39.7, p < 0.001. At location 5, which was where drivers crossed the yield line and entered the circulatory roadway, the findings were similar to those at the preceding measurement location. Sign condition was significant, χ2 (2) = 7.35, p < 0.05, as was the effect of turning movement, χ2 (2) = 38.2, p < 0.001. At location 6, which showed the exit for the right-turning movement, there were no significant differences between sign conditions, and 96 percent of drivers were in a correct lane. In the circular roadway at location 7, which was between the center island and the first splitter island, sign condition did not have a significant influence on appropriate lane use. The direction of the movement had a significant effect on correct lane choice, χ2 (1) = 5.2, p < 0.05. At this location, when averaged across sign condition, drivers going left were in an appropriate lane 93 percent of the time, whereas drivers going straight were in the correct lane 89 percent of the time. At location 8, which was the exit for the through movement, there was no significant sign condition effect on appropriate lane use, and drivers were in appropriate lanes 97 percent of the time. At location 9, which was in the circular roadway between the center island and the second splitter island, sign condition also had no significant influence on appropriate lane use. Drivers were in appropriate lanes 90 percent of the time. At location 10, which was at the exit for the left-turn movement, drivers used appropriate lanes only 83 percent of time, and sign condition had no significant effect on appropriate lane use. Thus, with respect to appropriate lane use, the overhead navigation sign had a positive effect before drivers entered the circular roadway and had no significant influence after they entered the circular roadway. Inappropriate Lane ChangesOnce in an appropriate lane, it was desirable that drivers did not change lanes. The occurrence of a lane change was treated as a binary variable (yes/no). As with lane choice, the data were analyzed using a generalized linear equations model with roundabout and turn direction as repeated measures. Independent variables included in the test were signing condition and turn direction when appropriate. Table 3 shows the percent of drivers who changed lanes within the circulatory roadway and the results of tests of the effect of sign condition on lane change frequency. The percentages shown in table 3 were not conditioned on whether drivers began in an allowed lane or changed to an allowed lane-all lane changes made by vehicles that used assigned roundabout exit were included. Table 3. Percent of drivers changing lanes within the circular roadway and tests of the significance of signing condition on lane changing.
* If the probability is less than 0.05, the condition is statistically significant. Questionnaire FindingsTwo response variables (dependent measures) were derived from responses to the questionnaire: (1) whether the identification of lanes that were allowed for a particular turning movement was correct or incorrect and (2) whether the identification of the lanes which could be ticketed if used of a particular turning movement was correct or incorrect (see table 4). A generalized linear equation model was used to test for the significance of the sign condition. A binary distribution with logit links was used. Table 4. Percentage of incorrect responses in identifying allowable and prohibited lanes for turning movements.
As can be seen in table 4, the sign condition effect was not statistically significant for either the lanes allowed question or the lanes ticketed question. However, the percentages of incorrect responses roughly matched the percentages of inappropriate lane use in the driving simulation. Also, for responses to the question "Which lanes are you allowed to use?" the two overhead signing conditions combined produced marginally better comprehension than the roadside signage, χ2 (1) = 4.0, p < 0.05. DiscussionThe simulation and questionnaire results suggest the following: (1) overhead navigation signing in advance of multilane roundabouts yielded better compliance with lane restrictions than regulatory signing alone, and (2) a substantial percentage of drivers, perhaps up to 20 percent, did not understand lane restrictions in the context of roundabouts. Although overhead advance navigations signs can increase comprehension to about 90 percent, that benefit applies primarily to roundabout approaches. Drivers changed lanes within the roundabouts at rates of 10 to 25 percent. It should be noted that no other vehicles were present in the driving simulation. Informal field observations suggest that drivers are more likely to stay in their lane when other vehicles are present. However, drivers are not always aware of other vehicles, so a high likelihood of improper lane changes, as observed in this study, is likely to be associated with higher crash rates. Previous FHWA studies have reported the widespread misunderstanding of lane restriction signs and pavement markings in the context of roundabouts. Those studies were criticized for not including full context or redundant signs and markings. The present study included all of the signs and markings-both required and optional-that are included in the most recent proposed revisions to the MUTCD.(10) Nevertheless, the rates of misunderstanding are similar to those reported previously. The overhead advance navigation signage in the navigation sign condition considerably improved driver compliance and comprehension. However, at multilane roundabouts, getting drivers to navigate to the appropriate lanes and stay in them remains a challenge. Conclusions and RecommendationsOverhead advance navigation signage is more favorable for roundabouts with three entering lanes. The proposed amendments to the MUTCD include a requirement, "Where the number of lanes available to through traffic on an approach is three or more, Mandatory Movement Lane Control (R3-5 and R3-5a) symbol signs, if used, shall be mounted overhead..."(16) The present findings support that requirement and further suggest that navigation signs at least supplement any other overhead lane-restriction signing. At the time this summary report was prepared, four three-lane roundabouts were operating in Michigan. One of those, at MI-53 and Van Dyke Avenue in Sterling Heights, MI, has been operating since 2003. Initially, the approach signing consisted of ground-mounted regulatory symbol signs. When the inappropriate lane changes resulted in a higher than expected crash rate, the Michigan Department of Transportation installed a series of ground-mounted diagrammatic guide signs that designated lanes to be used for particular destinations. Although it is too soon to say whether the navigation signs have reduced the crash rate, this example confirms the importance of providing guidance for drivers to choose and stay in lanes appropriate for their destination. It appears that additional treatments beyond the overhead signs tested in this study are needed to keep drivers from changing lanes within roundabouts. One possible way to keep drivers in their lanes is to use a turbo roundabout, which has been adapted in several continental European countries.(17) The turbo roundabout uses raised mountable curbs between lanes to discourage lane changes. This design also encourages drivers to move into the appropriate lanes before entering the roundabout. Another possibility for keeping drivers from changing lanes once they are guided to appropriate lanes includes installing enhanced lane markings and other forms of channeling such as rumble strips. Lane-marking enhancements might include wider lines between lanes. Research is needed to explore the effectiveness of turbo roundabouts or other novel treatments to improve driver comprehension of and compliance with lane restrictions at multilane roundabouts. References
|