Chapter
7 - Conclusions and Recommendations
Project
Overview
 The current study was carried out for the Federal Highway Administration
(FHWA) to develop information on the range of events causing injury
to pedestrians and bicyclists. Traditional information sources such
as FARS and State motor vehicle crash files primarily capture information
on pedestrian and bicyclist injury events that: (1) involve a motor
vehicle and (2) occur on a public roadway. Many more pedestrians and
bicyclists, however, are injured as the result of falls that do not
involve a motor vehicle and in locations (sidewalks, trails, parking
lots, etc.) other than the roadway, but over which FHWA and local transportation
departments may have some jurisdiction. While seldom reported by law
enforcement officers, these cases frequently result in hospital emergency
department visits. Thus, the current study used emergency department
data to provide more complete information on these other types of events.
The current study was carried out for the Federal Highway Administration
(FHWA) to develop information on the range of events causing injury
to pedestrians and bicyclists. Traditional information sources such
as FARS and State motor vehicle crash files primarily capture information
on pedestrian and bicyclist injury events that: (1) involve a motor
vehicle and (2) occur on a public roadway. Many more pedestrians and
bicyclists, however, are injured as the result of falls that do not
involve a motor vehicle and in locations (sidewalks, trails, parking
lots, etc.) other than the roadway, but over which FHWA and local transportation
departments may have some jurisdiction. While seldom reported by law
enforcement officers, these cases frequently result in hospital emergency
department visits. Thus, the current study used emergency department
data to provide more complete information on these other types of events.
Eight
hospitals in three States (California, New York, and North Carolina)
participated in the study. Each collected information on injured pedestrians
and bicyclists treated in their emergency department over approximately
a 1-year time period, using a special two-page survey form. The form
placed particular emphasis on the location of the injury event and whether
or not a motor vehicle was involved. A total of 2,802 cases were reported,
2,558 of which met the study criteria for a bicyclist or pedestrian.
In addition to the emergency department data, hospital discharge and
motor vehicle crash data were obtained from each of the three participating
States and examined in conjunction with the emergency department data.
The results
presented in this report were primarily descriptive tabulations that
addressed the following research questions:
- What
are the frequency and characteristics of bicycle injury events
that occur in non-roadway locations and/or those that do not involve
a motor vehicle, and how do they differ from bicycle-motor vehicle
crashes that occur on the roadway? (chapter 3)
- What
are the frequency and characteristics of pedestrian injury events
that occur in non-roadway locations and/or those that do not involve
a motor vehicle, and how do they differ from pedestrian-motor vehicle
crashes that occur on the roadway? (chapter 4)
- What
role does alcohol play in each of these events? (chapter 5)
- What
are the estimated frequencies of motor vehicle and non-motor
vehicle, and roadway and non-roadway events causing injury to pedestrians
and bicyclists? (chapter 6)
Key
Study Findings and Recommendations
Chapters 3, 4, and 5 each contain summaries of key findings that
will not be repeated here. Each of the chapters expands on the injury
matrix introduced in chapter 1. This matrix (see figure 1) categorized
events according to their place of occurrence (roadway or non-roadway)
and whether or not a motor vehicle was involved. For bicyclists, the
distribution of cases based on the obtained hospital emergency department
data is shown in table 64. These results suggest that statewide crash
files, which are limited primarily to events that involve a motor vehicle
and those that occur on the public roadway, are likely to capture less
than a third of bicyclist injury cases serious enough to require emergency
department treatment. In reality, they capture far fewer, since the
results reported in chapter 6 showed that anywhere from 40 to 60 percent
of the bicycle-motor vehicle cases were not reported in official State
files.
Table
64. Distribution of bicyclist injury cases by place of occurrence
and motor vehicle involvement status.
| Place
of Occurrence |
Motor
Vehicle |
Non-Motor
Vehicle |
Overall |
| Roadway |
30.6%
|
38.0% |
68.6% |
| Non-Roadway |
2.5%
|
28.9% |
31.4% |
| Overall |
33.1% |
66.9% |
100.0% |
Table
65 shows the distribution of pedestrian injury cases identified by the
participating hospital emergency departments. These results are similar
to those for bicyclists, but with a smaller percentage of the pedestrian-only
or "fall" events (i.e., non-motor vehicle) occurring in the roadway, and
a correspondingly larger percentage occurring on sidewalks, in parking
lots, and at other non-roadway locations. Again, less than a third of
the injury events serious enough to require emergency department treatment
involved a motor vehicle traveling on the roadway. Furthermore, the results
of chapter 6 showed that 35 to 55 percent of these events may go unreported.
Table
65. Distribution of pedestrian injury cases by place of occurrence
and motor vehicle involvement status.
| Place
of Occurrence |
Motor
Vehicle |
Non-Motor
Vehicle |
Overall |
| Roadway |
32.6%
|
14.0% |
46.6% |
| Non-Roadway |
4.5%
|
48.9% |
53.4% |
| Overall |
37.1% |
62.9% |
100.0% |
Tables
64 and 65 are based on the total sample of reported emergency department
cases. However, even among the subset of those injured seriously enough
to require hospitalization, non-motor vehicle and non-roadway events continued
to play a prominent role. Sixteen percent of hospitalized bicyclists were
injured in non-roadway locations and 42 percent were injured in events
that did not involve a motor vehicle. For hospitalized pedestrians, the
corresponding percentages were 26 percent non-roadway, 24 percent non-motor
vehicle.
These
findings lend strong support to previous research (summarized in chapter
2) carried out in this country, as well as in Australia, New Zealand,
and a number of European countries, showing that reliance on official
road accident statistics greatly underestimates the number of injured
bicyclists and pedestrians. In light of the U.S. goal of increasing
levels of bicycling and walking, they also reinforce the need for continued
and strengthened efforts toward creating a safer environment for these
non-motorized transportation modes. These efforts need to move beyond
the roadway and beyond thinking about bicyclists and pedestrians only
as they interact with motor vehicles. Sidewalks and trails need to be
viewed as important transportation facilities in their own right, parking
lots need to be built with pedestrians and bicyclists in mind, and all
facilities accommodating non-motorized transportation need to be well
designed and well maintained.
In addition
to documenting the role of non-motor vehicle and non-roadway events
resulting in injury to pedestrians and bicyclists, the descriptive tables
and figures contained in this report provided insight into the nature
of these events and potential countermeasures that could improve pedestrian
and bicyclist safety. Although the conclusions that can be drawn from
a descriptive analysis are limited, the following areas stand out and
may warrant further investigation:
- Alcohol
was a significant contributing factor in both pedestrian and bicyclist
injury events, especially those involving a motor vehicle. Nearly
a third of pedestrian-motor vehicle crash victims ages 25-44, and
22 percent of those ages 45-64, were reported to have been drinking.
For bicyclists, 15 percent of adults age 20 and above had been drinking.
Alcohol use was more prevalent among males and during the late evening
and early morning hours. It was also associated with a higher rate
of hospitalization. Future public education efforts should target
the dangers of drinking and walking and drinking and bicycling as
well as drinking and driving.
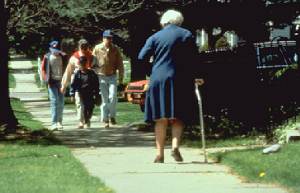
- Sidewalks
were a frequent site of bicyclist and pedestrian injury events not
involving motor vehicles. Although the vast majority of both bicycle-motor
vehicle and pedestrian-motor vehicle collisions occurred on the roadway,
43 percent of the bicycle-only events occurred off the roadway, and
half of these were on sidewalks. For pedestrians, 78 percent of non-collision
events occurred off the roadway and over half (58 percent) of these
were on sidewalks. Young children were particularly overrepresented
in sidewalk injury events, as were senior pedestrians age 65+.
- Equipment
such as in-line skates and skateboards can make being a pedestrian
particularly hazardous. Of the nearly 200 pedestrian-only events that
occurred in the roadway, one-fourth involved the use of in-line skates
and an additional 5 percent involved persons on skateboards. Off-road,
the situation was not much safer: 12 percent of the injured pedestrians
were using in-line skates and 3 percent were using skateboards. These
percentages are combined for all ages and would be higher for teens
or young adults. While education efforts might help to alert young
people to the dangers of these activities, a better alternative might
be to provide a safer environment for skating, such as a network of
well-maintained off-road trails.
- In climates
where winter months are accompanied by snow and ice, off-road
locations such as sidewalks, parking lots, and driveways can be especially
hazardous for pedestrians. In Buffalo, New York, which experienced
considerable snow and ice during the winter of 1995-96, over a fourth
of all pedestrian injuries reported by the hospitals during the
entire year of data collection were icy weather related. The vast
majority of these injury events occurred off the roadway and did not
involve a motor vehicle. In addition to clearing roadways and making
them safe for motor vehicle travel, sidewalks, driveways, and parking
lots need to be made as safe as possible for pedestrian travel. Too
often, roadways are cleared at the expense of sidewalks, and little,
if anything, is done to help pedestrians negotiate parking lots once
they arrive at their destinations. Middle-aged adults were more susceptible
to icy weather-related falls than were either young persons or older
adults, perhaps due to their greater exposure.
- For
this sample of injured bicyclists, reported helmet use was
highest among children under 15 years of age, and among those injured
in bicycle-only events occurring off the roadway. However, emergency
department personnel were unable to determine helmet use in about
20 percent of the cases, and may have relied on self-reports or observations
of head/face injuries in many instances. Assessing helmet use is clearly
a difficult task in an emergency department setting. And in the absence
of any exposure or control data, it is not an appropriate data source
for evaluating the effectiveness of helmets in preventing or lessening
the severity of head injuries.
- An incidental
but intriguing result was the discovery that 7 of the 91 pedestrian-motor
vehicle cases identified in the two North Carolina emergency department
files were matched to bicycle-motor vehicle crashes in the
State crash file. This suggests that emergency department personnel
may not always be aware that the individual they are treating was
riding a bicycle at the time he or she was struck. As a result, hospital-based
sources may overestimate the number of pedestrian-motor vehicle cases,
while underestimating the number of bicyclist-motor vehicle cases.
Further research (e.g., a follow-up telephone survey of individuals
identified in hospital or emergency department records as pedestrians)
could help to clarify the issue.
Two final
comments are in order. The current study was not very successful in
producing firm projections of the overall numbers of injured pedestrians
and bicyclists. Possible reasons for this are outlined in the discussion
section of chapter 6, and include the limited sampling of hospitals
within the selected States and the difficulty in defining and capturing
information on pedestrian-only events. However, the difficulties experienced
in this study also underscore the desirability of establishing routine
linkages between hospital and motor vehicle crash databases, and for
requiring E-coding of hospital inpatient as well as outpatient (emergency
department) cases. Linked together, police and hospital databases can
provide more complete information on a much broader range of pedestrian
and bicyclist injury events. Efforts such as CODES (Crash Outcome Data
Evaluation System) initiated by the National Highway Traffic Safety
Administration are making this possibility a reality in a number of
States.
The current
study was also limited in that no exposure data were collected for analysis
in conjunction with the pedestrian and bicyclist injury data. Relevant
exposure data has been a long-standing need in the area of non-motorized
safety research. In the absence of such data, it is not possible to
draw definitive conclusions regarding the level of risk associated with
specific locations, behaviors, etc. The safety of riding a bicycle on
the sidewalk, for example, or walking in a parking lot, is best assessed
if information is available on the total numbers of individuals bicycling
on sidewalks or walking in parking lots, i.e., those who are uninjured
as well as injured. One of the few studies to collect such information
was carried out by the Consumer Products Safety Commission (Rodgers,
1993). Information on injured bicyclists was collected from cases reported
to a national sample of hospital emergency departments, and exposure
data from a national telephone survey. Combining the two sources of
information, the Commission was able to conclude, for example, that
the risk of injury for children riding bicycles in the street was about
eight times greater than riding on bicycle paths, and nearly two times
greater than riding on sidewalks.
What this study has provided is information on the numbers of
bicyclists and pedestrians being injured, the types and locations of
events that cause these injuries, the nature of the injuries, and some
details on the characteristics of these events and the persons injured.
In doing so, it has broadened the usual definition of pedestrian and
bicyclist, at least from the traditional highway safety perspective,
and has encouraged a more comprehensive approach to creating a safer
environment and promoting greater use of these non-motorized transportation
modes. |