
 |
Budget Submission Draft
|
FHWA Vision |
| Connecting America |
Our Nation is held together by the most extensive transportation network in history. The highway system connects people to jobs, hospitals, places of worship, cultural and sporting events, national parks, and to family members across the country. It also provides a vital link in our country's economic development and national defense - connecting manufacturers to retailers, farms to markets, military installations to deployment stations and shippers to seaports, airports and railroads
The Federal Highway Program: Throughout its history, the Federal Highway Administration (FHWA) has met the ongoing challenge of adapting to the changing times. With the Interstate System essentially complete, our focus has turned toward the post-Interstate era. Through the landmark Intermodal Surface Transportation Efficiency Act of 1991 (ISTEA) and its 1998 successor, the Transportation Equity Act for the 21st Century (TEA-21), our emphasis has been updated to meet the demands of an increasingly urban, mobile, diverse, and prosperous society
In addition to preserving the taxpayers' investment in the Interstate System, the FHWA is working with its partners in the State transportation departments to improve the larger National Highway System (NHS) of 160,000 miles. The NHS includes the Interstate System and other roads of national importance, such as roads important for national defense and highway connectors to intermodal facilities.
The Federal-Aid Highway Program, begun in 1916, operates today with a budget of nearly $30 billion a year. Our varied funding programs include financial aid for nearly 1 million miles of roadways, as well as bridges, ferries, traffic operations centers, transit, recreational trails, bicycle facilities, pedestrian facilities, scenic byways, and historic transportation facilities. Now State and local officials can select the best mix of projects to address their unique transportation challenges.
We also continue our historic role, dating to the 1910's, of helping Federal land management agencies develop, preserve, and improve transportation access to Federal lands. The Federal Lands Highways Program, authorized at more than $700 million a year, provides planning, design, and construction support for forest highways, parkways, park roads, Indian reservation roads, refuge roads, and other Federal roads.
Transportation research and development is crucial to the future of our highway system. We operate a world-class research laboratory, the Turner-Fairbank Highway Research Center in McLean, Virginia. Working with our public and private partners, the FHWA is identifying research needs, coordinating and conducting studies and, most importantly, sharing results around the world. The objective of our research is to provide better, safer, longer lasting, more environmentally sound, and less costly transportation products.
Another important function is more efficient operations though ITS technologies for advanced traffic operations, communications, vehicle detection, and camera technologies to provide real-time travel information. FHWA will expand its emphasis on operations to provide solutions to many of the challenges of the 21st century.
| Funding |
The Highway Trust Fund: The Federal Highway Trust Fund (HTF) is the principal source of funds for Federal surface transportation programs. Established by the Highway Revenue Act of 1956, and extended periodically through subsequent legislation, the HTF receives revenues from excise taxes on gasoline, diesel, and other motor fuels, as well as several excise taxes related to heavy trucks. The HTF has two accounts: Highway and Mass Transit. The programs of FHWA are supported by the Highway Account
Program Activity: The Transportation Equity Act for the 21st Century and prior highway authorization acts provide for the apportionment and allocation of funding to the States in the form of contract authority. This allows the FHWA to enter into project agreements with States in advance of appropriations providing for cash reimbursements. The obligation of Federal funds constitutes the Federal government's commitment to pay a State for the Federal share of a project's cost, and occurs when a project is approved and a project agreement is executed. Annual spending is regulated through obligation limitation, which, in simplest terms, says that only a certain percent of each dollar may be spent, or "obligated." This limitation allows Congress to respond to changing budgetary conditions while assuring continuity of the program. Reimbursements, or cash outlays, occur upon request by a State after costs have been incurred
| FHWA Vision: Create the best transportation system in the world. |
The FHWA, in partnership with the State, local and private transportation communities, is preparing for the future. Our vision is to create the safest, most efficient and effective highway intermodal transportation system in the world for the American people—a transportation system where everyone has access within and beyond their community and to the world; a transportation system where crashes, delays, and congestion are significantly reduced; a transportation system where freight moves easily and at the lowest costs across towns, States, and international borders; a system which does not degrade the human and natural environment; a system that supports our country's national defense mobility; and a system where essential transportation services are restored immediately after disasters and emergencies.
| FHWA Mission: We continually improve the quality of our Nation's highway system and its intermodal connections. |
We carry out this mission by providing leadership, expertise, resources and information in cooperation with our partners to enhance the country's economic vitality, quality of life, and environment.
| Goals |
For more than 100 years FHWA has concentrated on building and repairing the highway infrastructure. In the last decade of the 20th Century, FHWA's role expanded dramatically and is now reflected in six strategic goals, Safety, Mobility, Productivity, Human and Natural Environment, National Security, and Organizational Excellence
Our goals are fully aligned with DOT's strategic goals, and our progress in achieving them will contribute to the overall transportation goals of the Nation.
Safety: Continually improve highway safety
Safety on our highways is our top priority. Tragically, more than 41,000 Americans die, and 3.2 million are injured in motor vehicle accidents on our highways each year. As more people travel more miles on the highways and as the demographics of our driving population change, significant improvements in highway safety are essential to continue our progress in reducing highway fatalities and injuries. Safety is a key objective in all our programs and activities.
Mobility: Continually improve the public's access to activities, goods, and services through preservation, improvement, and expansion of the highway transportation system and enhancement of its operations, efficiency, and intermodal connections
Mobility, as much as any other factor, defines us as a Nation. Almost 90 percent of all personal transportation takes place on highways. It connects people with work, school, community services, marketplaces, and each other. By connecting air, transit, rail, and port facilities and terminals, highways are the backbone of the Nation's intermodal transportation system.
Through this goal, we provide national leadership for continually improving the quality of our infrastructure and its operations. We research longer-life pavements, build more environmentally-friendly facilities, and use better techniques for reconstructing highways that minimize delays and maximize the capacity of our existing highways by improving operations of existing facilities.
Productivity: Continuously improve the economic efficiency of the Nation's transportation system to enhance America's position in the global economy
Transportation accounts for nearly 11 percent of our Nation's gross domestic product. In our increasingly intermodal transportation network, highways are crucial in almost all freight movements, serving as connectors to water, rail, and air facilities. Approximately 70 percent of all freight is transported over our highways.
Despite the fact that the United States has one of the best long-distance highway networks, capacity problems, especially in large urban areas, are reaching critical proportions. At an average hourly operating cost of $40 to $60 for long-haul vehicle operations, disruptions can be costly to carriers and shippers— and ultimately, to the consumer.
Human and Natural Environment: Protect and enhance the natural environment and communities affected by highway transportation
Transportation has major effects on our quality of life—where we choose to live and how we get to jobs, services, shopping, and recreation. FHWA enhances the community and social benefits of transportation by supporting welfare-to-work, mobility for people with low incomes, and accessibility for people with disabilities. FHWA also helps reduce the adverse effects of transportation on the natural environment by protecting wetlands, air quality, water quality, endangered species, and habitat.
National Security: Improve the Nation's national defense mobility
The FHWA is committed to improving the Nation's national defense mobility by improving the capacity and operation of the highway system. Highways are critical links for mobilizing and deploying military forces from U.S. bases to railheads, seaports, and airports.
Sometimes, an emergency or destruction by natural disaster goes beyond local and State capabilities. In these situations, the Federal Government is called upon to help. The Federal Government provides State and local governments with personnel, technical expertise, equipment, and other resources.
Organizational Excellence: Advance FHWA's ability to manage for results and innovation
The FHWA Organizational Excellence goal recognizes and provides greater attention to the connection between how an organization operates and the results, i.e. outcomes, it is able to achieve. The new Organizational Excellence goal emphasizes not only the importance of quality management but also the importance of measuring how we do business in order to continuously improve our performance.
| Corporate Management Strategies |
FHWA's Corporate Management Strategies (CMS) serve as internal guidance designed to enable us to effectively and efficiently achieve our strategic goals. The CMS are based on the seven universally accepted criteria that comprise the Malcolm Baldrige and President's Quality Award criteria. These criteria are the strategies of the FHWA Quality Journey.
Leadership: Strengthen the FHWA Leadership System, through training and other developmental initiatives, for the agency's new organizational structure
FHWA leaders are responsible for leading the FHWA Quality Journey and for carrying out its Corporate Management Strategies. Leaders set the vision and direction, ensure accountability, and provide the resources to deliver the products and services to our customers in an excellent and timely manner.
Strategic Planning:Translate strategies into unit, division, team, and individual action plans with performance measures based on the strategic objectives and performance goals
Strategic Planning is essential to the long term viability of the Agency. FHWA Leadership uses the Strategic Plan to set the direction for the Agency, to prepare annual performance plans, and to allocate resources for attaining our strategic goals. The Plan is deployed throughout the Agency to the unit, division, team, and individual level.
Customer/Partner Focus: Identify customer and partner needs and measure their level of satisfaction
FHWA achieves success through extensive cooperation and partnering with State and local transportation agencies. We receive and act upon feedback from customer surveys, listening sessions, focus groups and other learning techniques. We use that information to improve products and services to ensure customer and partner needs are met.
Information and Analysis: Identify and develop key business information systems that meet and track DOT and FHWA strategic goals
FHWA needs information to support key processes and improve performance. Leaders create an environment in which knowledge, as a key asset of the organization, is managed, shared, and used effectively.
Human Resource Development and Management: Increase employee technical competence, authority and the tools needed to meet agency and customer needs
FHWA's successful performance depends on a work force with skills aligned with the Agency's objectives. We continue to develop and utilize the full potential of our human resources and to create an environment conducive to performance excellence and personal and organizational growth.
Process Management: Design, manage, and improve key processes to achieve better performance
FHWA uses customer-focused support, service and delivery processes to continually improve performance and enhance our products and services. We utilize employee appropriate feedback mechanisms and assessments from customers and partners.
Business Results: Develop critical FHWA business metrics to measure the overall quality of processes and services and report results
We will use customer feedback and benchmark high-performance organizations to continuously improve our overall performance for our customers.
| Strategic Goal: Continually improve highway safety. |
| Strategic Objective: Reduce the number of highway-related crashes and their consequences (fatalities and injuries). |
| Fatalities and Injuries |
Highway-related crashes, injuries, and fatalities take a heavy personal toll on American families and cost the Nation's economy more than $150 billion annually. Over 41,000 Americans died in 2000 and over 3.2 million were injured as a result of motor vehicle crashes.
Performance Goal: Reduce the rate and number of highway-related fatalities and injuries. In FY 2002, FHWA's goal is to reduce the rate of highway-related fatalities to 1.4 per 100 million vehicle miles traveled and reduce the rate of injuries to 111 per 100 million vehicle miles traveled. These fatality and injury rate reduction performance goals are shared with the National Highway Traffic Safety Administration (NHTSA).
In seeking to achieve the overall U.S. DOT goal regarding numbers of fatalities and injuries by the year 2008 [33,500 and 2,809,000, respectively], we are setting an FY 2002 benchmark of reducing the number of highway fatalities to 38,907 and reducing the number of highway injuries to 3.09 million.
Performance Measures and Benchmarks:
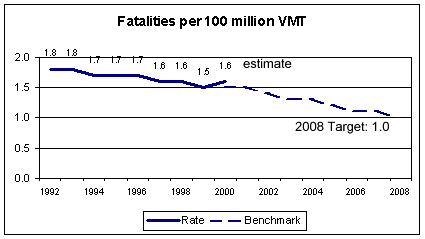
| Trend | Benchmark | |
|---|---|---|
| 1992 | 1.8 | |
| 1993 | 1.8 | |
| 1994 | 1.7 | |
| 1995 | 1.7 | |
| 1996 | 1.7 | |
| 1997 | 1.6 | |
| 1998 | 1.6 | |
| 1999 | 1.5 | |
| 2000 | 1.6 | 1.5 |
| 2001 | 1.5 | |
| 2002 | 1.4 | |
| 2003 | 1.3 | |
| 2004 | 1.3 | |
| 2005 | 1.2 | |
| 2006 | 1.1 | |
| 2007 | 1.1 | |
| 2008 | 1 |
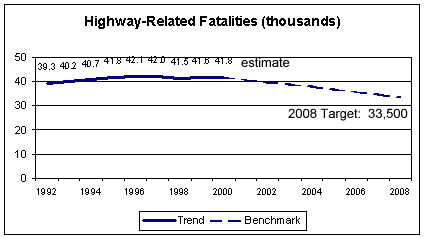
| Trend | Benchmark | |
|---|---|---|
| 1992 | 39.3 | |
| 1993 | 40.2 | |
| 1994 | 40.7 | |
| 1995 | 41.8 | |
| 1996 | 42.1 | |
| 1997 | 42.0 | |
| 1998 | 41.5 | |
| 1999 | 41.6 | |
| 2000 | 41.8 | 41.8 |
| 2001 | 40.8 | |
| 2002 | 39.8 | |
| 2003 | 38.8 | |
| 2004 | 37.7 | |
| 2005 | 36.7 | |
| 2006 | 35.7 | |
| 2007 | 34.7 | |
| 2008 | 33.506 |
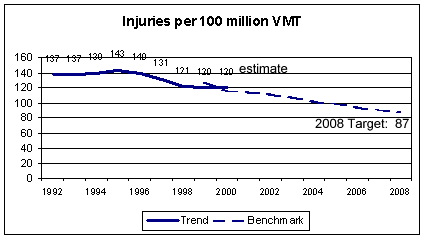
| Trend | Benchmark | |
|---|---|---|
| 1992 | 137 | |
| 1993 | 137 | |
| 1994 | 139 | |
| 1995 | 143 | |
| 1996 | 140 | |
| 1997 | 131 | |
| 1998 | 121 | |
| 1999 | 120 | 127 |
| 2000 | 120 | 116 |
| 2001 | 113 | |
| 2002 | 111 | |
| 2003 | 107 | |
| 2004 | 102 | |
| 2005 | 98 | |
| 2006 | 94 | |
| 2007 | 90 | |
| 2008 | 87 |
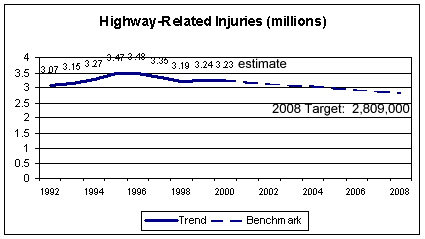
| Trend | Benchmark | |
|---|---|---|
| 1992 | 3.07 | |
| 1993 | 3.15 | |
| 1994 | 3.27 | |
| 1995 | 3.47 | |
| 1996 | 3.48 | |
| 1997 | 3.35 | |
| 1998 | 3.19 | |
| 1999 | 3.24 | |
| 2000 | 3.23 | 3.23 |
| 2001 | 3.18 | |
| 2002 | 3.12 | |
| 2003 | 3.07 | |
| 2004 | 3.02 | |
| 2005 | 2.96 | |
| 2006 | 2.91 | |
| 2007 | 2.86 | |
| 2008 | 2.81 |
External Factors: Vehicle travel is expected to grow at approximately 2 percent per year. Fluctuations in VMT, as happened in 2000 when VMT did not grow, will affect fatality and injury rates. Lane mileage has increased less than ½ of 1-percent per year in recent years, which means more and larger vehicles will be competing for limited road space. In addition, the highest risk population groups—older drivers and drivers aged 15 to 24—will grow at faster rates than the overall population. In response to these and other external factors, FHWA works with other organizations such as NHTSA and the National Association of Governors' Highway Safety Representatives (NAGHSR) to assure that a comprehensive approach to highway traffic safety is taken at the National, State, and local levels.
2000 Results: Based on preliminary estimates (as of March 2002), DOT met neither the highway fatality nor injury rate target. The estimated 41,800 fatalities in 2000 increased slightly (0.5%) from the 1999 total of 41,611.
This creates a challenging situation for FHWA and other modal agencies within the U.S. DOT, as we continue to focus on programs and policies that can further drive these unacceptable numbers downward.
Congress passed legislation to transfer FHWA's motor-carrier safety functions to the Federal Motor Carrier Safety Administration (FMCSA) as of January 1, 2000. As a result, FHWA no longer tracks indicators specific to large truck safety. We will continue to work closely with the FMCSA. Our efforts to reduce the occurrence and mitigate the consequences of crashes benefit all highway users.
FY 2001 Performance Plan Evaluation: As stated in the "2000 Results" section, long-term reductions in fatalities and injuries appear to be leveling off. This situation presents serious challenges to achieving continuing progress in improving highway safety, and FHWA is responding aggressively through advancing programs that address leading causes of fatalities and injuries. For FY 2001, FHWA is directing resources to the focus areas of run-off-road crashes, speed-related crashes, intersection crashes, and pedestrian / bicyclist crashes. Further, in cooperation with the NHTSA, FHWA will also continue to support programs to increase seat belt use and reduce alcohol-impaired driving. In delivering these programs, FHWA will continue to work with the States to identify State-level opportunities to influence the National trends.
Strategies and Initiatives to Achieve 2002 Goal: As pointed out above, FHWA and U.S. DOT share a challenging task in advancing our highway safety objectives. While we should recognize the reductions in rates of fatalities and injuries to which U.S. DOT programs have contributed, the safety community needs to intensify its focus on problem areas and efforts to pursue appropriate countermeasures. To further reduce crashes, injuries, and fatalities, attention must be placed on target crash types that most affect fatalities and injuries.
To carry this approach forward, FHWA will focus on a set of infrastructure and operations topics that most affect fatalities on America's roadways. This is part of a comprehensive approach in which NHTSA focuses attention on issues such as driver training, prevention of impaired driving, and increasing the use of seat belts, and FMCSA carries out programs aimed at commercial motor carriers and drivers. In many of these areas, FHWA works in close partnership with NHTSA, NAGHSR, the American Association of State Highway and Transportation Officials (AASHTO), and the National Association of County Engineers (NACE). For each of these topics, we seek to expand implementation of proven countermeasures and to develop and improve products which use advanced technology. We are actively investigating Intelligent Transportation Systems (ITS) technologies, including Intelligent Vehicle Initiative (IVI) elements, and deploying these products where appropriate.
The focus areas that FHWA will concentrate on include:
Single-Vehicle Run-off-the Road (ROR) Crashes - Typically caused by inattention, drowsiness, or avoidance maneuvers, ROR crashes are a contributing cause for 38% of fatalities. FHWA's two - pronged approach will concentrate efforts on both keeping vehicles within the roadway travel lane and minimizing harmful effects when vehicles do leave the roadway. Major initiatives relating to ROR crashes include improving pavement skid resistance, increasing the visibility of signs and pavement markings, increasing the use of rumble strips (where appropriate), upgrading roadside safety hardware (i.e., guardrail, crash barriers), improving design practices, and mitigating effects of utility poles and other roadside hazards.
Intersections - Extensive work will be devoted to development of a comprehensive program to address crashes at or near intersections, which account for 23% of fatalities. Significant efforts in areas such as red-light-running, road safety audits, and intersection design are underway, and significant increases to address this overall issue are planned. In addition, intersection safety benefits from several related initiatives, such as speed management and pedestrian-oriented efforts, which are being undertaken jointly between FHWA and NHTSA.
ITS/IVI products and technologies that hold strong promise to address intersection crashes are under development.
Speed-Related Crashes - Speed contributes to 30% of fatalities, and FHWA and NHTSA work together on a comprehensive Speed Management Team. FHWA's activities will be focused in two main areas: 1) Promotion of variable speed limits, which use ITS tools for gathering speed and volume, weather, and road surface information to determine appropriate speeds at which drivers should be traveling given current conditions, and 2) Promotion of reasonable and safe posted (static) speed limits that are enforceable and accepted by the driving public as being set on a rational basis. We also conduct outreach to both the technical audience and the general public on speeding and its implications.
Pedestrian / Bicycle Safety - The U.S. DOT supports making the Nation's roads safer for all road users, including bicyclists and pedestrians, who account for 13% of fatalities. FHWA and NHTSA will work with our partners to increase safe walking and bicycling by focusing on integrating pedestrian and bicyclist issues in the planning and design of facilities, researching and developing comprehensive countermeasures and appropriate tools and technologies, and implementing key recommendations from experts. FHWA will continue efforts to provide engineering and ITS approaches to increase the safety of bicyclists and pedestrians and accelerate the deployment of processes, tools and technologies to the State and local communities through showcasing, operational tests and evaluations, and public outreach campaigns.
In addition to the four priority topic areas above which address specific crash types, FHWA will advance initiatives which improve overall safety design and management processes through efforts including:
Other Federal programs with common outcomes: Within the U.S. DOT, FHWA works closely with NHTSA and FMCSA toward the common objectives of reducing highway crashes, fatalities, and injuries. To both support these objectives and carry out highway safety efforts throughout the Federal government, FHWA also coordinates with a number of non-U.S. DOT agencies. These agencies include the:
Program Evaluation: In FY 2001, FHWA will evaluate selected highway safety improvement programs using a combination of longitudinal and cross sectional methodologies and benefit/cost analysis.
| Strategic Goal: Continually improve the public's access to activities, goods, and services through preservation, improvement, and expansion of the highway transportation system and the enhancement of its operations, efficiency, and intermodal connections. |
| Strategic Objective 1: Preserve and enhance the infrastructure of Federal-aid highways and emphasis on the NHS. |
| Pavement Condition |
The National Highway System (NHS) consists of only 161,117 miles of rural and urban roads—just 4 percent of total highway miles—but carries 1 trillion or 43 percent of vehicle miles traveled (VMT). The system serves major population centers, international border crossings, intermodal transportation facilities and major travel destinations. The condition of this system can affect wear-and-tear on vehicles, fuel consumption, travel time, congestion and comfort, as well as public safety. Improving the pavement condition is also important to the long-term structural integrity and cost effectiveness of the transportation system.
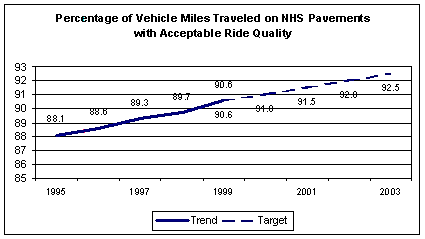
Performance Goal: In 2000 the performance goal of 93 percent of the NHS pavements with acceptable ride quality (IRI = 170 in/mi) was met. The performance goal for pavement condition has been revised to more closely address mobility. NHS condition is now being evaluated in light of the vehicle miles traveled on the pavement. In FY 2002, our goal is to improve the condition of the NHS, to increase the percent of vehicle miles traveled on pavements with acceptable ride quality (IRI = 170 in/mi) to 92 percent.
Performance Measure/Target: Percentage of vehicle miles traveled on NHS pavements with acceptable ride quality (IRI < or = 170 in/mi), in 2002 – 92%.
| Trend | Target | |
|---|---|---|
| 1995 | 88.1 | |
| 1996 | 88.6 | |
| 1997 | 89.3 | |
| 1998 | 89.7 | |
| 1999 | 90.6 | 90.6 |
| 2000 | 91 | |
| 2001 | 91.5 | |
| 2002 | 92 | |
| 2003 | 92.5 |
External Factors: Growth in the U.S. economy has translated into over 2% annual growth in VMT. While this level of growth did not occur in 2000, it is too soon to tell if this is a change in the trend. In addition, industry's demand for heavier and longer trucks has increased pavement deterioration. A significant proportion of the NHS is over 20 years old and nearly all of the system was designed to sustain loadings that have been exceeded for some time.
2000 Results: 1999 data for NHS pavement condition showed 93.0 percent of the pavements had acceptable ride quality. Since this met the goal set for FY 2008, a team was charged with assessing the performance goal. The revised goal is designed to more accurately reflect mobility by including the percent of vehicle miles traveled on NHS pavements with acceptable ride quality (IRI < or = 170 in/mi).
The focus of this measure of pavement performance is smoothness. Adopting more effective construction and maintenance methods and applying “best practices” in pavement management can improve pavement smoothness. In 1999, FHWA began a Pavement Smoothness Initiative to get the results of Research and Development and "best practices" in pavement construction and management to State DOTs and others involved in the construction and maintenance of highways. Pavement smoothness packages for both asphalt and Portland Cement Concrete pavements have been prepared. More than 3000 copies were distributed nationwide. These packages include videotapes by volunteer celebrity spokespersons Richard Petty, for asphalt pavements, and John Madden, for concrete pavements. Over 40 workshops were held to promote smoother pavement construction. Model specifications have been developed to assist State departments of transportation in improving pavement construction practices.
FHWA is also promoting pavement preservation nationwide. This initiative will result in improved pavement smoothness, extended pavement life, and reduced life cycle cost. Efforts are also underway to promote pavement preservation practices to extend pavement life and improve condition. Work is also underway with the States to improve pavement condition measurement practices and equipment. This effort will increase the reliability of the data on which decisions on for pavement preservation and rehabilitation are based.
FY 2001 Performance Plan Evaluation: Due to the significant increase in investment in pavement preservation and rehabilitation from the increased funding made available in TEA-21, and efforts to improve pavement condition, the ride quality of NHS pavements has improved faster than anticipated allowing us to reach 93% of the NHS with acceptable ride quality in 1999.
A revised goal has been established. To better recognize customer focus, the revisions address users in addition to pavement condition by incorporating vehicle miles traveled on NHS pavements into the goal. In addition to reducing the mileage of the NHS with unacceptable ride quality, the revised plan also increases good ride quality pavements (IRI < 95 in/mi).
Strategies and Initiatives to Achieve 2002 Goal: FHWA partners with State and other authorities to promote infrastructure development and improvement through direct funding, grants, and technical assistance and advances in construction, rehabilitation, maintenance, preservation, materials and management technology. FHWA technology deployment initiatives, in partnership with the States and industry, ensure advancements in pavement practices and high performance materials are adopted to improve the performance of NHS pavements. Initiatives to promote construction of smoother, longer lasting pavements and preservation that extends pavement performance will be continued. Innovations will be developed and delivered as they become available.
Other Federal Programs with Common Outcomes: None.
| Bridge Condition |
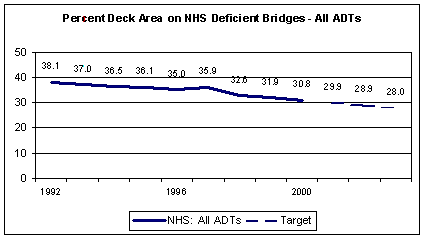
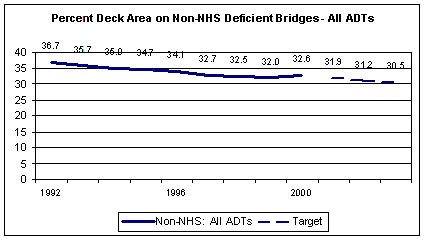
Deficient bridges impair the public's access to activities, goods and services. The National Highway System (NHS) includes approximately 114,000 bridges serving major population centers, international border crossings, intermodal transportation facilities and major travel destinations. Approximately 30.8 percent of the deck area on these bridges (for all average daily traffic (ADT)) is either structurally deficient or functionally obsolete (in terms of dimensions, load, or other characteristics). Of the approximately 472,000 non-NHS bridges identified in the National Bridge Inventory (NBI), 32.6 percent of the deck area (for all ADT) is considered to be deficient.
Performance Goal and Result: In FY 2002, improve the condition of NHS and non-NHS bridges taking into account deck area and ADT. (Improve NHS deficient bridges' deck area to 28.9 percent; and improve non-NHS bridges' deficient deck to 31.2 percent.)
| Please see specific targets for FY 2002 by specific ADT breakdowns under the section "Strategies and Initiatives to achieve 2002 Goal." |
Performance Measure/Target: Percentage of NHS Bridges' deck area classified as deficient for all ADT (structurally deficient or functionally obsolete)
Percentage of non-NHS Bridges' deck area classified as deficient for all ADT (structurally deficient or functionally obsolete)
| NHS: All ADTs | Target | # of NHS Def Bridges | |
|---|---|---|---|
| 1992 | 38.1 | 37,304 | |
| 1993 | 37 | 36,631 | |
| 1994 | 36.5 | 36,747 | |
| 1995 | 36.1 | 36,549 | |
| 1996 | 35 | 36,868 | |
| 1997 | 35.9 | 33,558 | |
| 1998 | 32.6 | 33,311 | |
| 1999 | 31.9 | 33,154 | |
| 2000 | 30.8 | 27,128 | |
| 2001 | 29.9 | ||
| 2002 | 28.9 | ||
| 2003 | 28 | ||
| 2004 | 27.1 | ||
| 2005 | 26.2 | ||
| 2006 | 25.3 | ||
| 2007 | 24.3 | ||
| 2008 | 23.4 | ||
| Non-NHS: All ADTs |
Target | # of non-NHS Def Bridges |
|
|---|---|---|---|
| 1992 | 36.7 | 178,518 | |
| 1993 | 35.7 | ||
| 1994 | 35 | ||
| 1995 | 34.7 | ||
| 1996 | 34.1 | ||
| 1997 | 32.7 | ||
| 1998 | 32.5 | ||
| 1999 | 32 | ||
| 2000 | 32.6 | ||
| 2001 | 31.9 | ||
| 2002 | 31.2 | ||
| 2003 | 30.5 | ||
| 2004 | 29.8 | ||
| 2005 | 29.2 | ||
| 2006 | 28.5 | ||
| 2007 | 27.8 | ||
| 2008 | 27.1 |
External Factors: Growth in the U.S. economy has translated into over 2% annual growth in vehicle miles traveled, increasing the stress on bridges. While this level of growth did not occur in 2000, it is too soon to tell if this is a change in the trend. In addition, increases in truck traffic and the aging of our infrastructure contribute to the deficiencies in our Nation's bridges.
2000 Results: According to our 2000 NBI data, the percentage of deficient NHS bridges was 21.5%, exceeding the FY 2000 target of 22.5%. This 1.5% decrease between 1999 and 2000 is primarily due to improved data collection for the NHS. Prior to 1995, NHS data was collected based upon FHWA's best estimate, by functional classification, of the number of bridges located on the NHS. In 1995, a data item was added to the NBI that tracked the NHS bridges. The new data item was fully populated by the States in the year 2000 NBI submittal. This resulted in a more accurate tracking of the NHS bridges. As a result of the improved accuracy of our data, the actual number of NHS bridges decreased significantly. Because it was apparent we would be accomplishing our original target early, FHWA began to determine a revised goal that more directly relates to mobility.
FY 2001 Performance Plan Evaluation: Based on program performance in FY 2000, the targets established for FY 2001 of improving the condition of the nation's bridges will need to be adjusted to reflect the improved data in the NBI. In addition the FHWA is reviewing this particular performance goal and measure to assure that we are on track and measuring the right indicator in regards to the nation's mobility.
Strategies and Initiatives to Achieve 2002 Goal: A primary strategy for FY 2002 will be to obtain buy-in from all the Division Offices and Resource Centers, customers, stakeholders and partners for this new performance goal and measure. This will be done through information provided from the Office of Bridge Technology to our Divisions/Resource Centers; briefings to AASHTO and our partners and simple explanations of the validity of the new measure relative to the way projects are planned. FHWA's division offices will need to become more familiar with their NBI data in regards to its implications for mobility. The Office of Bridge Technology and the Turner Fairbank Highway Research Center will be providing detailed analyses of the NBI data for each State. Strategies and initiatives will be devised to work with the States on improving the condition of bridges that most heavily impact the mobility of the American public. The following national targets have been set to improve the condition of NHS and non-NHS bridges taking into account ADT:
FHWA will continue to provide technical assistance and funding to States for bridge replacement and rehabilitation. In addition, all regulations and policies pertaining to the bridge programs will be reviewed and recommendations provided, where feasible, to increase flexibility in the use of bridge funds for system preservation and bridge management system initiatives. FHWA will work with States and other partners in both the public and private sector to improve management of bridge assets. FHWA will focus research on improving the technology of bridge construction, repair and maintenance. FHWA technology deployment initiatives will support the adoption of advancements in high performance materials and seismic retrofit techniques that improve the performance of bridges.
Other Federal Programs with Common Outcomes: None.
| User Satisfaction |
FHWA is committed to excellence in service to its customers and partners. It is important to understand highway users' perceptions of how well highways, as part of the Nation's intermodal transportation system, meet their needs.
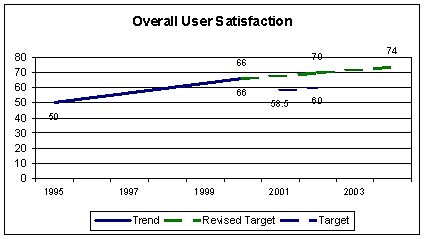
Performance Goal:In FY 2002, increase overall user satisfaction with the Nation's highway systems to 70%.
Performance Measure/Target: Percent user satisfaction with the Nation's highway systems.2000 Results:The level for Overall Highway User Satisfaction increased from 50% to 66%, according to the Bureau of Transportation Statistics Omnibus Survey. The top 3 stated priorities for improvement based on the 1995 and 2000 survey are shown in the chart below:
| Trend | Target | Revised Target | |
|---|---|---|---|
| 1995 | 50 | ||
| 1996 | |||
| 1997 | |||
| 1998 | |||
| 1999 | |||
| 2000 | 66 | 66 | |
| 2001 | 58.5 | ||
| 2002 | 60 | 70 | |
| 2003 | |||
| 2004 | 74 |
| Top Priorities for Improvement | 1995 Survey | 2000 Survey |
|---|---|---|
| Safety | 58% | 72% |
| Pavement Condition | 48% | 58% |
| Traffic Flow | 47% | 44% |
FY 2001 Performance Plan Evaluation: No changes are proposed at this time, with the exception of possibly using two identical questions on Overall Satisfaction in 2002 Survey (one question to be asked at the beginning of each interview and the follow-up question to be asked at the end of the interview).
Strategies and Initiatives to Achieve 2002 Goal:
| Strategic Objective 2: Improve the operation of the highway systems and intermodal linkages to increase transportation access for all people and commodities. |
| Congestion and Delay |
Congestion is a problem. Over the last two decades, the amount of travel has increased significantly. Growth in roadway capacity however has almost flat-lined at a meager 0.3% a year in the last decade. The costs of congestion are adding up. In 1997, the individual cost of congestion in metropolitan areas exceeded $900 per driver, resulting in over $72 billion in lost wages and wasted fuel. In the near-term, the FHWA will focus on improved, active and real-time operations of the existing transportation system (including accommodations for non-motorized users), which can result in short-term reduction in travel time and delay of between 10-30% depending on a variety of local conditions.
Performance Goal: In FY 2002, slow the projected growth of congested travel from 33.9% to 33.7%, slow the projected growth of travel time from 27.6% to 27.2% and slow the projected growth of traveler delay from 34.5 hours to 34.0 hours.
Performance Measure/Target:
The projected growth of congested travel.
Understanding the table:
The percentage of congested travel measures undesirable traffic congestion. For instance, the 1996 figure tells us 32% of daily travel occurred under congested conditions. Our goal is to slow the growth of congested travel by 0.2% each year. Based on historical trends coupled with a preliminary analysis of 2000 data, we project the rate of increase will be 0.5% per year for 2000-2002. The 2002 target is based upon meeting the 2001 target.
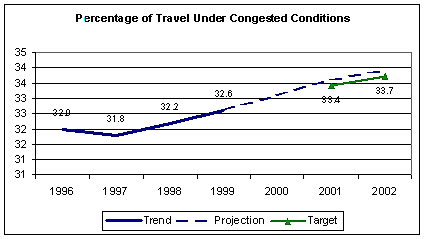
| Trend | Projection | Target | |
|---|---|---|---|
| 1996 | 32 | ||
| 1997 | 31.8 | ||
| 1998 | 32.2 | ||
| 1999 | 32.6 | 32.6 | |
| 2000 | 33.1 | ||
| 2001 | 33.6 | 33.4 | |
| 2002 | 33.9 | 33.7 | |
Performance Measure/Target
The projected growth of travel time.
Understanding the table:
The Travel Time Measure addresses the following question – "How much longer
does it take me to travel during congested conditions?" The measure focuses
on the additional travel time necessary for an individual to make a trip during
the peak period(s) because of congestion. For instance, the 1996 figure of 23%
indicates the average peak period trip took 23% longer than the same trip in
uncongested conditions. Put simply, a 30-minute trip traveling at the posted
speed limit(s) in uncongested conditions becomes 36.9 minutes due to congestion.
Our goal is to slow the growth of travel time by 0.4% each year. Based on historical
trends coupled with a preliminary analysis of 2000 data, we project the rate
of increase will be 1% per year for 2000-2002. The 2002 target is based upon
meeting the 2001 target.
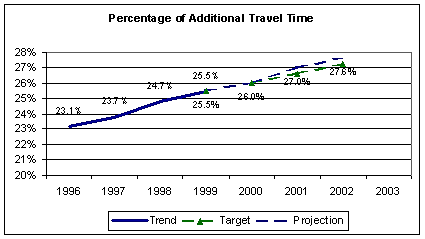
| Trend | Target | Projection | |
|---|---|---|---|
| 1996 | 23.1 | ||
| 1997 | 23.7 | ||
| 1998 | 24.7 | ||
| 1999 | 25.4 | 25.5 | 25.5 |
| 2000 | 26 | 26 | |
| 2001 | 26.6 | 27 | |
| 2002 | 27.2 | 27.6 | |
| 2003 | |||
Performance Measure/Target
The projected growth of traveler delay
Understanding the table:
The graph identifies the average number of hours drivers are stuck in traffic
per year. The hours of delay reflect congestion, work zones, incidents and accidents.
From 1996, delay increased approximately 1-hour per year. Our goal is to slow
the growth of delay time by 30-minutes each year. Based on historical trends
coupled with a preliminary analysis of 2000 data, we project the rate of increase
will be 1 hour per year for 2000-2002. The 2002 target is based upon meeting
the 2001 target.
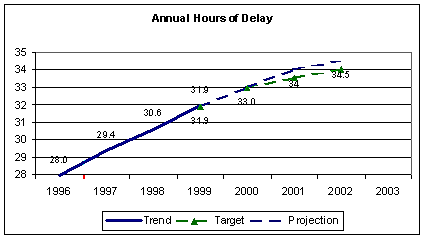
| Trend | Target | Projection | |
|---|---|---|---|
| 1996 | 28 | ||
| 1997 | 29 | ||
| 1998 | 30.6 | ||
| 1999 | 31.9 | 31.9 | 31.9 |
| 2000 | 33 | 33 | |
| 2001 | 33.5 | 34 | |
| 2002 | 34 | 34.5 | |
| 2003 |
2000 Results: In the FY 2000 Performance Plan, we used hours of delay per 1,000 vehicle miles traveled (VMT) to measure this goal. This metric attempted to provide a system-wide measure of congestion. However, it represented only one dimension of congestion – delay -- and did not effectively reflect the actual performance of the highway system in places where congestion regularly happens, i.e., the measure showed delay decreasing when in fact congestion was worsening. Moreover, the measure was difficult to interpret by the general public. Based on discussions with our partners and customers, we replaced this indicator with three new measures: Congested Travel, Travel Time, and Traveler Delay. Together, these new indicators will reflect changing travel conditions more comprehensively by focusing on three different aspects of inefficient road performance in a broad collection of urban areas across the nation where congestion regularly occurs. The data supporting the three new measures stem from the Highway Performance Monitoring System (HPMS). The availability of the data is approximately 9 months from the base year, e.g., 2001 actual numbers will not be available from HPMS until Sep/Oct 2002.
In addition to the above efforts, the Federal Highway Administration (FHWA) conducted surveys asking the American public about travel and transportation on the nation's roads. The findings offered many valuable insights across a broad range of topics, e.g., congestion. The results of the survey are located at: https://www.fhwa.dot.gov/reports/movingahead.htm.
External Factors: A variety of State, local, county, and special district stakeholders control the decisions to deploy ITS—a key strategy for supporting the mobility goal. On January 8, 2001, a Federal Highway Administration regulation and a Federal Transit Administration policy were published in the Federal Register. Implementing the regulation and policy will help foster integration of these independent deployments by requiring development of regional ITS architectures. This will help minimize stovepipe deployments that would otherwise compromise the potential benefits of integrated deployments.
FY 2001 Performance Plan Evaluation: Despite the long-term trend of increasing vehicle miles traveled (the 2000 slowdown notwithstanding), we project the intervention of numerous operational programs and strategies will help slow the growth of travel time and delay for our customers. We will monitor our progress through the use of the Highway Performance Monitoring System and Texas Transportation Institute's reporting mechanisms on mobility.
Strategies and Initiatives to Achieve 2002 Goal: Our Strategies and Initiatives work together to support all of the goals and measures under the Strategic Objective "Improve the operation and efficiency of existing surface transportation system." For a description, see "Strategies and Initiatives" under the "User Satisfaction" measure.
Other Federal Programs with Common Outcomes: None.
| System Reliability |
Although congestion may never be eliminated by operations in the long term, real-time, 24/7 management of the system, with complete information about system conditions given to citizens, can substantially improve reliability and users' ability to plan for “just-in-time” delivery/arrival of people and goods. This is critical when we consider the United States' role in the global economy. Therefore, we will continue to monitor the performance measures listed below while we concurrently develop the ability to collect data for and measure system reliability. A reliability measure depends on continuous (minute by minute) measurement of system speeds which is only possible with automated instrumentation. As the ITS network is put in place, reliability will become a key barometer of this strategic goal.
Performance Goal: Increase system reliability
The FHWA is working with the Texas Transportation Institute in developing reliability measures. In 2001, ten cities were identified with sufficient instrumentation to permit the development of candidate reliability measure(s). We are assessing the following measures:
Percent Variation and Buffer Index: These measures address on-time arrival and include different travel time factors to derive acceptable reliability thresholds. As an example - "To be on-time 95% of the time, I need to allow enough time so that I am not late to work more than one day a month. I may be 5-10 minutes early on some days, but the number of days I'm late is limited to 1 or less."
Exception Index: This index seeks to measure the length of delay of only the worst trips. Translation – "On really bad days, my travel time will be X minutes longer than usual."
We are examining the early results from the initial data gathering effort from the 10 cities. The level of data quality and completeness varies by city.
In 2002, we will add 15-20 additional cities. Consequently, 25-30 of our largest cities will be collecting ITS-based, real-time data.By the end of 2002, FHWA will possess 2 full years of data from the initial 10 cities and 1 year of data from the additional 15-20. During this period, we will have had the opportunity to fully analyze all the data and begin developing specific goals and targets to track within subsequent performance plans.
Performance Measure/Target: System Reliability
|
Steps to Indentifying New Reliability Measures:
|
Strategies and Initiatives to Achieve 2002 Goal: Our Strategies and Initiatives work together to support all of the goals and measures under the Strategic Objective "Improve the operation and efficiency of existing surface transportation system." For a description, see "Strategies and Initiatives" under the "User Satisfaction" measure.
Other Federal Programs with Common Outcomes: None.
| User Satisfaction (#2) |
The greatest benefit of improved operations is to the user, in the form of reliable, complete, and timely information. Users want to know their options and feel in control of their mobility, instead of at the mercy of the system. In 2002, we will further analyze the results from FHWA's 2001 traveler surveys to develop a composite measure and develop strategies that are consistent and responsive to those we serve. In addition, we will execute a new survey in 2002 and analyze and present the results in 2003.
Performance Goal: Increase user satisfaction with the operation of the existing system.
Performance Measure/Target: User satisfaction with the operation of the existing system.
|
User Satisfication with the Operation of the System
|
External Factors: None.
2000 Results: The Federal Highway Administration conducted a comprehensive Traveler Perception survey in 2000 and collected the following baseline data in 2001. The following information lists some of the key measures regarding highway congestion:
Strategies And Initiatives To Achieve 2002 Goals: We will pursue the following 4 major strategies and initiatives to achieve our Operations-related performance goals:
Other Federal Programs With Common Outcomes: None.
| Strategic Goal: Continually improve the economic efficiency of the Nation's transportation system to enhance America's position in the global economy. |
| Strategic Objective 1: Improve the economic efficiency of goods movement on the surface transportation system. |
| Congestion and Delay |
The time that it takes goods to move in this country defines the limitations of the breadth and depth of this nation's economy. As sites of manufacturing become globally mobile, as national economies merge into a world market and as the science of logistics moves from push to pull supply chain management, we will examine the adequacy of the physical system as well as its current operations to meet these changing demands. We will search for infrastructure, technology, and operations improvements that both meet the new demands of logistics and maintain the nation's leadership in the global economy.
These performance parameters have tremendous cost impacts on an industry that has moved almost entirely to just-in-time delivery windows - sometimes as small as 15 minutes.
Performance Goal: In FY 2002, slow the projected growth of congested travel from 33.9% to 33.7%, slow the projected growth of travel time from 27.6% to 27.2%, and slow the projected growth of traveler delay from 34.5 hours to 34.0 hours.
Performance Measure/Target: Trend charts for this performance measure are on page M-8. While the Performance Goal of reducing congestion and delay is carried in both the Mobility and Productivity chapters, the strategies and initiatives to achieve the goal use different programs and offices and serve different constituencies. Please see the discussion of Productivity strategies.
| Freight Costs |
Although freight costs are affected by numerous variables, we nevertheless believe that they provide an overall barometer of the effect of key regulations and legislation. In 2001, we have created a collection and reporting program which assesses data from a reliable sample of motor carriers to determine significant changes in costs per mile of operation. During 1980 to 1997, cost per mile decreased 27% industry-wide. The reduction was attributable to Federal and State deregulation of trucking, uniformity programs for vehicle registration and tax reporting, the pricing flexibility introduced by deregulation, and improvements in vehicle technologies and fuel economy. (Note: Not an exhaustive list.) Conversely, the rise in cost-per-mile after 1997 reflects increases in driver wages (responding in part to national driver shortage), vehicle maintenance, and fuel costs.
Using baseline data, we will track annualized cost-per-mile averages, include performance goal targets, and identify public and private influences on those changes in the FHWA 2002 Performance Plan Revision in September 2001.
Performance Goal: Reduce the cost of highway freight per mile.
Performance Measure/Target: The Cost of Highway Freight per Ton-Mile
|
Note: Operations' Productivity performance goals work together to address productivity challenges. As such, the External Factors, 2000 Results, FY 2001 Performance Plan Evaluation, and Strategies and Initiatives to Achieve 2002 Goal sections support all of the performance goals and are listed after the "Freight Corridors" performance goal.
Other Federal Programs with Common Outcomes: None.
| Border Crossings |
Our highway gateways to Canada and Mexico can represent many costly hours of delay in the flow of trade as well as several-mile continuous traffic back-ups that are a significant irritant to border crossing communities. In 2000, we gathered baseline data at 3 border crossings (Laredo, TX; Otay Mesa, CA, and Calais, ME). This has permitted testing of initial monitoring design and benchmarking of data. Currently, we are assessing a measure called "hours of delay per commercial vehicle trip." In 2001, we will expand collection to nine crossings, with repeat visits to the initial sites. In 2002, and each subsequent year, we plan to both broaden the site visits and, as feasible, introduce automated collection procedures. Ultimately, we hope to collect data from the approximately 15 crossings that handle the gross majority of cross-border freight shipments. These annual collections will help us identify where resources are needed to facilitate the efficient and effective movement of freight across our national boundaries.
Performance Goal: Reduce the hours of delay per 1000 commercial vehicles processed at NHS border crossings.
Performance Measure/Target: Hours of delay per 1000 commercial vehicles processed at NHS border crossings.
Steps to Identify
Hours of Delay per 1000 Commercial Vehicles Processed at Borders
|
Note: Operations' Productivity performance goals work together to address productivity challenges. As such, the External Factors, 2000 Results, FY 2001 Performance Plan Evaluation, and Strategies and Initiatives to Achieve 2002 Goal sections support all of the performance goals and are listed after the "Freight Corridors" performance goal.
| Freight Corridors |
The FHWA's Freight Analysis Framework expects that by the year 2020, freight volumes will double compared to current levels. While the majority of the U.S. freight shipments are primarily domestic, international traffic is expected to continue growing at a much faster rate than domestic traffic. We are pursuing an evaluation of "travel time in freight significant corridors." Such a measure would permit an evaluation of resource needs and investments in important freight corridors.
Performance Goal: Reduce travel time on key freight corridors
Performance Measure and Results: Travel time on key freight corridors
Steps to Identify
Travel Time Measures on Key Freight Corridors
|
External Factors: None.
2000 Results: Looking into the economic assessment of freight transportation costs (Performance Goal 2), we determined that "cost-per-mile" data collection and reporting can be quite revealing of larger trends in the motor carrier industry. As described earlier, we are analyzing the data and will derive cost per mile national averages, develop yearly targets, and identify causal factors in subsequent versions of the FHWA Performance Plan.
In the case of our international border crossing reviews (Performance Goal 3), the information received confirms that on-site reviews can provide substantive information about the variations in travel time at the individual border sites. The process also can tell us something, but not everything, about why these variations occur, with some indication of possible corrective actions (e.g., additional inspection booths) that might enhance travel times. We have learned that we need to do more to assure that all jurisdictions and agencies involved, on both sides of the border, are clearly aware of what is being undertaken during these reviews, and know the details of the collection process. In addition, we found out that on-site observers need to have a general sense of peak traffic periods and conditions before commencing the actual review effort, in order to optimize collection procedures.
FY 2001 Performance Plan Evaluation: We will monitor and track the status of all the major initiatives that are required to develop comprehensive performance measures. In addition, we will be initiating a customer satisfaction survey that will focus on a number of freight related issues, e.g., intermodal connectors. We are initiating numerous other outreach efforts to solicit stakeholder feedback on productivity-related performance goals and strategies.
Strategies and Initiatives to Achieve 2002 Goal: To carry out the strategic objective of improving the productivity of freight movement on the surface transportation system, we will pursue the following strategies:
Strategy 1: Develop the analytical framework and conduct analyses necessary for identifying high payoff infrastructure investments, or legislative and policy strategies.
Because much of the freight industry is private and fragmented among numerous shippers, carriers, forwarders, brokers, etc., it has been difficult to get a holistic picture of trade flows and projected trade flows against total system capacity. Over time, we will attempt to develop that capability as well as an analytic framework to evaluate the infrastructure implication of alternative future trade scenarios, policy alternatives, and major investments. Initiatives in 2002 include:
Strategy 2: Develop institutional and policy underpinning for public/private, multi-state and/or multi-institution freight planning and investment, and legislative/programmatic initiatives to enhance North American freight productivity.
The investment horizons and the geography of benefits of freight and intermodal connection investment have been ill-fitted to existing planning and investing institutions. We will nurture those coalitions that are emerging, evaluate their institutional underpinnings, and examine policy options for institutionalizing processes better suited for freight planning and investment. This examination of institutional issues, funding options, and infrastructure requirements will be translated into legislative and program options for enhancing North American freight productivity. Specific initiatives in support of this broad framework include:
Strategy 3: Directly invest in ITS and infrastructure enhancements to freight productivity.
Instrumentation of the transportation infrastructure that directly meets the needs of freight mobility is key to improving freight productivity. Investments are being made through the TEA-21 1118/1119 corridor and borders grant program, ITS and ITS Deployment programs, and through FHWA's support of the U.S. Customs ITDS system. Initiatives include:
Strategy 4: Research and demonstrate technology applications that will improve freight productivity.
There exist many information gaps within industry's operations. The information disconnects compromise the efficiency goals of supply-chain management. Industry segments have developed technology to fit their own advantage, but no cross-cutting technology innovations would be instituted without government facilitation. Government can play a role in demonstrating and catalyzing the use of technology that will allow sharing of appropriate information across agency, corporate, and geographic boundaries that will allow infrastructure and equipment to be used more productively. The 2002 initiatives include:
Strategy 5: Size and Weight Regulation and Regulatory Response
Productivity is balanced against the necessary preservation of the infrastructure and maintenance of safety. In that vein, we carry out the necessary oversight of size and weight regulatory compliance, as well as evaluate the productivity impacts of various safety and other regulations. In 2002, we will:
| Strategic Objective 2: Improve the return on investment of the highway system. |
| Cost Effectiveness |
Engineering/economic analysis (EEA) tools, including life-cycle cost analysis (LCCA) and benefit-cost analysis (BCA), can be used to improve the efficiency of highway investment decisions, since they provide guidance for decisionmakers on the economic benefits and costs for alternative highway investment options. Such information is valuable because it reveals investments where the economic returns are greatest, and allows decisionmakers to achieve a performance goal at the lowest total cost. This maximizes the efficiency of the taxpayers' highway investment dollars and saves motorists money as a result of less vehicle wear and tear and reduced congestion-related costs. Although a considerable number of States currently use such tools as LCCA and BCA in some capacity, there is much diversity in application, and most States do not consider the full range of costs and benefits when conducting these analyses. For instance, only one-quarter of the States which use LCCA include user costs, even though user costs (e.g., travel delay, vehicle operating costs, and accidents) can be a significant portion of the total impacts associated with alternative highway project decisions.
Performance Goal: Improve the efficiency of highway infrastructure investments by developing and promoting the use of EEA tools for decisionmaking.
Performance Measures: A survey will be conducted to determine the current state-of-practice with respect to State application of EEA tools. The resulting information will be used to finalize performance measures of roughly the following form:
External Factors: Reasons for the lack of comprehensive use of EEA investment tools such as LCCA and BCA by States include lack of awareness as to the benefits of such tools, limited research budgets, a lack of in-house expertise, and an absence of necessary data and tools.
2000 Results: In FY 2000, FHWA began work to establish a Pilot Program to test the use of Highway Economic Requirements System (HERS) at the State level. In addition, work was initiated to develop an LCCA probabilistic teaching model.
FY 2001 Performance Plan Evaluation: FHWA is gathering information as to what types of EEA tools States would find useful in the evaluation of alternative program structures. Specifically, FHWA started a Pilot Program to test the State use of HERS with an introductory workshop in New Orleans. Seventeen participating States will report to FHWA as to the usefulness of the HERS model. They will also provide input as to their requirements for incorporating EEA into their program development process. In addition, FHWA work at the project level to advance the application of best-practice probabilistic LCCA by States in designing projects will result in a teaching model and companion course. Initial work is focused in pavement design. Outreach efforts for both HERS and LCCA will result in the production and release of executive-level primers.
Strategies and Initiatives to Achieve 2002 Goal:
Through December 2001, FHWA Division Administrators (DAs) will receive executive-level training in EEA tools and instruction on how to benchmark their State's current state-of-the-practice with respect to applying EEA tools in their decisionmaking processes. This exercise will not only allow us to benchmark the use of these tools but will also encourage DAs to partner with headquarters in advancing these tools. FHWA Resource Centers are already involved in this goal area, most notably because they have the responsibility for providing LCCA courses.
Priority initiatives include increasing the number of States:
attending the new LCCA course,
completing the HERS pilot program,
attending a "short" course on the potential of economic analysis, and
using PONTIS to support decisionmaking.
These initiatives will be refined as information from the DA benchmarking effort becomes available.
| Strategic Goal: Protect and Enhance the natural environment and communities affected by highway transportation. |
| Strategic Objective 1: Enhance community and social benefits of highway transportation. |
| Community and Social Benefits |
The Federal Highway Administration is committed to protecting and enhancing the natural environment and communities affected by highway transportation. Our objective is to enhance community and social benefits of highway transport by ensuring that transportation plans and operations address the community concerns and social impacts of transportation facilities by:
FHWA has made environmental justice part of its mission. Title VI of the 1964 Civil Rights Act prohibits discrimination on the basis of race, color, and national origin. FHWA will proactively ensure that discrimination does not occur by identifying and addressing the effects of its programs, policies, and activities on minority populations and low-income populations. FHWA's environmental justice initiatives fit within a broader objective of enhancing communities and social benefits of transportation for all populations. FHWA works with State and local governments to make sure the plans and projects fit harmoniously within all kinds of communities without sacrificing safety or mobility.
Performance Goal:In FY 2002, FHWA will increase public satisfaction with highway systems and highway projects as a beneficial part of their community by promoting good planning practices, inclusive public involvement, careful consideration of environmental impacts, and context-sensitive project designs. (Note: We are examining the results of the 2000 survey to establish a baseline and set targets for future years.)
Performance Measure/Target:Level of Community Satisfaction with the Nation's highway system and projects toward meeting community quality of life goals (using a National FHWA Omnibus survey: see also Mobility Customer Satisfaction Goals).
|
Community Satisfaction
|
Performance Measure/Target: Environmental Protection Agency Rating of FHWA Environmental Impact Statements.
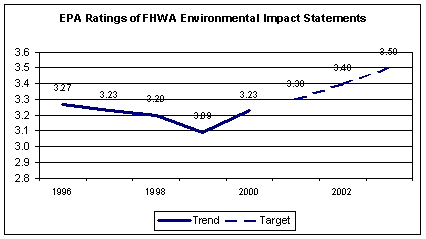
| Trend | Target | |
|---|---|---|
| 1996 | 3.27 | |
| 1997 | 3.23 | |
| 1998 | 3.2 | |
| 1999 | 3.09 | |
| 2000 | 3.23 | |
| 2001 | 3.3 | |
| 2002 | 3.4 | |
| 2003 | 3.5 |
External Factors: The American public has multiple and disparate expectations for transportation and quality of life.
Requests to States for funding through Federal-aid highway programs which benefit the human and natural environment, such as the Congestion Mitigation and Air Quality Improvement Program, Transportation Enhancement activities, the Recreational Trails Program, the National Scenic Byways Program, and the Transportation and Community and System Preservation Pilot Program, have consistently exceeded the available funds. This response indicates a pressing need in communities to leverage resources to make their communities more livable.
2000 Results: The first National FHWA Omnibus Survey (a June 2000 national telephone survey) found that 56 percent of the public said that they were "satisfied" or "very satisfied" in response to the question: "How satisfied are you with the transportation system and the transportation options in your community?" FHWA will use this as a base measure. FHWA plans a follow up survey for 2002.
FHWA also led or actively participated in:
Environmental Programs
Community Programs
Real Estate Programs
Planning Programs
FHWA funding programs provided Tribal governments, the States, localities, and private organizations with funds to enhance communities, reduce traffic congestion, preserve historic transportation facilities, provide pedestrian accessibility and bicycle transportation, develop and maintain recreational trails, and enhance scenic byways.
FY 2001 Performance Plan Evaluation:Level of community satisfaction with the Nation's highway system and projects toward meeting community quality of life goals (using a National FHWA Omnibus survey; see also Mobility goal).
The first National FHWA Omnibus Survey (a June 2000 national telephone survey) found that 56 percent of the public said that they were "satisfied" or "very satisfied" in response to the question: "How satisfied are you with the transportation system and the transportation options in your community?" FHWA will use this as a base measure. A follow up survey is planned for 2002.
FHWA changed its Environmental Impact Statement (EIS) rating measure to make it more understandable. FHWA will use the measure "Ratings of Environmental Impact Statements" as an indicator of public satisfaction with highway projects. This measure will be an average "grade point" of the Environmental Protection Agency (EPA) ratings given to FHWA EIS documents. The points assigned are:
| Lack of Objection rating (LO) | = | 4 points |
| Environmental Concerns rating (EC) | = | 3 points |
| Environmental Objections rating (EO) | = | 2 points |
|
Environmentally Unsatisfactory rating (EU)
|
= | 0 points |
Strategies and Initiatives to Achieve 2002 Goal: Enhancing Communities Through Highway Transportation—The FHWA will foster community and regional level transportation solutions through enhancements in urban and rural community planning, operations, and project development. FHWA will partner with Federal land management agencies, and Tribal, State, regional, and local government planners and project development specialists. We will develop and share tools to effectively incorporate livability; environmental justice; the preservation of scenic, historic, natural, and community resources; just and fair property acquisition; bicycle and pedestrian access; and traffic safety into transportation plans and projects. We will continue the development and deployment of TRANSIMS, a sophisticated traffic analysis and forecasting tool which will address traffic congestion, environmental justice, and air quality concerns. FHWA will continue to evaluate the accuracy of the highway traffic noise prediction model, FHWA TNM, and make adjustments if necessary. To accelerate and improve decisionmaking, FHWA will promote processes which effectively integrate Federal, Tribal, State, and local transportation, land use, and environmental decision making in an effective, streamlined, and timely manner.
FHWA is working with FTA, EPA, and other Federal environmental regulatory agencies, the States, and other partners to streamline transportation decisionmaking, enabling States and Metropolitan Planning Organizations (MPOs) to advance environmentally sound projects more expeditiously. These process improvements will provide for closer linkages between project development under NEPA and planning under Titles 23 and 49. The process improvements should result in higher public satisfaction ratings as measured by future surveys and in higher EPA ratings for Environmental Impact Statements.
Specific funding programs, with FY 2002 authorized amounts, include:
Other Federal programs with common outcomes:
| Strategic Objective 2: Improve the quality of the natural environment by reducing highway-related pollution and by protecting and enhancing ecosystems. |
| Air Quality |
The quality of our air is a public good, and the cost of pollution is not captured in the marketplace. The National Ambient Air Quality Standards target six major pollutants as among the most serious airborne threats to human health. Transportation is a major contributor to some of the pollutants, particularly ozone, carbon monoxide, and particulate matter, and about two-thirds of transportation-related emissions come from on-road motor vehicles. For this reason, FHWA is working to mitigate the impact of these emissions.
Performance Goal:In FY 2002, FHWA will continue to work toward the reduction of on-road mobile source emissions to reach the target of 61.1 million tons. In addition, FHWA will increase the percentage of nonattainment and maintenance areas meeting their mobile-source emissions budget goals. (See table for targets.)
Performance Measure/Target: On-road mobile source emissions in short tons.
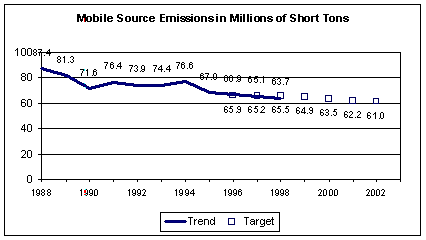
| Trend | Target | |
|---|---|---|
| 1988 | 87.4 | |
| 1989 | 81.3 | |
| 1990 | 71.6 | |
| 1991 | 76.4 | |
| 1992 | 73.9 | |
| 1993 | 74.4 | |
| 1994 | 76.6 | |
| 1995 | 67.9 | |
| 1996 | 66.9 | 65.9 |
| 1997 | 65.1 | 65.2 |
| 1998 | 63.7 | 65.5 |
| 1999 | 64.9 | |
| 2000 | 63.5 | |
| 2001 | 62.2 | |
| 2002 | 61 | |
| 2003 |
Performance Measure/Target: Percent of nonattainment and maintenance areas meeting their mobile source emissions budget goals.
| Ozone | Ozone Target |
PM-10 | PM-10 Target |
Carbon Monoxide |
CO Target | |
|---|---|---|---|---|---|---|
| 1996 | 96.7 | 68.2 | 92.6 | |||
| 1997 | 98 | 98 | 86.4 | 86 | 96.2 | 96 |
| 1998 | 90.3 | 98 | 96 | 86 | 96.4 | 96 |
| 1999 | 93 | 98 | 100 | 86 | 96.2 | 96 |
| 2000 | 98 | 98 | 100 | 86 | 96 | 96 |
| 2001 | 98 | 86 | 96 | |||
| 2002 | 98 | 86 | 96 | |||
| 2003 | 98 | 86 | 96 |
External Factors: Growth in the U.S. economy has translated into over 2 percent annual growth in vehicle miles traveled (VMT). While this level of growth did not occur in 2000, it is too soon to tell if this is a change in the trend. However, advancements in fuel and vehicle technologies, as well as the implementation of other emission-efficient transportation strategies, helped continue the reduction in mobile source emissions from 87.4 million tons in 1988 to 63.7 million tons in 1998.
2000 Results: During FY 2000, a high percentage of the nonattainment and maintenance areas have shown positive results in meeting their emissions goals. Ninety eight percent of ozone nonattainment and maintenance areas met their mobile emissions budgets, as did 96 percent of areas for carbon monoxide and 100 percent of areas for particulate matter (PM-10). Although national emissions estimates for 1999 and 2000 are not available from EPA, EPA estimates published in March, 2000 show that on-road mobile source emissions were reduced from 1996 levels by 2.6 percent in 1997 and by an additional 2.11 percent in 1998. This level of mobile source emissions actually exceeded our revised 1999 goal of 64.9 million tons.
Through the Congestion Mitigation and Air Quality Improvement Program (CMAQ), FHWA has provided funding for State and local governments to encourage the use of alternative-fuel vehicles. For example, between 1992 and 1998, the portion of CMAQ funds used to support alternative-fuel vehicle projects ranged from 3 to 11 percent. In addition to alternative-fuel projects, CMAQ has provided funding to State and local governments for many other transportation projects that provide air quality benefits since its inception in 1991. While individual projects yield small benefits, taken together CMAQ-funded projects have helped nonattainment areas meet their mobile source emission budgets.
A multi-year Public Information Initiative on Transportation and Air Quality, jointly funded by the Department of Transportation (the Federal Highway and Transit Administrations) and EPA, was launched in 1997 to help State and local governments meet their clean air goals under TEA-21 and the Clean Air Act. In 1999, the initiative was expanded to 14 additional communities and came to full fruition in 2000. Areas received Federal support in the form of research, advertising and resource materials, an orientation workshop, and limited funding. Evaluation of these demonstrations is underway. The initiative has generated requests for program materials from 60 communities nationwide interested in local customization and distribution.
FHWA also assisted in the formation of the Alliance for Clean Air and Transportation, a national alliance of more than 20 public and private organizations to support an education program to reduce traffic congestion and improve air quality.
FY 2001 Performance Plan Evaluation: Barring unforeseen shifts in external factors, mobile source emissions for 2000 should meet or exceed the goal. This outcome has shown a consistently positive trend, and TEA-21 has provided increased funding for several programs that positively influence air quality, especially in the CMAQ program.
Strategies and Initiatives to Achieve 2002 Goal: FHWA aims to reduce mobile source emissions by encouraging the use of less polluting transportation; designing and implementing infrastructure that reduces congestion and emissions; researching and modeling the emissions impacts of investment choices; and supporting the development of fuel- and emission-efficient vehicles. Through research, new technologies, and analytical models, FWHA will promote the design, construction, maintenance, and use of highways that are compatible with the national environmental goals. In partnership with our stakeholders, we will support the development of environmental analytical models to assist decisionmakers. FHWA will provide resources, guidance, and technical assistance for States and local agencies to ensure compliance with the National Ambient Air Quality Standards, especially reducing transportation-related emissions.
Other Federal Programs with Common Outcomes: FHWA efforts support the government-wide goals for National Ambient Air Quality Standards. FHWA works closely with FTA and EPA to achieve the national clean air goal by reducing mobile source emissions. FHWA, FTA and EPA work cooperatively to implement a number of initiatives including the Transportation and Air Quality public education initiative, the transportation conformity regulation, and the CMAQ. DOT and EPA have also jointly funded a number of research efforts that target the reduction of mobile source emissions.
| Wetlands Replacement |
Wetlands are an important natural resource. They provide natural filtration of pollutants, and they store and slow down the release of floodwaters, thereby reducing damage to downstream farms and communities. Wetlands also provide an essential habitat for biodiversity. But many of the Nation's wetlands have been lost to development over the years, before their value was fully recognized. Highways and transportation facilities (siting, construction, and operation) can be a significant factor affecting these ecosystems. The 1993 Federal policy on wetland protection called for no net loss in wetlands from Federally funded projects. The FHWA Strategic Plan then set a higher goal to replace the total area of wetlands impacted by a ratio of 1.5:1. This higher goal was included in the Federal Government's 1998 Clean Water Action Plan.
Performance Goal: In FY 2002, on a program-wide basis, replace at least an average of 1.5 acres of wetlands for every 1 acre directly affected by Federal-aid highway projects where impacts are unavoidable.
Performance Measure and Results: Ratio of wetland replacement resulting from Federal-aid highway projects.
| Year | Acres Replaced |
Acres Affected |
Ratio | Target |
|---|---|---|---|---|
| 1996 | 3,554 | 1,568 | 2.3:1 | 1.5:1 |
| 1997 | 4,484 | 1,699 | 2.6:1 | 1.5:1 |
| 1998 | 2,557 | 1,167 | 2.2:1 | 1.5:1 |
| 1999 | 5,409 | 2,354 | 2.3:1 | 1.5:1 |
| 2000 | 7,671 | 2,041 | 3.8:1 | 1.5:1 |
| 2001 | 1.5:1 | |||
| 2002 | 1.5:1 | |||
| 2003 | 1.5:1 |
External Factors: Wetland impacts are sometimes unavoidable, particularly in construction of bridge crossings. In addition, projects on existing alignments can cause wetlands degradation that is impractical to avoid. In areas where the concentration of wetlands is high (southern bottomlands, Midwestern prairie potholes, and eastern pine flatwoods), transportation projects often must cross wetlands to provide accessibility to the area.
2000 Results: Federal-aid Highway projects avoid impacting wetlands wherever possible. Where wetlands impact was unavoidable, projects achieved an average replacement ratio of 3.8 to 1 for every acre affected in FY 2000. This exceeded DOT's performance standard of 1.5 to 1. Estimates of total wetland loss indicate that, between 1982 and 1992, approximately 160,000 acres of wetlands per year were being converted to other land cover types by all sources of impacts. During that same period, only about 75,000 acres of wetlands were being restored or created each year—a deficit of about 85,000 acres per year. After 1992, an additional 68,000 acres per year have been restored or established as the result of the Wetlands Reserve and other new wetland conservation programs. FHWA programs contributed an average of 4,735 acres to this annual total between 1996 and 2000. The actual wetland replacement acreage for highways represents about 3% of the estimated total nationwide wetland replacement (most of which comes from restoration of agricultural lands). The acreage suggests that the project eligibility and funding provisions for wetland mitigation in TEA-21 have been effective in enhancing the natural environment. Those provisions are important to maintaining this trend into the future and should be effective in accomplishing the Nation's environmental goals under the Clean Water Action Plan and the National Wetlands Plan.
FY 2001 Performance Plan Evaluation: The last five years of data show that FHWA has exceeded its goal every year. No change is proposed to the performance standard for a 1.5:1 wetlands recovery ratio. This target is consistent with the long-term goal in the Clean Water Action Plan, Key Action #44, committing the FHWA to achieving a net wetland increase of 50% in ten years.
Strategies and Initiatives to Achieve 2002 Goal: FHWA promotes the design, construction, maintenance, and use of transportation projects that are compatible with national environmental objectives and that conform with the Clean Water Act. It does this primarily through research, new technologies, analytical models, management training, and development of technical transfer documents.
Other Federal Programs with Common Outcomes: The FHWA will continue to coordinate wetlands programs and research initiatives with the EPA, the Department of the Interior, the Department of Commerce, the Department of Agriculture, and the Army Corps of Engineers. This coordination is aimed at improving wetlands policies, and implementing the Clean Water Action Plan by ensuring a net gain in wetlands. The FHWA meets regularly with other cabinet agencies as a member of the Federal Working Group on Wetlands and participates in joint research with other Federal agencies for studies on wetland evaluation and mitigation. Information is shared through all these activities.
| Strategic Goal: Improve the Nation's National Defense mobility. |
| Strategic Objective: Improve the capacity and operations of the Strategic Highway Network (STRAHNET) and STRAHNET connectors to support defense mobilization. |
| Defense Mobility |
The FHWA, in partnership with State transportation agencies, administers the Federal-aid Highway Program that funds roads and bridges located on the Strategic Highway Network (STRAHNET) and STRAHNET connectors. The U.S. highway system plays a critical role in the movement of military equipment and personnel during peacetime and particularly in wartime. In light of the fact that the Department of Defense (DOD) is no longer forward deployed, huge amounts of military equipment and personnel must be deployed expeditiously from various Continental United States (CONUS) -based military installations to various seaports and airports of embarkation in the event of a military emergency somewhere in the world. FHWA is committed to improving the Nation's national defense mobility by promoting the improvements of the condition, capacity, and operation of the highway system serving military installations.
STRAHNET is a system of public highways that is a key deterrent in U.S. strategic policy. It provides defense access, continuity, and emergency capabilities for movements of personnel and equipment in both peace and war. It is about 61,000 miles, including the 45,400-mile system of Interstate and Defense Highways and 15,600 miles of other important public highways. STRAHNET connectors (about 1,700 miles) are additional highway routes linking over 200 important military installations and ports to the STRAHNET. These routes are typically used when moving personnel and equipment during a mobilization or deployment. Generally, these routes end at the port boundary or installation gate.
Performance Goal: In FY 2002, improve access between key military installations (including power projection and power support platforms) and the air or seaport point of embarkation to support DOD deployment requirements.
Performance Measure and Results: Percentage of Miles on STRAHNET with IRI < or = 170 in/mi
An increase in the number of miles of STRAHNET and STRAHNET connectors in good condition indicate that State DOTs are investing resources in this important highway network. A decrease indicates that more funding may be needed to provide a safer, more efficient roadway for defense mobility.
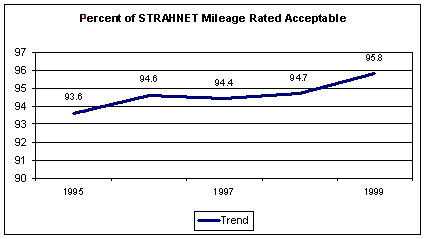
| Trend | |
|---|---|
| 1994 | |
| 1995 | 93.6 |
| 1996 | 94.6 |
| 1997 | 94.4 |
| 1998 | 94.7 |
| 1999 | 95.8 |
| 2000 | |
| 2001 | |
| 2002 | |
| 2003 | |
Performance Measure: Percent of bridges on STRAHNET rated deficient
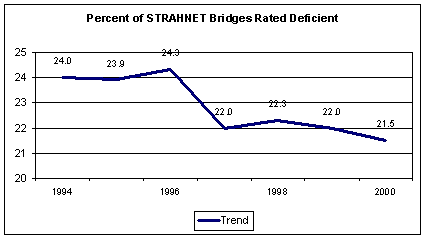
| Trend | Target | |
|---|---|---|
| 1994 | 24 | |
| 1995 | 23.9 | |
| 1996 | 24.3 | |
| 1997 | 22 | |
| 1998 | 22.3 | |
| 1999 | 22 | |
| 2000 | 21.5 | |
| 2001 | 20 | |
| 2002 | 20 | |
| 2003 | 20 | |
Performance Measure: Percent of STRAHNET routes under bridges with clearance greater than 16 feet
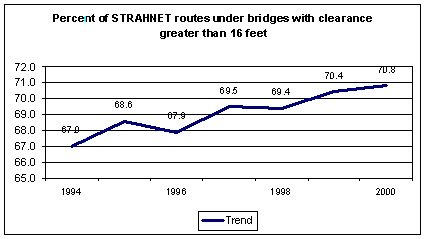
| Trend | Target | |
|---|---|---|
| 1994 | 67 | |
| 1995 | 68.6 | |
| 1996 | 67.9 | |
| 1997 | 69.5 | |
| 1998 | 69.4 | |
| 1999 | 70.4 | |
| 2000 | 70.8 | |
| 2001 | 71.5 | |
| 2002 | 72 | |
| 2003 | 72 |
Safe and unrestricted operation of bridges on the STRAHNET and STRAHNET connectors are an indication of our ability to support defense mobility. The number of deficient bridges is a means of measuring the capability of the system.
External Factors: STRAHNET routes are part of the overall NHS and therefore maintained by the States in accordance with their transportation plans. FHWA and the Military Traffic Management Command Transportation Engineering Agency (MTMCTEA) work with FHWA Division Offices to focus State attention on STRAHNET-specific needs. However, without a separate funding category for the STRAHNET, it is difficult to track the States' investment in the system. Replacement of bridges that are less than 16 feet is not required for every military deployment route, so a goal of 100% is not needed.
2000 Results: IRI data for 2000 will not be available until the fall of 2001, but the trend indicates continued progress.
Discontinued Measure: FHWA and its partners at the MTMCTEA met throughout FY 2000 to develop an index of DOD satisfaction for use as a performance measure. The working group found that the measures developed for FY 2001 (above) were clearer and more useful. They therefore discontinued efforts on the satisfaction index.
FY 2001 Performance Plan Evaluation: FHWA established these measures in FY 2000. While the historic data indicates improvement, we will continue to work with our DOD partners to ensure that we have the most accurate measure of our unique contribution to military deployment needs.
Strategies and Initiatives to Achieve 2002 Goal: The most important STRAHNET and STRAHNET connectors routes are those used to support the Army's and Marine Corps' movement requirements between the Power Projection Platforms and seaports of embarkation. The FHWA also manages the national data on condition of roads and bridges including the STRAHNET and STRAHNET connectors. This information is provided to the DOD Military Traffic Management Command Transportation Engineering Agency to support their national defense strategies.
A second key strategy is to focus on operational aspects of DOD's deployment requirements. The FHWA will organize and conduct emergency preparedness meetings in each State with military and State officials. Specific guidance and measurable deployment requirements will be identified. Subsequent FHWA Performance Plans will then focus on measures that are critical to our DOD customer's deployment requirements. Together, FHWA's strategies will support national security by ensuring both infrastructure and operations satisfy our defense deployment needs.
Other Federal Programs with Common Outcomes: FHWA is working with the MTMC and Office of the Secretary of Transportation to ensure coordination of our National Security goal to support defense mobilization.
*NOTE: Organizational Excellence is a new goal in the U.S. DOT 2000-2005 Strategic Plan.
| Strategic Objective: Improve customer/partner satisfaction. |
| Adding Value: |
Customer/Partner satisfaction means paying attention, listening, and learning and then using that information to deliver what the customer/partner wants. To constantly add value in the delivery of the Federal-aid and Federal Lands Highway programs and improve our relationship with all our partners and customers, we invite feedback. From the Internet, to listening sessions, to sophisticated surveys, we encourage customers to tell us what they expect from us and how satisfied they are with us. Then we go about incorporating that feedback to increase the value we add to every part of our operation.
Performance Goal: Add value in the delivery of our products and services.
Performance Measure/Target: Customer/Partner rating of the timeliness of our decisions, usefulness of our information,1 and competency of our personnel.
1The 2001 survey response was based on customer/ partner rating of the usefulness of our "technical assistance" information in terms of being current, helpful, and relevant.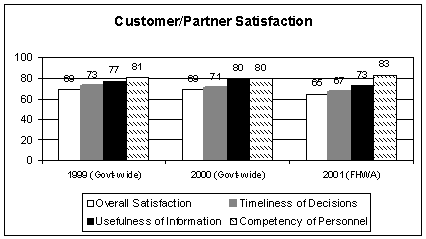
| 1999 (Gov't-wide) |
2000 (Gov't-wide) |
2001 (FHWA) |
|
|---|---|---|---|
| Overall Satisfaction | 69% | 69% | 65% |
| Timeliness of Decisions | 73% | 71% | 67% |
| Usefulness of Information | 77% | 80% | 73% |
| Competency of Personnel | 81% | 80% | 83% |
External Factors: FHWA has to serve many different partners/customers who have unique needs and expectations. To deliver these products and services requires an understanding of our customer/partner needs and expectations.
2000 Results: FHWA will gather this information through existing survey instruments, such as the American Customer Satisfaction Index (ACSI) survey going out to approximately 260 State DOT District Engineers regarding FHWA service. The focus is on measuring the satisfaction of State Department of Transportation Engineers regarding FHWA service. Other customer satisfaction measures can be found in the Mobility and Human and Natural Environment sections.
FY 2001 Performance Plan Evaluation: FHWA is slightly below the Government-wide average in all areas with the exception of the rating on competency of FHWA personnel, which is slightly above the Government-wide average.
Strategies and Initiatives to Achieve 2002 Goal: A survey of other customer/partner segment (other than State district engineers) regarding FHWA services will be conducted. In addition, units are encouraged to develop and implement a local customer feedback mechanism.
Other Federal Programs with Common Outcomes: One of the benefits of the ACSI survey instrument is that FHWA could use the results of the survey to benchmark against other agencies, both public and private sectors. There are many other agencies using customer satisfaction as a measure of their organizational excellence and the results of those agencies could be used to set FHWA goals and targets.
| Strategic Objective: Improve employee satisfaction and effectiveness. |
| Employee Job Satisfaction |
FHWA's successful performance depends on empowered employees who work in a positive, supportive organizational environment. Employees who are satisfied with their workplace, developmental opportunities, and resources are more likely to provide quality service to their customers.
Performance Goal: Increase employee job satisfaction.
Performance Measure and Results: Percent employee job satisfaction.
| Survey Questions | FHWA 1995 |
FHWA 1999 |
FHWA 2000 |
FHWA 2001 |
|---|---|---|---|---|
| Job Satisfaction | 82% | 73% | 80% | 70% |
| •Internal Communications | 54% | 46% | 53% | 40% |
| •Career Development | 74% | 42% | 55% | 55% |
| •Applying Skills & Expertise | 83% | 74% | 88% | 78% |
| •Know What is Expected of My Workgroup |
92% | 89% | 92% | 79% |
| •Rewards and Recognition | 68% | 55% | 63% | 65% |
| •Sensitive to Employee Needs | 73% | 65% | 75% | 70% |
| •Adequate Office Equipment/Supplies | 87% | 80% | 79% | 78% |
| •Satisfied with FHWA as Place to Work |
78% | 77% |
The All-Employee Survey will provide the basis for determining overall employee satisfaction. Job Satisfaction was determined to be the overarching measure for this category of indicators. The percentages represent either "strongly agree" or "somewhat agree.
External Factors: N/A
2000 Results: Employee job satisfaction has increased in FY 2000 over FY 1999. For government-wide, employee job satisfaction survey results for 2000 is 63 percent.
FY 2001 Performance Plan Evaluation: Employee job satisfaction has declined in FY 2001 over FY 2000. The FY 2001 results have not yet been fully analyzed.
Strategies and Initiatives to Achieve 2002 Goal: An interim Agency-wide employee satisfaction survey will be conducted in 2002. In addition, units are encouraged to develop and implement a unit level feedback mechanism. The Human Resource Management Committee will develop and recommend an action plan to address issues identified by August 2001.
Other Federal programs with Common Outcomes: None.
| Training Investment |
Central to the success of achieving our goals are our 2800+ employees that make up the FHWA workforce. By significantly increasing funding devoted to professional development and training, we are offering more opportunities for employees to learn and make greater contributions to our customers.
Performance Goal: Increase job-related training and professional development opportunities available to employees.
Performance Measure/Target: Percent of payroll for training and development*.
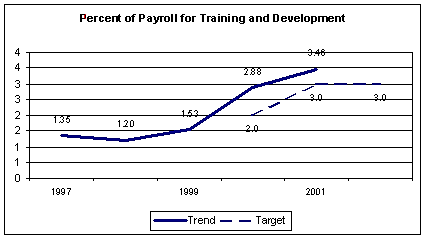
| Trend | Target | Top 50 Organizations | |
|---|---|---|---|
| 1997 | 1.35 | ||
| 1998 | 1.2 | ||
| 1999 | 1.53 | ||
| 2000 | 2.88 | 2 | 3.9 |
| 2001 | 3.46 | 3 | |
| 2002 | 3 |
| *Investment calculated as a percent of payroll (salary plus benefits). Percentages represent total investment in training including tuition, contract cost, participants travel and per diem and instructor travel for all training and career development courses and programs for FHWA employees. |
External Factors: N/A
2000 Results: The FY 2000 training investment exceeds the target by 44 percent. On the average, Top 50 Training Organizations spent more than $5.3 billion (i.e., an average of 3.9 percent of payroll—a full 1.3 percent higher than the industry norm of 2.6 percent) on training and development initiatives in 2000. These companies have embraced training as a mission-critical strategy and, accordingly, have dedicated significant resources to their training efforts.
FY 2001 Performance Plan Evaluation: The FY 2001 projected training investment exceeds the target by 15 percent.
Strategies and Initiatives to Achieve 2002 Goal: Units are encouraged to ensure budgeted funds are obligated and to identify any other opportunities for training. In addition, units will be implementing action items identified by the Workforce Planning and Professional Development Task Force.
Other Federal Programs with Common Outcomes: N/A
| Strategic Objective: Improve organizational performance. |
| Recruitment and Selection |
In today's tight labor market, it is a great challenge to recruit, hire, and retain qualified employees. Due to the greatly expanded program size, in relation to the smaller staff size, we need to fill vacancies with the most qualified candidates in a timely manner to get the maximum use of resources and to continue to provide a high level of customer/partner service.
Performance Goal: Increase the timeliness of the recruitment and selection process
Performance Measure/Target: Percent of the selections are made within 90 days of the position becoming vacant.
External Factors: In tracking and evaluating the agency's performance, positions in several programs will be excluded from the 90-day requirement due to their unique processes. These positions include the SES, the Professional Development Program, and vacancies that fall under the Technical Career Track program. In addition, on a case-by-case basis, special consideration will be given when positions have unusual requirements or results, such as recruitment advertisements in professional journals.
2000 Results: While we currently have the ability to extract the necessary data, it has not been specifically collected and/or analyzed prior to FY 2002. For future years, this data will be tracked and maintained to develop a benchmark and show overall timeliness results for the agency.
FY 2001 Performance Plan Evaluation: This is a new performance goal in FY 2002.
Strategies and Initiatives to Achieve 2002 Goal: Emphasis is placed on selecting vacancies within 90 days of the position becoming vacant.
Other Federal Programs with Common Outcomes: N/A
| Transportation Investment |
The need for surface transportation investment continues to exceed the availability of funds at the Federal, State, and local levels. As Federal funds are made available, it is important that those funds be put to use as readily as possible. Many of our field employees have a hard time relating to the National plan because they do not see how they fit in the National outcome goals. This measure provides the strongest link to what they do everyday. In other words, no matter where you work in FHWA, you can help contribute to this goal by assisting our partners improve in the planning, environment, design, and construction phases. In addition, the Congress and the public would be interested in knowing how much money is actually expended in making roads better. This measure represents our best collective effort in developing a measure to gauge FHWA's ability to deliver the Federal highway program.
Performance Goal: Improve FHWA's delivery of the Federal-aid and Federal Lands Highway programs.
Performance Measure/Target: Percent of obligations expended on open (active) projects
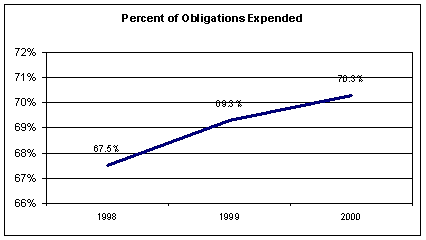
External Factors: Several years are required on the average project for obligated funds to be fully expended. However, streamlining the preconstruction phases, using incentive contracts, improving project funds management, and applying innovative finance techniques can expedite project delivery.
2000 Results: The amount expended compared to the total amount obligated on open (active) Federal-aid and Federal Lands Highway projects showed a one percent increase from Fiscal Year 1999.
Purpose: This measurement simply reflects the rate at which Federal funds obligated on Federal-aid and Federal Lands Highway projects are fulfilling their intended purpose. In other words, expenditures reflect actual project activity. However, measuring only the expenditure amount does not necessarily reflect improvements to the process when the size of the program is increasing. The better measurement is to compare expenditures as a percentage of obligations. An increase in the rate suggests that the average project is advancing faster than it was the year before.
FHWA's Contribution: As a facilitator and promoter of best business practices, FHWA can contribute to this goal by assisting the Federal, State, and locals in the planning phase to identify projects that are ready for advancement; streamlining the environmental process; encouraging the use of innovative contracting; applying innovative finance techniques such as advance construction, GARVEE bonds, State infrastructure banks, or tapered match; and encouraging better project funds management through the early release of excess obligations.
Method of Calculation: The percentage is based on the total amount obligated on all Federal-aid and Federal Lands Highway projects (regardless of year authorized) that have not been final vouchered (FMIS report M79) as of September 30 each year. This amount is compared to the unpaid obligations (FMIS report M80) as of the same day. This provides the amount expended on all open (active) projects. This measure does not reflect activity for a single fiscal year.
Significance: The rate increase from September 30, 1999, to September 30, 2000, was one percent. If the rate had not changed, the amount expended (project activity accomplished) as of September 30, 2000, would have been $1.3 billion less.
FY 2001 Performance Plan Evaluation: This is a new performance goal in FY 2002.
Strategies and Initiatives to Achieve 2002 Goal: Emphasis is placed on the efficient use and management of federal funds including the promotion of best practices, innovative financing and better project funds management.
Other Federal Programs with Common Outcomes: N/A
| NEPA Process |
The recent Congressional streamlining mandate in TEA-21 focuses on expedited project delivery. The NEPA process encourages coordinated environmental reviews to help achieve the timely delivery of transportation projects while protecting and enhancing the environment. More efficient processing is not a new idea or goal, but it has gotten a great deal of attention lately and is a primary focus of at the highest level within FHWA.
Performance Goal: Improve FHWA's delivery of the Federal-aid and Federal Lands Highway programs.
Performance Measure/Target: The average number of months:
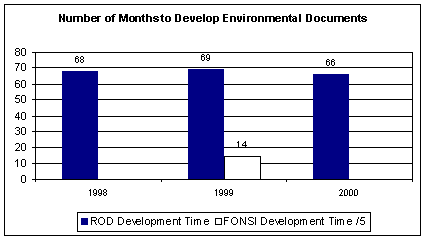
| |
ROD Develop. Time |
FONSI Develop. Time |
|---|---|---|
| 1998 | 68 | |
| 1999 | 69 | 14 |
| 2000 | 66 |
While FHWA will measure the average number of months to complete the environmental process, we will also collect and track intermediate milestones:
External Factors: Public expectations and demands for transportation solutions, today, not ten years from now, are understandable, given the magnitude and pervasiveness of America's transportation challenges. Equally understandable is the public's desire for environmentally friendly ways of doing business. Sometimes these two societal goals work in conflict.
2000 Results: The Environmental Impact Statement development times were based on surveying of Division Offices for information on a) Records of Decision (RODs) approved in a given calendar year; b) dates for the approved ROD and the publication of the Notice of Intent (NOI); and c) the duration between these two dates. The average time for developing RODs was used.
The Environmental Assessment development time was based on a survey of 7 pilot States for information on a) number of calendar months from the approval of action (such as the date a project was established, the project number, or the date of the notice to proceed) to complete Environmental Assessment documents receiving a FONSI in the last fiscal year (FY99); and b) number of environmental assessment documents. The average time for developing FONSIs was used.
FY 2001 Performance Plan Evaluation: This is a new performance goal in FY 2002.
Strategies and Initiatives to Achieve 2002 Goal: Continued emphasis on streamlining environmental process and improved decisionmaking. (Also, see Environment Goal Initiatives and Strategies).
Other Federal Programs with Common Outcomes: In its simplest terms, environmental streamlining consists of cooperatively establishing realistic project development time frames among the transportation and environmental agencies, and then working together cooperatively to adhere to those time frames while still protecting and enhancing the environment. Because major transportation projects are affected by dozens of Federal, State, and local environmental requirements administered by a multitude of agencies, improved interagency cooperation is critical to the success of environmental streamlining.
| Details of Performance Measures |
| Safety |
Measure: Rate of highway-related fatalities per 100 million vehicle miles traveled (VMT).
Data Source: NHTSA's Fatality Analysis Reporting System (FARS) for fatality data. FHWA's VMT data provided by its Highway Performance Monitoring System (HPMS). Information is transmitted to NHTSA and entered into the system after undergoing data review by NHTSA.
Scope of Data: Number of fatalities come from Fatality Analysis Reporting System (FARS) data, a census of fatal traffic crashes within the 50 States, D.C., and Puerto Rico. To be included in FARS, a crash must result in the death of an occupant of a vehicle or a nonmotorist within 30 days of the crash. FARS data is a 100% count of fatal crashes collected from police crash reports, and other State data. FARS data cover all roadways open to the public, using the National Highway System classification of roads. Pedestrian and bicycle fatalities that occur on public highways but do not involve a motor vehicle are not recorded in FARS; however, this is a small number of fatalities. Vehicle miles of travel (VMT) data is derived by FHWA from State-reported estimates of travel based on various levels of sampling dependent on road type.
Measurement Methodology: FARS data are collected in each State by State employees, translated into a standard format, and transmitted to the NHTSA. Data are collected from police crash reports, State vehicle registration files, driver licensing files, highway agency records, vital statistics, death certificates, coroner/medical examiner reports, hospital medical reports, and emergency medical service reports.
The HPMS is an integrated data base that relies on the State highway agencies to annually report area wide data, universe data, standard sample data, “donut” area sample data, and linear reference system data for GIS.
Comments: FARS data elements are modified slightly from year to year to respond to emphasis areas, vehicle fleet changes, and other needs for improvement.
FARS is a census of all highway traffic fatalities. As such it does not include information on crashes that produce only non-fatal injuries or that result in only property damage.
Quality improvements are needed for location information in FARS that permits linkage to highway information for targeting problems and improvement strategies for the highway infrastructure. In 1998, NHTSA began a GPS strategy to correct this shortcoming.
Measure: Highway-related injuries per 100 million vehicle miles traveled.
Data Source: DOT information systems: NHTSA General Estimates System (GES) for number of nonfatal injuries and FHWA Highway Performance Monitoring System (HPMS) for VMT both using States' data.
Scope of Data: Injured persons data is derived from General Estimates System (GES), a nationally representative probability sample that makes national estimates of total nonfatal injury crashes, injured persons, and property damage only crashes. GES data cover all roadways open to the public, using the National Highway System classification of roads. Vehicle miles of travel (VMT) data is derived by FHWA from State-reported estimates of travel based on various levels of sampling dependent on road type.
Measurement Methodology: The GES collects general information about the location of crashes in its sample. The HPMS is an integrated data base that relies on the State highway agencies to report area wide data, universe data, standard sample data, “donut” area sample data, and linear reference system data for GIS. The area-wide data consist of five statewide summaries. The summaries include data on travel and fatal and nonfatal crashes. This summary will be dropped from future HPMS.
Comments: The GES sample plan only allows estimates of national totals, not detailed State by State breakdowns. Only general information is collected on the type of crash and highway system involved. The GES sample is designed to analyze vehicle and occupant injury information, not the roadway elements.
Although various sources suggest that about half the motor vehicle crashes in the country are not reported to police, the majority of these unreported crashes involve only minor property damage and no significant personal injury. By restricting attention to police reported crashes, the GES concentrates on those crashes of greatest concern to the highway safety community and the general public.
| Mobility |
| Measure: Percent of vehicle kilometers/miles traveled on the National Highway System (NHS) that meet pavement performance standards for acceptable ride quality (International Roughness Index less than or equal to 170 in/mi. |
Data Source: Information system: Highway Performance Information System (HPMS)
Scope of Data: Data include vehicle miles traveled on the HPMS reported NHS sections and pavement ride quality data reported using the International Roughness Index (IRI). IRI is a quantitative measure of the accumulated response of a "quarter-car" vehicle suspension experienced while traveling over a pavement.
Measurement Methodology: Data are collected by the State Highway Agencies and reported to FHWA for the HPMS. They are obtained from measurement devices that meet industry set standards. Recommended measurement procedures are included in the HPMS Field Manual.
Data Issues: IRI data for the approved NHS exist from 1995 onward. Past data (1993 and 1994) were collected on the proposed, rather than the approved NHS. No NHS IRI data are available prior to 1993. The HPMS requires States to report IRI data every two years. In the HPMS Field Manual, FHWA refers to AASHTO Provisional Standards for measurement of pavement profile as the preferred method for equipment and data collection.
|
Measure: Percentage of NHS Bridges' deck area classified as deficient
for all ADT (structurally deficient or functionally obsolete) |
Data Source: National Bridge Inventory (NBI) information.
Scope of Data: The National Bridge Inventory System (NBIS) requires the inspection of all bridges located on public roads and the submission of the collected bridge inventory and inspection data to the FHWA for inclusion in the NBI. The FHWA maintains the NBI. The NBI contains data on the Nation's 582,750 highway bridges. The information in the NBI contains 95 data items for each of the bridges as required by the Recording and Coding Guide for the Structure Inventory and Appraisal of the Nation's Bridges. From the data provided, the FHWA monitors the condition of the Nation's bridges, which includes identifying those bridges that are either functionally obsolete or structurally deficient.
Measurement Methodology: The bridge information is collected by the State DOTs and other bridge owners and is provided to the FHWA at least annually (Note: Some States do it quarterly). As part of the FHWA's NBI, NBIS, and Highway Bridge Replacement and Rehabilitation Program (HBRRP) monitoring and oversight responsibilities, the accuracy and reliability of the submitted NBI information is constantly evaluated through data checks and field reviews by both Headquarters and field office personnel.
Data Issues: The NBI is the world's most comprehensive database of bridge information.
| Measure: Percent overall user satisfaction with the Nation's highway systems. |
Data Source: BTS Omnibus Survey conducted in 2000 and the Nationwide Personal Transportation Survey and National Quality Initiative (NQI) Survey conducted in 1995.
Scope of Data: A national sample of households.
Measurement Methodology: The DOT Bureau of Transportation Statistics conducted a telephone survey in calendar year 2000 of 2,030 randomly-selected U.S. households. Participants were asked multiple-choice questions concerning changes in the public's satisfaction with specific characteristics of the Nation's roads, as well as question focused on satisfaction from a community perspective.
Data Issues: None.
| Measure: Percent user satisfaction with the operation of the system. |
Data Source: Traveler Perception Survey
Scope of Data: A national sample of freight shippers and passengers.
Measurement Methodology: Survey both freight shippers/stakeholders and passengers to ascertain satisfaction with both highway system and connectors.
Data Issues: None
|
Congested travel |
Data Source: Highway Performance Monitoring System (HPMS).
Scope of Data: HPMS data elements reported from approximately 400 urbanized areas within the United States. Data is based upon daily travel on the freeways and on arterial streets.
Measurement Methodology: Methodology used to calculate performance measures has been developed by the Texas Transportation Institute and used in their annual Mobility Study.
Data Issues:
The proportion of congested travel figures used in calculating the measures
are computed rather than measured values. The computed values may understate
congestion, as delay from incidents is not calculated.
Traveler Delay
|
Travel Delay |
Data Source: Highway Performance Monitoring System (HPMS).
Scope of Data: HPMS data elements reported from approximately 400 urbanized areas within the United States. Data is based upon daily travel on the freeways and on arterial streets. Hours of delay is derived from congested traffic volumes, crashes, and/or vehicle breakdowns.
Measurement Methodology: Methodology used to calculate performance measures has been developed by the Texas Transportation Institute and used in their annual Mobility Study.
Data Issues:
None
Travel Time Measure
|
Measure 2001: Slow the
projected growth percentage of 27% to 26.6% |
Scope of Data: HPMS data reported from approximately 400 urbanized areas within the United States. Data represents peak period travel.
Measurement Methodology: Methodology used to calculate performance measures has been developed by the Texas Transportation Institute and used in their Mobility Study.
Data Issues: The travel time figures used in calculating the measures are computed rather than measured values. The computed values may understate travel time, as delay from incidents is not calculated.
| Productivity |
|
Measure: Cost of highway freight per mile (to be developed) |
The following interim steps will be taken in FY 2001 to develop the performance measure "Cost of highway freight per ton-mile"
|
Measure: Hours of delay/1000 commercial vehicles processed at NHS border crossings. |
The following interim steps will be taken in FY 2001 to develop the performance measure "Hours of delay per 1000 vehicles processed at 4 NHS border crossing pilot sites."
|
Measure: Improve the efficiency of highway infrastructure investments by developing and promoting the use of engineering/economic analysis tools for decisionmaking. |
To be developed.
For FY 2002, FHWA has identified two immediate initiatives which will help FHWA to meet this long-term goal: (1) Establish a pilot program with five States in FY 2000 to test the applicability of existing engineering/economic investment models, specifically the Highway Economic Requirements System (HERS) Model, to help States make highway program investment decisions; and (2) Initiate development of a life-cycle cost analysis (LCCA) model for subsequent testing by states in FY 2001.
Baseline data will be collected following the delivery of executive-level training in engineering-economic analysis tools to the FHWA Division Administrators in late summer and early fall 2001.
| Human and Natural Environment |
|
Measure: Percent community satisfaction with the Nation's highways contribution to meeting community goals. (To be developed as part of the Nationwide Personal Transportation Survey (NPTS) and the BTS Omnibus survey; see also mobility goal). |
Data Source: FHWA NPTS FY 2000 Survey and the BTS Omnibus survey.
Scope of Data: National sample of population.
Measurement Methodology: FHWA's Office Highway Policy Information administers the survey. BTS is developing the Omnibus survey.
Data Issues: NPTS is conducted about every 5 years rather than annually so year to year trends will not be available. BTS will include community satisfaction questions in its survey, but a measure of community satisfaction will have to be developed.
|
Measure: EPA rating of FHWA Environmental Impact Statements (EIS). |
Data Source: FHWA Database of EPA EIS Ratings
Scope of Data: Data is EPA staff ratings of EISs prepared by FHWA.
Measurement Methodology: EPA's Office of Federal Activities compiles data from EPA regional office comment letters.
|
Measure: On-road mobile source emissions in short tons. |
Data Source: National Air Quality and Emissions Trends Report, EPA. (EPA uses data from FHWA's Highway Performance Monitoring System (HPMS)).
Scope of Data: Total mobile source emissions are the sum of on-road mobile source emissions of carbon monoxide, hydrocarbons, nitrogen oxides, and particulate matter less than 10 microns in diameter (PM-10).
Measurement Methodology: The annual emissions level is the estimated total annual tonnage of on-road mobile source emissions of carbon monoxide, hydrocarbons, nitrogen oxides, and PM-10 as reported in the latest EPA Trends Report.
Data Issues: The Trends Report is usually available around October of each year. There is a 1-year time lag for the emissions data. For example, the March 2000 report contains 1998 data.
The EPA's use of a mathematical model poses issues of model validation. The annual variation in the model's estimates, as measured by the regression standard error, is 2.57. The HPMS data used as input to the model are subject to sampling and non-sampling errors.
|
Measure: Percent of nonattainment and maintenance areas meeting their mobile source emissions budget goals. |
Data Source: FHWA Field offices
Scope of Data: Data is collected every year on July 1 in order to generate data trend.
Measurement Methodology: Each FHWA field office is requested to report the number of nonattainment and maintenance areas that meet their mobile source emissions budget by pollutant.
Data Issues: The makeup and severity of nonattainment areas will vary year to year. The data collected reflect only a snapshot status of the nonattainment and maintenance area. When an area does not meet the air quality standard for one of the criteria pollutants, it may be subject to the formal rulemaking process which designates it “nonattainment.” The Clean Air Act Amendments (CAAA) of 1990 and subsequent rulemakings further classify ozone (O3), carbon monoxide (CO), and some particulate matter (PM-10) nonattainment areas based on the magnitude of the area's problem. Nonattainment classifications are used to specify what air pollution reduction measures an area must adopt and when the area must reach attainment.
|
Measure: Ratio of wetland replacement resulting from Federal-aid highway projects. |
Data Source: State DOT wetland mitigation databases.
Scope of Data: Data is available for FY96 through FY 2000.
Measurement Methodology: Data records are compiled by DOTs using locally developed databases. A new FHWA Wetlands Management Database, when available, will also be used.
Data Issues: At this time, FHWA only requests data on an annual basis. The data is summary in nature; reflecting total acres of wetlands impacted versus total acres of mitigation provided.
The uniformity of the data is not guaranteed. The data is subject to interpretation by the reporting State DOTs. In particular, there is no uniform understanding of what should be reported as mitigation acreage. The FHWA has provided guidance on mitigation activities to report and will soon issue the Wetlands Management Database which should reduce the current variations in data received from the States.
| National Security |
|
Measure: Percentage of STRAHNET and STRAHNET connectors with IRI < or = 170 IN/MI. |
Data Source: The FHWA Highway Performance Monitoring System (HPMS) for roads and National Bridge Inventory (NBI) for bridges on STAHNET (including STRAHNET connectors) and Customer Surveys.
Scope of data: Adequate condition of STRAHNET and STRAHNET connectors to support DOD deployment and MTMCTEA Satisfaction Data with highways serving military installations.
Measurement methodology: Annual update to HPMS, NBI, and Customer-Partner Surveys.
Data issues: HPMS and NBI condition data continually being updated and made more accurate for use in geographical information system (GIS) application. Customer-Partner satisfaction criteria and data is being developed.
|
Measure: Percentage of STRAHNET bridges classified as deficient (structurally deficient or functionally obsolete). Measure: Percent of STRAHNET routes under bridges with clearance of more than 16 feet. |
Data Source: National Bridge Inventory (NBI) information.
Scope of Data: The National Bridge Inventory System (NBIS) requires the inspection of all bridges located on public roads and the submission of the collected bridge inventory and inspection data to the FHWA for inclusion in the NBI. The FHWA maintains the NBI. The NBI contains data on the Nation's 582,750 bridges. The information in the NBI contains 95 data items for each of the bridges as required by the Recording and Coding Guide for the Structure Inventory and Appraisal of the Nation's Bridges. From the data provided, the FHWA monitors the condition of the Nation's bridges, which includes identifying those bridges that are either functionally obsolete or structurally deficient.
Measurement Methodology: The bridge information is collected by the State DOTs and other bridge owners and is provided to the FHWA at least annually (Note: Some states do it quarterly). As part of the FHWA's NBI, NBIS, and Highway Bridge Replacement and Rehabilitation Program (HBRRP) monitoring and oversight responsibilities, the accuracy and reliability of the submitted NBI information is constantly evaluated through data checks and field reviews by both Headquarters and field office personnel.
Data Issues: The NBI is the world's most comprehensive database of bridge information.
| Organizational Excellence |
|
Measure: Customer/Partner rating of the timeliness of our decisions, usefulness of our information, and competency of our personnel. |
Data Source: Customer/Partner feedback thru American Customer Satisfaction Index (ACSI) survey instrument.
Scope of data: Timeliness of our decisions – The timeliness of receiving decisions from FHWA for program level activities such as issuance of regulations, reviews and authorizations for the State Transportation Improvement Program and safety plans, and for project delivery activities for individual highway improvements (as defined in 2001 survey).
Usefulness of our information – The usefulness of our “technical assistance” information in terms of being current, helpful, and relevant (as defined in 2001 survey).
Competency of our personnel – In terms of being knowledgeable and experienced, how capable are FHWA personnel in providing direct technical assistance (as defined in 2001 survey).
Measurement methodology: ACSI is a zero-to-100 scale used by the private and public sectors to rate how customers perceive companies and organizations.
Data issues: Since this is a survey of perceptions, ratings are subjective.
|
Measure: Percent employee job satisfaction (percent positive responses) |
Data Source: Employee feedback using the All Employee Survey tool
Scope of Data: Job satisfaction was determined to be the overarching measure for this category. Percent positive responses means either “strongly agree” or “somewhat agree” with the statement “I am satisfied with my job.”
Measurement Methodology: The FHWA 2001 All-Employee Survey is a biennial survey that was also administered in 1995 and 1999. An Interim Survey comprised of ten core item statements was administered in 2000. The current strategy is to administer the full survey biennially and the interim survey in between years. The Interaction Research Institute, Inc. conducted the 2001 survey under contract.
Data Issues: Since this is a survey of perceptions, ratings are subjective.
|
Measure: Percent of payroll for training and development |
Data Source: Departmental Accounting and Financial Information System (DAFIS).
Scope of Data: Percent of Payroll (salary plus benefits) – Percentages represent total investment in training including tuition, contract cost, participants travel and per diem and instructor travel for all training and career development courses and programs for FHWA employees.
Measurement Methodology: Amount of dollars spent on training and development divided by salary and benefits.
Data Issues: On average, the Top 50 Training Organizations spend 3.9% of payroll on training, exceeding the industry norm of 2.6%.
|
Measure: Percent of the selections are made within 90 days of the position becoming vacant. |
Data Source: Human Resource Staffing Database.
Scope of Data: Start of 90 Days – is defined as the effective date on the departing employee's SF-50 personnel action.
End of 90 Days – is defined as the date on the selection certificate once a selection is made.
Exceptions to the 90-Day Selection – Positions in several programs will be excluded from the 90-day requirement due to their unique processes. These positions include the SES, the Professional Development Program, and vacancies that fall under the Technical Career Track program. In addition, on a case-by-case basis, special consideration will be given when positions have unusual requirements or results, such as recruitment advertisements in professional journals.
Measurement Methodology: The date on the selection certificate minus the effective date on the departing employee's SF 50 personnel action.
Data Issues: Until recently, such information has not been collected. FHWA is establishing baseline data.
|
Measure: Percent of obligations expended on open (active) projects |
Data Source: Fiscal Management Information System (FMIS).
Scope of Data: The percentage is based on the total amount obligated on all Federal-aid and Federal Lands Highway projects (regardless of year authorized) that have not been final vouchered (FMIS report M79) as of September 30 each year.
Measurement Methodology: The amount described above is compared to the unpaid obligations (FMIS report M80) as of the same day. This provides the amount expended on all open (active) projects.
Data Issues: This measure does not reflect activity for a single fiscal year.
|
Measure: The average number of months from Notice of Intent to approval of the Record of Decision for evironmental Impact Statements. |
Data Source: Data is collected at Division level and aggregated at the national level by our Environmental office.
Scope of Data: Environmental Impact Statement (EIS) – A written assessment of the anticipated significant effects, both positive and negative, which a prospective Federal agency decision may have upon the quality of the human and natural environment.
Notice of Intent (NOI) – An official announcement in the Federal Register advising interested parties that an environmental impact statement will be prepared and circulated for a given agency action.
Record of Decision (ROD) – A final Federal decision-making document, relative to EISs, that presents the basis for selecting and approving a specific course of action, including identification of the alternatives considered, measures to minimize harm and an itemized list of commitments and mitigation measures.
Measurement Methodology: Information on development time from the Notice of Intent to: a) Draft EIS; b) Final EIS; c) Record of Decision; d) EIS with 4(f); and e) EIS without 4(f) will be tracked.
Data Issues: This is a new measure. Data collection procedures are still being refined.
|
Measure: The average number of months from the start of the Environmental Assessment process to FHWA's issuance of the Finding of No Significant Impact (FONSI). |
Data Source: Data is collected at Division level and aggregated at the national level by our Environmental office.
Scope of Data: Environmental Assessment (EA) – An exploratory report which is prepared when the potential for significant impacts, relative to Federal actions, is unclear.
Finding of No Significant Impact (FONSI) – An administrative determination by a Federal agency detailing that the finding of no significant impact relative to the Federal agency's action.
Measurement Methodology: Information on development time from the start of the EA to FHWA's issuance of the FONSI.
Data Issues: States vary in their definition of the start of the EA process. It can be: a) the date the applicant notified FHWA and other agencies that they have started the EA process; b) the date the authorization was issued if Federal funds were requested for the preparation of the EA; c) the date of the notice to proceed; or d) the date a project number was established. So long as a State remains consistent in its definition of the start time, FHWA can collect meaningful data.