|
|
|
|
|
Highway Trust FundFinancial Report for Fiscal Year 2004— Management's Discussion and Analysis — |
Table of Contents | Management's Discussion and Analysis | Financial Section | Appendices |
Highway Safety
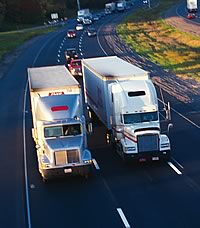
Highway crashes cause 95 percent of all transportation related fatalities and 99 percent of transportation injuries, and are the leading cause of death for Americans age two and every age from four through 33. Alcohol is still the single biggest contributing factor in fatal crashes. In 2003 alone, an estimated 17,013 lives (equating to 40 percent of all crash-related fatalities) were lost in alcohol-related crashes. Recent statistics show that about 12 percent of all people killed in motor vehicle incidents were involved in a crash with a large truck, yet trucks represented less than four percent of registered vehicles and over seven percent of the vehicle miles of travel. Twenty percent of Americans (about 60 million people) still do not use safety belts all of the time when driving motor vehicles. The large number of crashes has placed a considerable burden on the nation's health care system and has had significant economic effects. The cost to the economy of all motor vehicle crashes was approximately $230 billion in 2000, or 2.3 percent of the U.S. gross domestic product. The table below depicts the performance measures and goals related to Highway Safety.
FY 2004 Results: The Department did not meet the fatalities per vehicle goal or the large truck related fatalities goal. As a direct result of the Department's programs, motor vehicle travel has become safer overall—the fatality rate declined from 3.35 in 1980 to a projected 1.45 in 2004. While the Department is making some progress in achieving long-term performance goals, substantial progress still needs to be made to reach the 2008 goal of 1.0 fatality per 100 million VMT. FHWAFHWA's safety infrastructure approach has helped minimize the most frequent types of crash-related fatalities and injuries. In FY 2004, FHWA concentrated on reducing roadside departure crashes by promoting greater use of roadway improvements, such as upgraded guardrails and rumble strips, greater use of retroreflective signage and improved markings, and the removal of roadside hazards. Approximately 40 states have now adopted rumble strip policies that conform to the FHWA Rumble Strip Technical Advisory. FHWA also continued to promote the introduction of comprehensive intersection design and operational tools, including enforcement strategies, and sought opportunities to expand analysis and improvement of intersection safety problems at specific locations. FHWA continued to promote adoption of the framework of the American Association of State Highway Transportation Officials (AASHTO) Strategic Highway Safety Plan. This includes actively engaging lead states to develop strategic safety plans with strong crash data systems, establishing a statewide goal for reducing deaths within a set period of time, and engaging stakeholder safety teams to support the effort. The FY 2004 target was to develop strategic safety plans in 22 states. Currently:
Efforts also continued to develop technology-based systems that could significantly reduce roadway departure, intersection, and pedestrian crashes. An intersection safety test facility was established at the FHWA Turner Fairbanks Highway Research Center to identify and test new technologies to be deployed by states to reduce highway crashes. FMCSAFMCSA and its state partners have reduced the fatality rate in crashes involving large trucks for six consecutive years. The fatality rate for crashes involving large trucks, which takes into account increased risk exposure due to yearly increases in TVMT, has been reduced by 20 percent since 1996. FMCSA, together with its federal and state partner safety programs, accounted for an estimated 1,248 lives saved in 2003. Compliance and Enforcement
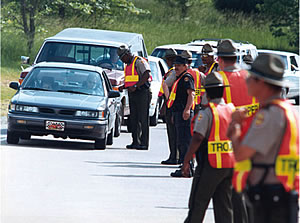
Setting regulatory standards has been the cornerstone of FMCSA's compliance and enforcement mission. In FY 2004, FMCSA issued final rules concerning hazardous materials (HAZMAT or HM) permitting, fuel tank design, driver training, and driver history. In addition to providing technical assistance to industry and the public, FMCSA established an e-mail address for submission of questions regarding Federal Motor Carrier Safety Regulations (FMCSRs). FMCSA also responded to approximately 700 e-mail inquiries and processed in excess of 3,500 phone calls concerning safety regulations. FMCSA also continued to place a high priority on enforcement and compliance operational activities. FMCSA obligated $166 million to states for motor carrier compliance and enforcement activities to complement federal operations. To ensure compliance with FMCSRs during FY 2004, federal and state safety enforcement operations conducted:
In FY 2004, the number of states participating in the Performance and Registration Information Safety Management System, an initiative that links the safety records of motor carriers with their ability to register their vehicles, increased by three to a total of 35. Education and Outreach FMCSA provided CMV safety training for over 4,0401 state and local law enforcement personnel; and, 5,777 FMCSA also launched a major initiative to promote the use of safety belts by CMV drivers. The program encompassed partnership opportunities, research, education, and outreach, together with law enforcement, to educate CMV drivers about the dangers of not wearing safety belts and to encourage their use. Finally, FMCSA published and disseminated a report on best highway practices used by the safest commercial motor carriers and a brochure on safety management for motor carriers that focused on the safety management practices of the industry's safety leaders. Driver Identification and Qualification In FY 2004, FMCSA issued rules covering the Minimum Training requirements for Drivers of Longer Combination Vehicles (LCV), Minimum Training for Entry-Level Drivers, and Safety Performance History of New Drivers. Medical qualifications of CMV drivers remained as an area of focus during FY 2004. FMCSA completed a Drug Test Results Study required by the Motor Carrier Safety Improvement Act (MCSIA), reviewed 693 Safety Information, Research and Technology (R&T)FMCSA's R&T programs provided advances and innovations to improve CMV safety. To focus and prioritize R&T activities, FMCSA completed a five-year R&T Strategic Plan (2005-2009). In addition, FMCSA:
FMCSA also continued the Large Truck Crash Causation Study in FY 2004 to better understand the factors contributing to large truck and motor coach crashes. FMCSA finished data collection, completed 90 percent of crash case coding, and began development of a data analysis plan. In addition, FMCSA completed the feasibility report for the Bus Causation Study and approved a data collection plan. FMCSA continued to make safety information available to the public on its Analysis and Information (A&I) Web site, receiving approximately 1,000,000 hits during FY 2004. The following table depicts NHTSA supplemental performance measures and goals related to Highway Safety.
FY 2004 Results: NHTSA exceeded the goal for use of safety belts. Data is not yet available for alcohol related fatalities or child occupant fatalities between ages of 0 to 4 years.
NHTSADeaths of passenger vehicle occupants decreased significantly by 2.9 percent in 2003 (the most current data). Occupant fatalities in passenger cars decreased by 5.4 percent while occupant fatalities in light trucks and vans (LTVs)—to include sport utility vehicles (SUV), vans, and pickup trucks—increased by 1.4 percent. In 2003, the number of pedestrians, bicyclists, and others who were not occupants of moving motor vehicles killed in motor vehicle crashes declined by 2.1 percent. Fatalities for children ages 0 to 3 remained the same in 2003 with 494 deaths. This is still below 500 that was an all time low. The fatalities of children ages 4 to 7 continued to decline by 1.7 percent. However, fatalities for children 8 to 15 years old increased 1.8 percent. Alcohol-related fatalities declined 2.9 percent but still claimed over 17,000 lives, and motorcycle fatalities increased for the sixth year in a row to 73 percent since 1997. Using a performance-based management process, NHTSA made available $152 million in state and community highway safety formula grants. These grants also provided support for data collections and reporting of traffic deaths and injuries. States also used these grants supplemented by their own funds to:
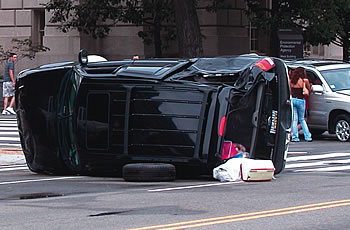
In the past four years, safety belt use has increased steadily from 71 percent in 2000 to 80 percent in FY 2004. The 80 percent safety belt usage will save 15,200 lives and $50 billion in economic costs associated with traffic-related crashes, injuries, and deaths every year. Belt use is statistically lower in states with secondary belt enforcement laws than in states with primary laws, and lower in rural areas than in urban or suburban areas. In FY 2004, states that allowed more stringent enforcement of their belt use laws (“primary” states) reached a milestone of 84 percent belt use. While the percentage of unrestrained passenger vehicle occupants killed in crashes declined by three percentage points (closely reflecting the four percentage point increase in safety belt use observed in 2003), most passenger vehicle occupants killed in motor vehicle crashes continued to be unrestrained—and many of these result in ejection of the unrestrained person from the vehicle during a rollover event. In 2003, passenger vehicle occupant fatalities in rollover crashes declined for passenger cars and pickup trucks, but again increased for vans (3.6 percent) and SUVs (6.8 percent). In FY 2004, NHTSA conducted a national “Click It or Ticket” campaign encouraging states to continue to conduct periodic high-visibility safety belt law enforcement mobilizations. In addition, the Agency developed program strategies to assist states in implementing continuous high-visibility enforcement operations (24 hours a day, seven days a week). NHTSA also continued demonstration projects designed to increase safety belt use among rural populations, pickup truck drivers, teens, and minorities. Finally, NHTSA made available over $25 million in Occupant Protection Incentive Grants to 35 jurisdictions (31 states, the District of Columbia, Puerto Rico and two U.S. territories) to implement specific occupant protection laws and programs, such as a safety belt law providing for primary enforcement or a law requiring safety belt use in each vehicle seat. Alcohol-related crashes and their related mortality tolls continued to pose a significant public health challenge throughout the country. Alcohol-related fatalities per 100 million decreased slightly from 0.61 in 2002 to 0.59 in 2003. In 2003, NHTSA estimated that about seven percent of all police-reported crashes were alcohol-involved—amounting to 40 percent of all fatal crashes, claiming 17,013 lives. Therefore, NHTSA continued to enhance its impaired driving program, with emphasis on assisting high-risk populations (e.g., underage drinkers, 21 to 34 year-olds, individuals with high blood alcohol concentration (BAC) or repeat offenders) in order to reverse the current trend.
In FY 2004, NHTSA launched a Strategic Evaluation States Initiative, involving 13 states with either high annual totals of alcohol-related fatalities or high alcohol-related fatality rates per 100 million VMT. All 13 states implemented impaired driving enforcement campaigns with periodic high-visibility enforcement efforts, including media campaigns delivering the message “You Drink and Drive, You Lose.” As part of this campaign, states conducted impaired driving enforcement crackdowns during the Christmas/New Year's holidays and again around Labor Day 2004. NHTSA made available more than $31 million in Alcohol-Impaired Driving Countermeasures Incentive Grants to 36 states having alcohol-impaired driving countermeasure laws or programs, such as administrative license revocation laws and graduated licensing programs, or to meet certain performance criteria based on their alcohol-related fatality rates. Additionally, 49 states, the District of Columbia, and Puerto Rico received $80.6 million in incentive grants for lowering the legal threshold for impaired driving to .08 percent BAC. As of July 2004, all 50 states, the District of Columbia, and Puerto Rico had enacted .08 BAC laws with the passage of legislation in Delaware, however, Minnesota's law does not become effective until August 2005. Foonotes: 1. Data as of June 30, 2004. (Back to text) |
 r
r