|
|
|
|
|
Highway Trust FundFinancial Report for Fiscal Year 2004— Management's Discussion and Analysis — |
Table of Contents | Management's Discussion and Analysis | Financial Section | Appendices |
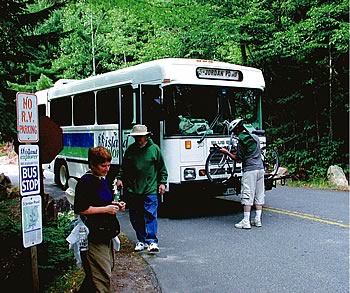
Transit RidershipIn 2003, people rode public transportation systems 9.0 billion times, traveling to and from work, medical appointments, school, and social events. Public transit offers many benefits. It is one of the safest ways of traveling, relieves road congestion, and reduces air pollution. But achieving these benefits depends upon ridership. The federal transit investment combined with state and private sector funds make public transportation possible for millions of Americans every day. The following table depicts the performance measures and goals related to Transit Ridership.
FY 2004 Results: The Department did not meet the performance target. It should also be noted that the transit ridership target for 2005 may also be affected as detailed below. The following table depicts the FTA supplemental performance measures and goals related to Transit Ridership.
FY 2004 Results: Data not yet available for these measures.
FTATransit Ridership
FTA implemented several new initiatives to promote ridership and recognized transit agencies that developed innovative and successful programs to increase ridership. In April 2004, FTA selected four communities to receive grants in an innovative pilot program aimed at increasing public transit ridership through targeted, customized marketing methods. The results will eventually be made available to communities nationwide. FTA also worked with the National Transit Institute (NTI) to develop a two-day course on “Market-Based Ridership Strategies” which was piloted at the Triangle Transit Authority in Durham, North Carolina in June 2004. FTA launched a new Web site page dedicated to innovative practices from the transit industry on increasing transit ridership. The site showcases innovative practices from the transit agencies that have resulted in increased ridership. Finally, FTA worked with the Transit Cooperative Research Program on a study entitled, Determining the Elements Needed to Create High Ridership Transit Systems, which is expected to be completed by the end of 2005. Improved Bus and Rail Fleet ConditionBetween 2000 and 2002, the average age of each type of bus vehicle, except trolley buses, declined. In the case of rail, the average age of heavy rail vehicles declined from 23 to 20 years, outweighing slightly smaller increases in the average ages of other rail vehicles. Average bus and rail vehicle conditions normally range between 3.0 and 4.0, which reflects an “adequate” condition. Anything lower than 3.0 would be less than adequate, while a level higher than 4.0 would require an overly ambitious replacement program where vehicles are replaced prior to their FTA mandated minimum replacement ages. FTA's accomplishments related to major capitol investment grants in FY 2004 included tracking over 120 current planning studies that considered major transit capital investments and recommending funding for meritorious New Starts projects; tracking 26 projects in the preliminary engineering (PE) phase of project development with the total capital cost estimated at $18.3 billion; and tracking 11 projects in the final design phase of project development. Since 1992, FTA has approved or recommended in the President's budget a total of 51 Full Funding Grant Agreements (FFGA) to improve the transit infrastructure. In FY 2004, the federal share of the projects under construction totaled $9.03 billion nationwide. When state and local funds are included, these projects will result in an investment of over $16.1 billion in new mass transit infrastructure from coast to coast. Finally, FTA's R&T program partnered with the transportation industry to establish preeminence in U.S. transit technology, institutions, and customer services, and increase the quality and level of transit services. FTA evaluated the effectiveness of different strategies to increase ridership. As the most effective measures were identified, FTA provided transit agencies with technical assistance to help make them better equipped to employ new service methods and technologies that improve their operations and lead to increased ridership. The intended result of such efforts is the deployment of technological innovations to improve personal mobility, minimize automobile fuel consumption and air pollution, increase ridership, and enhance the quality of life in all communities. |
 4
4