While the primary goal of the Congestion Mitigation Air Quality Improvement (CMAQ) program is to clean the air, many of the efforts supported by CMAQ contribute directly to the Nation's mobility goals. Projects that improve air quality through better traffic flow, enhanced transit services, provision of other modes of travel, or more choices for shippers also provide substantial benefits to the transportation system. Such improvements are often overlooked as the congestion piece of the CMAQ program is viewed as a goal secondary to air quality. This report provides some examples of mobility enhancements attributed to CMAQ.
The United States is a very mobile nation. Americans traveled more than 2.7 trillion vehicle miles1 and took more than 8.7 billion trips by transit in 2000.2 More than 11 billion tons of freight were transported domestically via highway, rail, and air in 1997, with a total value of over $6.9 trillion.3
| Mobility, at its simplest, can be defined as the ability to access goods, services, and destinations. |
Mobility affords many benefits to society. The ability to move freely provides increased opportunities for people and businesses to interact with each other, earn a living, visit friends and family, and take advantage of recreational opportunities. A mobile society also implies transportation choices, so that people of all ages and abilities have access to options for work and recreation. Ultimately, mobility is not so much about how many miles are traveled; rather, it is about how easy it is to access jobs, shopping, and schools, and to meet other personal needs that are direct quality-of-life measures.
Various methods can be used to assess mobility. Mobility can be measured in terms of travel times, level of traffic congestion, or duration of congestion -all of which focus on how long it takes to get from place to place. Mobility also can be measured in terms of the availability of travel choices, which may include different routes or modes of travel, such as transit, bicycling, and walking. Travel time reliability is another measure that can be used to gauge how well the system is functioning for the customer.
Since 1990, highway travel activity in the United States has grown more than twice as rapidly as the population, with a 25-percent total increase in vehicle miles traveled (VMT).4 As a result of this growth in VMT, communities across the United States are facing substantial increases in traffic congestion.
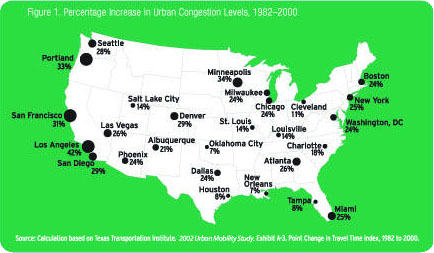
Figure 1 shows the percentage increase incongestion experienced in many urban areas across the country.
Gridlock on the roads occurs in large and small urban areas alike, leading to frustration for residents and economic problems for businesses in getting employees to work, goods to market, or customers in the door. Having few mobility options and congested roads limits the ability of people to get from place to place, wastes time and energy, contributes to air pollution, and leads to higher costs for goods and services.
Since 1982, the annual cost of congestion in 75 metropolitan areas has increased by more than 400 percent to $67.5 billion in 2000. These congestion costs include wasted time, fuel, and vehicle operating costs. On average, rush-hour drivers spend 62 hours delayed in traffic and burn nearly 100 extra gallons of fuel per year. In 2000, the delay totaled 3.5 billion hours, and the extra fuel amounted to more than 5.7 billion gallons.5
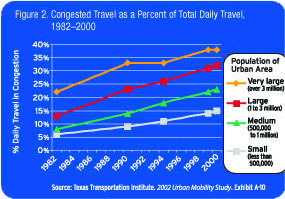
Worsening traffic congestion problems are not just confined to the largest metropolitan areas. Figure 2 shows the increase in the proportion of daily travel that occurs during congested conditions for urban areas of various sizes in the United States. From 1982 to 2000, the average annual travel delay per peak period more than quadrupled in areas with less than one million people. All of the size categories show more severe congestion for longer durations that affect more of the transportation network in 2000 than in 1982.
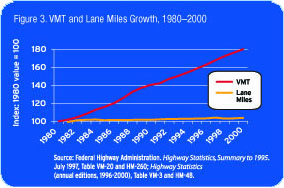
As population, incomes, and commerce have increased, more freight and passenger vehicles are using the road system. Communities have been unable to keep pace with this growth through new highway capacity, operational improvements, alternative modes of transportation, or transit enhancements. Community, environmental, and social goals also limit the amount of land communities are willing to dedicate to new transportation facilities. Nationally, vehicle travel increased 80 percent from 1980 to 2000, while road lane-miles increased less than 4 percent, as shown in Figure 3.6
Into the future, demands on existing infrastructure will only increase. Freight movement is expected to grow by about 3 percent annually, nearly doubling by 2020.7 Passenger travel is expected to grow more slowly than in recent years, but it is nonetheless likely to grow more than 40 percent from 2000 to 2020.8
Although building new roadway capacity can help address some congestion issues, new construction to accommodate all of the demand is problematic in many urban areas. In some cases, available land is inadequate to build enough lanes to handle projected traffic volumes. In addition, new construction may not be accomplished without substantial harm to communities and environmental systems. In other cases, the mobility problem may stem from limited alternatives to driving.
In addition to new highway capacity, a wide range of transportation options are available that can improve mobility. Improvements in mobility can occur by managing the existing transportation system more efficiently to reduce traffic congestion, creating mode choices that enable travelers to reach their destinations without driving, or transferring of freight from trucks to rail or water. This section explores how these type of projects improve mobility.
Traffic management includes various means to improve traffic flow and reduce traffic delays. Traffic management improvements often rely on intelligent transportation systems (ITS), which use real-time, or near real-time, information about conditions on the roadway system, including data on traffic speeds, volume, incidents, and impacts of construction work zones. Strategies include use of advanced traffic signal-control systems, freeway management systems, incident management systems, electronic toll-collection systems, fleet management, data sharing, systems integration, and security/emergency management.
Advanced signal-control systems enable transportation agencies to respond appropriately to varying levels of highway traffic, through changes in signal timing and lane control and use of ramp meters, thereby making more efficient use of existing facilities. Freeway management systems detect problems with traffic flow and provide information to help transportation and public-safety agencies improve their coordination and response times. Real-time traffic information also can be shared with the public through variable message signs on highways, radio reports, telephone, the Internet, and in-vehicle systems to help drivers avoid congestion points. These systems have well documented benefits for traffic flow. Advanced traffic surveillance and signal-control systems have been demonstrated to reduce travel times from 8 to 25 percent. Freeway management systems, primarily through ramp metering, have reduced crashes by more than 24 percent while handling up to 22 percent more traffic at speeds significantly faster than pre-existing congested conditions.9
Incident management programs enable communities to identify and respond to crashes or breakdowns with the best and quickest type of emergency services, minimizing clean-up and medical response time. Traffic incidents cause an estimated 52 to 58 percent of total delay experienced by motorists in all urban areas.10 As a result, incident management programs, which involve clearing crashes more quickly and giving real-time information to motorists so they can avoid those areas, have the potential for substantial mobility benefits. In fact, data show that incident management programs can reduce delay associated with traffic incidents by 10 to 45 percent.11
Electronic toll collection provides drivers at toll facilities with convenient and reliable automated transactions. Typically, the driver purchases a transponder that automatically deducts the toll fare from the driver's account so the vehicle may not even need to slow down to pay a toll. These systems can dramatically improve traffic flow at toll plazas, increasing the capacity by 200 to 300 percent compared to attended lanes, while also increasing the operational efficiency of toll collecting.12
Together, these ITS components-advanced traffic control, freeway management, incident management, and electronic toll collection-are often integrated into regional traffic management systems, which help to maximize the performance and effective capacity of the existing transportation network. In addition to these large-scale efforts, traffic flow improvements are often undertaken in a wide range of communities and involve such smaller-scale improvements as signal synchronization along a corridor and traffic signals that respond to traffic conditions to ensure that traffic moves smoothly and is not impeded by unnecessary delay.
Transit services include buses, light rail, heavy rail, commuter rail, and ferry operations, as well as small buses and vans providing more customized service. Public transportation makes it possible for millions of people to access work, school, medical appointments and other everyday activities.
Transit serves a wide range of users and needs and is the primary transportation choice in many markets. Public transportation can be particularly efficient in urban areas where people live in greater concentrations and most of their daily travel needs can be satisfied by transit. The cost of driving, insuring, and parking a car can make it difficult for many people, particularly young workers, to access some job markets. Transit can provide an affordable, and for many people, necessary alternative to driving. For others, transit is used for convenience, as public transportation is often less stressful and can be faster than driving to work. Trips to school are the second most common use of public transportation, and many school-age and college students enjoy the access transit provides to education, shopping, and other opportunities. Without public transportation, many senior citizens would be unable to move around the community to visit friends, get groceries, or see the doctor.
Projects to expand the transit system, such as new bus and shuttle services, can increase mobility by providing new opportunities to reach more destinations. Transit system improvements, such as busways, bus priority systems, and rail projects, often can increase the speed of transit services, reducing travel time for passengers and attracting people who might otherwise drive.
Advanced transit technologies, which increase the reliability and ease of using transit, and customer amenities, such as benches and shelters, can help to increase the comfort associated with transit and attract customers. New ways of monitoring and maintaining transit fleets through advanced locating devices and equipmentmonitoring systems help improve the reliability of transit services. Real-time transit information systems provide access to better information about services. Electronic fare-payment systems, or smart cards, enable passengers to pay for parking, bus, and rail fares, and to easily transfer between transit systems using one smart card, rather than using exact change.
Nationally, over 14 million people use public transportation on a typical weekday.13 While this is a relatively small portion of total travelers, transit carries a much larger share of the load in urban areas during peak periods when roadways are at or near capacity. As a result, transit not only provides an important mobility option, but also helps meet peak-period travel demand and thus relieve some pressure on roadways in urban areas throughout the United States.
More than just getting people from place to place, transit provides access to new opportunities by fostering communities where people can drive less and walk more by providing greater access to community events, and by meeting the needs of all citizens. In many parts of the country, transitoriented development is an important part of local strategies to create more livable communities where people can take care of all their needs without driving.
High Occupancy Vehicle (HOV) lanes are for vehicles carrying a relatively high number of occupants, and usually serve carpools, vanpools, and transit vehicles. The quicker travel times afforded by these lanes can encourage drivers to switch from driving alone to ridesharing or transit, which helps to maximize the efficient use of capacity and can improve traffic flow in the general-use lanes. For those who must use congested travel routes, HOV lanes provide an option for a quicker ride when travelers join together to share the ride.
In addition to HOV lanes, other transportation improvement projects make it easier for people to take advantage of the benefits of ridesharing. Park-and-Ride facilities provide a convenient place for people to join others in a carpool or vanpool or take advantage of transit service. Rideshare matching services help individual travelers find other people to join for rides. These projects enable the road system to carry more people with fewer vehicles, thereby increasing the efficiency of the transportation network and reducing traffic congestion. They provide alternatives to driving alone, which can yield benefits, such as reducing parking and vehicle operating costs and reducing travel time if HOV facilities are available.
Bicycle and pedestrian projects enable people who wish to use non-motorized forms of transportation to get around more easily. In places such as college towns or in urban areas, bicycling and walking offer real alternatives to the use of the motor vehicle. Examples of bicycle and pedestrian projects include providing on-street bicycle lanes, off-street trails, and improved sidewalk connectivity. These projects tend to be one-time capital investments that generate multiyear benefits. Although they may not measurably decrease congestion levels, they do provide alternatives to driving and can open up access to non-drivers, including children, to access employment, schools, parks, libraries, and other facilities. Many communities are recognizing the importance of non-motorized transportation for improving mobility and community livability by developing bicycle and pedestrian plans and improving the connectivity of these routes.
Intermodal freight projects involve movement of goods from one transportation mode to another-for example, from truck to train or ship. Intermodal transport combines the door-to-door convenience of trucks with the long-haul economy of rail service or water transport. As a result, railroads, trucking companies, and intermodal marketing companies are forming productive partnerships to combine the best of multiple modes. Intermodal freight transport is growing rapidly, with nearly a tripling in trailer and container traffic on railroads over the period 1980 to 2001-from 3.1 million trailers and containers in 1980 to nearly 9.0 million in 2001.14
Because the highway system is heavily congested, transferring trailers and containers to rail and waterways helps to move goods in an efficient manner and to use these networks more efficiently. Based on a corridor study conducted by the Federal Highway Administration (FHWA), it is estimated that for every 10 containers carried on intermodal rail, a minimum of 7 trucks are taken off the highways.15 A single intermodal train can take as many as 280 trucks off the highways.16 In addition to helping reduce traffic on the Nation's heavily congested highway network, transferring goods from highways to rail and port also helps to improve roadway safety, reduce the rate of highway pavement deterioration and the costs of highway maintenance, and reduce fuel use and air pollutant emissions.
Freight projects that can improve the movement of goods across modes include the development of intermodal facilities, track improvements, new parking and container storage facilities, and freight control centers.
The CMAQ program is a funding source for transportation projects that enhance air quality and ease traffic congestion. Although the primary goal of the CMAQ program is to fund transportation projects that improve air quality, many of the projects also help to reduce traffic congestion and increase mobility options. The CMAQ program funds all of the types of projects discussed previously that improve mobility: traffic flow improvements, transit services, HOV lanes and other shared-ride services, intermodal projects, and bicycle and pedestrian projects, among others.
Although CMAQ projects are not the whole solution, they can help to address mobility needs by enhancing the overall efficiency of the surface transportation network. They can provide system enhancements and new services where road capacity is constrained. New road capacity may in places also be needed to meet growing travel demand, and these different approaches can be complementary to wrestle with growing levels of congestion and frustration. From a system-wide perspective, it is important to note that individual projects will not likely "solve" all of a region's congestion problems, but they can have a measurable effect in specific corridors and places where funding is focused. This impact can be of extreme importance to businesses and activity centers, ports and airports, and residents facing localized congestion on a daily basis.
The CMAQ Program was established under the Intermodal Surface Transportation Efficiency Act (ISTEA) of 1991 as a funding source for transportation projects and programs that help support the goals of the 1990 Clean Air Act Amendments. The program was authorized for a 6-year period at $6 billion. The program was reauthorized under the Transportation Equity Act for the 21st Century (TEA-21) in 1997 with funding of $8.1 billion for the 6 years of the Act, 1998-2003.
In the context of the Federal-aid Highway Program, CMAQ is but a small piece of the funding available to States for transportationimprovement projects. For example, the Surface Transportation Program (STP), which provides flexible funding for transit as well as highway projects, was authorized at $33.3 billion during the life of TEA-21. The National Highway System (NHS) program, which funds projects involving highways of national significance, was funded at $28.6 billion during the same period.
In the context of total available funding, CMAQ makes a small but targeted contribution toward addressing air quality and mobility issues. For example, all levels of government together spent more than $116 billion on highway and transit programs in 1999. CMAQ funding available to the States in that year was only about $1.3 billion, or about 1 percent of total transportation spending. Even a single major transportation infrastructure project can cost well over $1 billion, exceeding total national CMAQ funding for a year.
Although the CMAQ program is modest relative to any given region's transportation budget, the funds often are used in innovative ways to support transportation options and reduce traffic congestion. CMAQ funding is apportioned to States based on a legislative formula that takes into account the population in areas that do not meet air quality standards and the severity of regional air quality problems. States may use CMAQ funds for a variety of transportationrelated measures and programs designed to help meet the national ambient air quality standards (NAAQS) for carbon monoxide, ozone, and particulate matter.
An innovative feature of the CMAQ program is the flexibility it provides for eligible projects and programs. Selection of CMAQ projects is made at the State and local level but is subject to broad Federal guidelines on project eligibility. The main eligibility criterion is air quality improvement; however, increased mobility is a direct benefit of reduced congestion and mobilityimprovement projects often yield emission benefits, as well.
Although CMAQ funds are designed to help metropolitan areas attain the NAAQS, hundreds of communities are using the program to promote mobility and air quality improvement. Projects range from constructing a small pedestrian connection to designing a regional bicycle network, building an HOV lane, and developing a regional system for congestion management. These projects not only promote air quality improvement, but also help to meet community and regional mobility needs by increasing transportation options, helping travelers avoid congestion, and encouraging a more efficient transportation system.
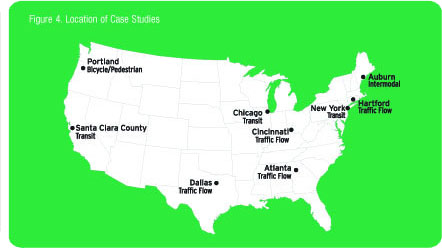
This report documents nine projects, funded in part by the CMAQ program, that are helping to enhance mobility. Figure 4 shows the locations of the projects. They represent just a sample of the hundreds of ideas and initiatives that communities are using to enhance mobility through the CMAQ program.
1 U.S. Department of Transportation, Federal Highway Administration. Highway Statistics 2000. Table VM-1, Vehicle miles of travel and related data, by highway category and vehicle type. Washington, DC: U.S. Government Printing Office.
2 U.S. Department of Transportation, Federal Transit Administration. National Transit Database, 2000: National Transit Summaries and Trends. On-line at: www.fta.dot.gov/ntl/database.cfml.
3 U.S. Department of Transportation and U.S. Department of Commerce. 1997 Commodity Flow Survey. 1997 Economic Census (Issued December 1999). Table 1a. Shipment Characteristics by Mode of Transportation for the United States: 1997.
4 U.S. Department of Transportation, Federal Highway Administration. Highway Statistics (annual series, 1990 to 2000). On-line at: www.fhwa.dot.gov/policy/ohpi/hss/index.cfm. U.S. Census Bureau. Census 2000: Resident Population. Table 4. On-line at: www.census.gov/population/cen2000/tab04.pdf.
5 Texas Transportation Institute. 2002 Urban Mobility Study. On-line at: mobility.tamu.edu/ums/.
6 U.S. Department of Transportation, Federal Highway Administration. Highway Statistics, Summary to 1995. Table VM-20 and HM-260; Highway Statistics (annual editions, 1996-2000), Table VM-3 and HM-48. On-line at:www.fhwa.dot.gov/policy/ohpi/hss/index.cfm.
7 U.S. Department of Transportation, Federal Highway Administration. The Freight Analysis Framework: Basic Presentation. May 2001. On-line at: www.ops.fhwa.dot.gov/freight/adfrmwrk/index.cfm.
8 Federal Highway Administration and Federal Transit Administration. 1999 Status of the Nation's Highways, Bridges, and Transit: Conditions and Performance Report. May 2, 2000.
9 Thirteen to 48 percent faster according to the Federal Highway Administration's ITS Joint Program Office. Metropolitan ITS Brochure.On-line at: www.its.dot.gov/TravelManagement/metro_its_brochure.cfm. Also, see: Federal Highway Administration. Intelligent Transportation Systems Benefits: 2001 Update. Prepared by Mitretek Systems. June 2001.
10 Texas Transportation Institute. 2002 Urban Mobility Report. On-line at: http://mobility.tamu.edu/ums/.
11 Federal Highway Administration, ITS Joint Program Office. Metropolitan ITS Brochure. On-line at: www.its.dot.gov/TravelManagement/metro_its_brochure.cfm. Also, see: Federal Highway Administration. Intelligent Transportation Systems Benefits: 2001 Update. Prepared by Mitretek Systems. June 2001.
12 Federal Highway Administration, ITS Joint Program Office. Metropolitan ITS Brochure. On-line at: www.its.dot.gov/TravelManagement/metro_its_brochure.cfm. Also, see: Federal Highway Administration. Intelligent Transportation Systems Benefits: 2001 Update. Prepared by Mitretek Systems. June 2001.
13 American Public Transportation Association. Public Transportation Fact Book: Fiscal Year 2000 Data. On-line at: www.apta.com/.
14 Association of American Railroads. Railroad Facts. On-line at: www.aar.org/.
15 Federal Highway Administration, Office of Policy Development (prepared by Volpe National Transportation Systems Center). Implications of Intermodal Freight Movements for Infrastructure Access, Capacity, and Productivity. Washington, DC: Federal Highway Administration, March 1996.
16 Association of American Railroads. Intermodal Transport. RR Industry Info Background Paper. On-line at: www.aar.org/.