
Transmission loss in a given structure is a property which is frequency dependent. Therefore, evaluation of transmission loss of walls requires analysis of noise levels in each of eight octave bands, or 16 one-third octave bands, covering a frequency range from 125 Hz to 4000 Hz. Performance of the necessary noise measurements for every wall in every building constructed would prove to be a costly and time-consuming procedure. As an effective alternative, spectral data can be weighted (e.g., using an A-weighted filter) in order to obtain a single-number rating which, in turn, may be cataloged as a function of wall design and composition.
The most common single-number rating for the transmission loss of walls is the Sound Transmission Class (STC). This method utilizes a standard contour to which the transmission loss values in 16 one-third octave bands are compared. Use of the STC rating, however, is limited to interior wall structures. While there have been some efforts in the past to extend STC to evaluate exterior walls, no precise methodology has been developed.
A new single-number rating system, termed the Exterior Wall Noise Rating (EWNR), has been chosen for use in this manual. The rationale behind the development of the EWNR, and the evaluation of this and other exterior wall single-number rating schemes, is presented here.
Development of the EWNR rating is based on the rationale that the interior noise spectrum should take on the characteristics of a 40 dB equal loudness contour which is an inverse A-weighted response curve. Knowing this, the transmission loss characteristics of an exterior wall may be evaluated if the exterior noise spectrum is identified.
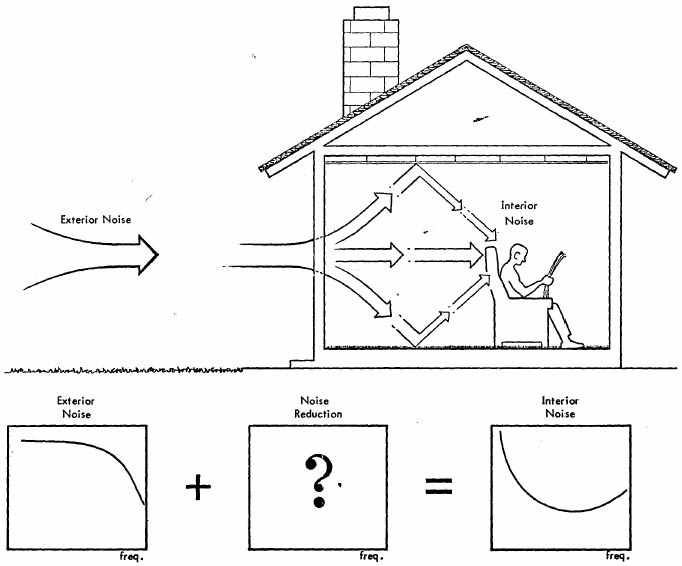
The problem is conceptualized in Figure 21. Consider, for the moment, that the exterior noise spectrum exhibits a shape similar to that shown in the figure. As will be discussed, this in fact is the nominal average spectrum for typical highway noise. It follows, then, that the transmission loss characteristic of the wall must act as a shaping "filter" to the prescribed exterior noise spectrum so as to produce an interior noise spectrum similar in shape to the inverse A-weighted response curve.
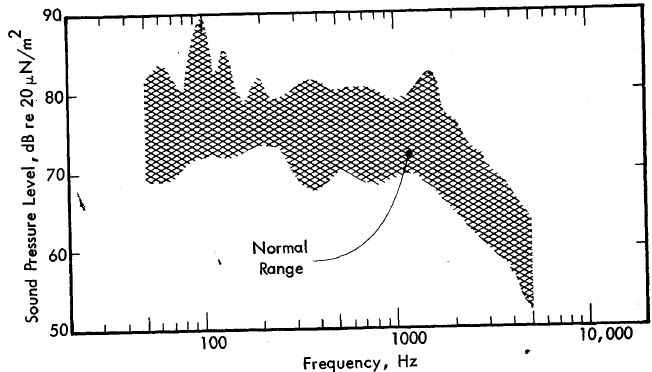
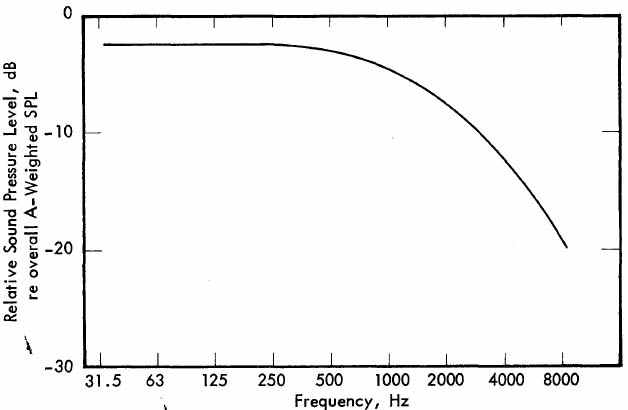
To identify the precise shape of this special transmission loss curve, an assumption must be made as to the frequency characteristics of the exterior noise level. For this study, exterior noise will be that generated by highway traffic. Figure 22 presents the typical range of highway spectra averaged over a 24-hour period for a single location near a heavily-traveled freeway. Using this data, the nominal average spectrum for highway noise was calculated, with the results illustrated in Figure 23. Note that the octave band levels are relative to the equivalent noise level, Leq, in dBA.
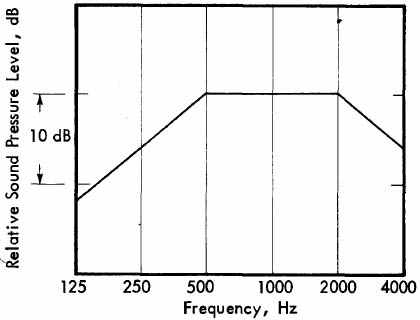
Knowing the characteristics of the exterior noise spectrum, the shape of the special transmission loss curve was evaluated, resulting in the curve shown in Figure 24. This contour is then utilized in a manner similar to the STC curve in that it is adjusted vertically to the highest position relative to the TL curve where the sum of the one-third octave band deficiencies (that is, deviations below the contour) is 32 or less. The Exterior Wall Noise Rating (EWNR) is then the value of the standard curve at 500 Hz minus a constant value of 4 dB. The rationale for this constant is discussed fully in the section on Evaluation of Single-Number Rating Schemes.
The EWNR values were developed assuming an incident noise frequency spectrum similar to that of typical highway noise. Therefore, the spectral shape of the EWNR Standard Contour, and hence the actual EWNR values, were determined by this highway noise spectrum. To use the given EWNR values in the prediction of building attenuation of aircraft noise, which presents a different frequency spectrum, a constant of 6 dB, rather than 4, must be subtracted from graphically determined EWNR values.
EWNR for Composite WallsWhen a window or door is part of an exterior wall, the transmission loss rating of the composite wall must be determined. Standard procedure entails calculating the composite transmission loss in each one-third octave band, from which a single-number rating such as EWNR may then be determined from this transmission loss curve. However, the results of sample calculations indicate that a composite transmission loss value may be determined with little error by taking the EWNR of all the wall elements and combining them independently of frequency by the following ratio:
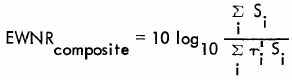
where  ¹i. is the transmission coefficient corresponding to the EWNR of the ith element of area S. This, in fact, is the procedure followed in this manual.
Numerous single-number rating schemes were evaluated here as potential methods for characterizing the transmission loss of exterior walls. Initial analyses focused on 11 individual rating schemes, including:
Exterior Wall Noise Rating (EWNR). Applied in a manner analogous to that described previously.
Speech Interference Level Transmission Loss (SILTL). The SILTL is the arithmetic average of the one-third octave band transmission loss values in the speech interference frequency range (400 Hz to 2500 Hz).
Average Transmission Loss (AVETL). The AVETL is the arithmetic average of the 16 one-third octave band transmission loss values.
Sound Transmission Class (STC). The STC method uses a standard contour against which the transmission loss values in 16 one-third octave bands are compared in the frequency range between 125 Hz and 4000 Hz. The standard contour is shifted vertically relative to the test curve until (1) the sum of the deficiencies does not exceed 32 dB, and (2) the maximum deficiency at a single test point does not exceed 8 dB. The STC rating is then the transmission loss value at the intersection of the contour and the 500 Hz ordinate.
Modified STC Ratings. These ratings are similar to J5TC, but the standard STC curve is replaced with a curve with positive slope rising at a rate of 0, 1, 2, 3, 4, 5 and 6 dB per octave, indicated in Table 22 as Mod 0 through Mod 6. These standard curves are adjusted vertically to the highest position where the sum of the one- third octave band deficiencies is 32 dB or less. The rating is then the value of the standard curve at 500 Hz.
| Single Number Rating | Correlation Coefficients | 90% Confidence Intervals, dB |
|---|---|---|
| STC | 0.962 | ±2.7 |
| SILTL | 0.960 | ±2.8 |
| AVETL | 0.981 | ±1.9 |
| Mod 0 | 0.978 | ±2.1 |
| Mod 1 | 0.987 | ±1.7 |
| Mod 2 | 0.988 | ±1.5 |
| Mod 3 | 0.985 | ±f.8 |
| Mod 4 | 0.975 | ±2.2 |
| Mod 5 | 0.956 | ±2.9 |
| Mod 6 | 0.927 | ±3.8 |
| EWNR | 0.998 | ±0.6 |
The most important criteria for a single number scheme is that it should give sufficient accuracy in calculating the interior A-weighted noise level for a variety of wall structures. A high speed digital computer was utilized to evaluate and rank the 11 single number ratings listed in Table 22. The computer utilized combinations of TL input data for walls and windows of various sizes for a total of more than 20,000 scenarios for each exterior spectrum.
For each scenario, one-third octave band composite transmission loss values were calculated for each wall-window configuration. These TL values were subtracted from exterior levels to obtain the interior one-third octave band noise levels. The interior octave band levels were A-weighted to obtain the actual interior A-weighted noise level.
Each of the 11 single number wall ratings was then subtracted from the exterior A-weighted noise level to obtain an approximation of the interior level based on single-number calculations. A linear regression analysis was carried out for the actual A-weighted noise level and each of the single number approximations using all of the scenarios. The standard error was then calculated for each of the single number wall ratings. As shown in Table 22, the EWNR concept is the most accurate single number prediction scheme of the 11 analyzed.
The Y-intercept from the regression analysis of the EWNR scheme had a value of 4 dB for highway noise (6 dB for aircraft noise). This represented a constant difference between the A-weighted structure attenuation predicted by the EWNR scheme and the actual attenuation as calculated using one-third octave bands. This constant value of 4 has been incorporated into all data tabulated in this manual, and thus the tabulated EWNR values may be applied directly to predict the attenuation of highway noise. However, 4 dB must be subtracted from the value of the EWNR contour at 500 Hz when determining EWNR values by graphical means from TL data.
Additional analyses of single number rating schemes were then conducted utilizing various other highway noise spectra. Based on the preceding evaluation, the five most feasible rating schemes were selected for further analysis: EWNR, STC, Mod 0, Mod 3, and SILTL. The extended evaluation of these rating schemes centered on the utilization of two additional highway noise spectra based upon octave band data identified as TSC and NCHRP 78 data. Each of these spectra were considered in-light-of both a one and five percent truck mix, thereby resulting in four highway noise spectra test cases.
Commonly-used wall constructions were again combined with various window types in area ratios of 20, 15, 10 and 0 percent. A total of 192 different wall constructions and 16 windows were used in this analysis. Linear regression analyses were conducted for each test case to compare the accuracy of the single number rating schemes against A-weighted interior noise levels as calculated from the frequency-dependent data. The tabulated 90 percent confidence intervals are shown here in Table 23. For all four highway noise spectra, the EWNR provided the most accurate single number rating of transmission loss values. The EWNR was therefore selected for use in this manual.
| Single Number Rating | TSC | NCHRP 78 | ||
|---|---|---|---|---|
| 1 Percent Trucks | 5 Percent Trucks | 1 Percent Trucks | 5 Percent Trucks | |
| EWNRM | ±0.9 | ±0.9 | ±1.1 | ±1.1 |
| Mod 0 | ±2.3 | ±2.3 | ±1.6 | ±1.5 |
| Mod 3 | ±1.2 | ±1.2 | ±1.4 | ±1.4 |
| STC | ±2.1 | ±2.0 | ±2.6 | ±2.6 |
| SILTL | ±4.2 | ±4.1 | ±4.8 | ±4.8 |
Identification of EWNR Adjustment Factors
To facilitate the calculation of EWNR values for commonly-used wall constructions, a computer algorithm was devised and implemented based upon the 21 theory of ideal transmission loss for structures. However, so as to more accurately predict the transmission loss characteristics of a wall under actual field test conditions, the algorithm must be extended to account for cavity absorption as well as other anomalies due to leaks, gaps, or flanking paths.
For wall constructions, absorption in the wall cavities was included in the calculations for both the stud construction and the furred interior surface. To account for this, a 4 dB absorption factor was subtracted from each stud wall EWNR, while a 3 dB factor was subtracted for furred wall values, to arrive at the Basic Wall EWNR values tabulated in the manual.
The calculated EWNR values relate to ideal walls which might be tested under laboratory conditions; that is, with no leaks, gaps or flanking paths existent. However, the EWNR value for a wall built under field conditions will be, on the average, 4 dB lower than laboratory values. Therefore, this correction factor has been subtracted in determining the EWNR values for Basic Wall constructions.
Similar corrections to the EWNR values for roof-ceiling constructions must be introduced. For the single joist construction, the computer algorithm for calculating EWNR values assumed absorption to exist in the joist space. For attic space construction, a reverberant field was assumed to exist in the attic space, with no additional absorption considered. Determination of EWNR values for roof-ceiling systems as found in the field requires, in all cases, subtraction of 4 dB to account for inefficiencies due to leaks, gaps and flanking paths. Further, 5 dB must additionally be subtracted from EWNR algorithm values for single joist construction with no absorption in the joist space. These adjustments have been included in the tabulated data or manual procedures.
With appropriate consideration given to each of the above correction factors, EWNR values for basic constructions were calculated and compiled, and appear in the manual. Those correction factors which apply universally to all constructions have been accounted for in Tables 1 and 3 of the text, while those factors whose application is case-specific have been compiled for appropriate application within the manual.

