

MCL Project Reports
LTPP Impact-Echo Thickness Determinations I-10, Maricopa County, Arizona 0207 AZ
Summary Report December 2002
This report summarizes the results of a nondestructive test (NDT) verification program conducted by Federal Highway Administration's (FHWA) Mobile Concrete Laboratory (MCL) staff on I-10 west of Phoenix, Arizona, at the request of Aramis Lopez with FHWA's Long Term Pavement Performance Program (LTPP). The objective of this test program was to determine if the Impact-Echo technique (IE) can be efficiently used to non-destructively characterize the concrete pavement thickness for LTPP's Specific Pavement Study (SPS) sections on a routine basis. LTPP is interested in the thickness to "calibrate" FWD results gathered on a regular basis (i.e. is a variation in the FWD data associated with a variation in the strength/support/etc., or is it associated with a variation in pavement thickness). Since SPS sections cannot be cored, LTPP needs a nondestructive means to determine the thickness. Based upon a presentation made on nondestructive test methods at the FHWA Technology Workshop in St Louis, MO in August, 2002, LTPP personnel wanted to examine whether IE was a suitable means to establish this required pavement thickness nondestructively.
Testing: During late November, 2002, Gary Crawford (FHWA/MCL), Gonzalo Rada (Mactec/LTPP), Jack Springer (FHWA/LTPP) and Leif Wathne (SaLUT/MCL) devised and agreed upon a test plan where each of 12 separate SPS-2 test sections would have 10 panels tested, with two IE thickness tests per slab (at mid-slab, 1.2 meters from edge and .2 meters from edge). SPS-2 sections were originally constructed to examine the effectiveness of different structural factors, such as drainage, concrete thickness, base type, concrete flexural strength, and lane width of doweled jointed plain concrete pavement (JPCP) sections, for various climatic regions, subgrade soils, and traffic rates. The test sections are located on eastbound I-10 west of Phoenix, near milepost 104. The majority of thickness testing was performed using a Concrete Thickness Gauge (Olson Instruments, CTG-1). This is an IE device tailored specifically for slab thickness testing. Wave speed "calibrations" were performed on the approach slab to each test section, where cores have already been extracted for thickness determination. Another IE device (from Physical Acoustics) was also used in some of the locations for verification, and to periodically establish surface wave speeds for comparison to through-speeds determined using the CTG-1. A total of 257 tests were performed. Each test was actually performed at least twice, using two identical CTG-1 units to verify the integrity of the signal and to check repeatability. IE testing took place on December 3, 4, and 5, 2002. The testing was documented with photographs, and test results were recorded on-site by Gonzalo Rada. Figures1 and 2 show IE testing (using the CTG-1) in progress.
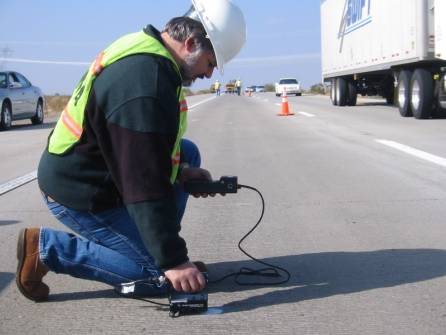
Figure 1. CTG-1 testing in progress.
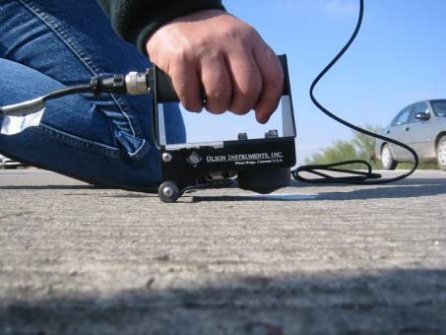
Figure 2. Close up of impactor/transducer unit.
Results: Results were analyzed by comparing the IE thicknesses to rod-and-level (RL) measurements taken during construction. The IE measurements for each test section is presented in appendix A, and the available RL data is presented in appendix B. Table 1 summarizes all the measured data. Comparisons could only be made for eleven (11) of the twelve (12) sections due to the absence of RL measurements for section 040214. It should be emphasized that any conclusions based upon results from comparisons with RL data is predicated on the assumptions that the RL measurements are made at the same location IE tests were performed, and that the RL measurements are accurate. Typically, RL surveys are only accurate to within 3mm.
| SECTION | MEASUREMENT | AVG THICKNESS (mm) |
THICKNESS DIFFERENCE (mm) |
STANDARD DEVIATION (mm) |
|---|---|---|---|---|
| 213 8" PCC, 6" AB, 550 psi, 14' lane Wave speed 3942 m/s |
Approach Slab Cores | 192.4 | 2.4 | |
| Rod & Level Section | 203.6 | + 2.1 | 6.7 | |
| I-E overall Section | 201.5 | 5.1 | ||
| 215 11" PCC, 6" AB, 550 psi, 12' lane Wave speed 3915 m/s |
Approach Slab Cores | 282.6 | 6.4 | |
| Rod & Level Section | 287.3 | + 15.8 | 6.2 | |
| I-E overall Section | 271.5 | 5.3 | ||
| 216 11" PCC, 6" AB, 900 psi, 14' lane Wave speed 3975 m/s |
Approach Slab Cores | 286.4 | 4.3 | |
| Rod & Level Section | 283.1 | + 9.3 | 4.4 | |
| I-E overall Section | 273.8 | 7.9 | ||
| 217 8" PCC, 6" LCB, 550 psi, 14' lane Wave speed 4113 m/s |
Approach Slab Cores | 201.3 | 7.3 | |
| Rod & Level Section | 208.4 | + 1.1 | 7.6 | |
| I-E overall Section | 207.3 | 7.0 | ||
| 218 8" PCC, 6" LCB, 900 psi, 12' lane Wave speed 4220 m/s |
Approach Slab Cores | 207.6 | 1.3 | |
| Rod & Level Section | 213.1 | + 10.5 | 4.4 | |
| I-E overall Section | 202.6 | 4.1 | ||
| 219 11" PCC, 6" LCB, 550 psi, 12' lane Wave speed 4229 m/s |
Approach Slab Cores | 268.6 | 5.6 | |
| Rod & Level Section | 278.6 | + 1.5 | 6.2 | |
| I-E overall Section | 277.1 | 6.0 | ||
| 220 11" PCC, 6" LCB, 900 psi, 14' lane Wave speed 4336 m/s |
Approach Slab Cores | 287.9 | 2.9 | |
| Rod & Level Section | 291.7 | + 11 | 8.6 | |
| I-E overall Section | 280.7 | 6.0 | ||
| 221 8" PCC, 4" PBTB, 4" AB, 550 psi, 14' ln Wave speed 3665 m/s |
Approach Slab Cores | 222.3 | 1.1 | |
| Rod & Level Section | 197.0 | - 5.6 | 6.7 | |
| I-E overall Section | 202.6 | 6.7 | ||
| 222 8" PCC, 4" PBTB, 4" AB, 900 psi, 12' ln Wave speed 3851 m/s |
Approach Slab Cores | 213.4 | 5.1 | |
| Rod & Level Section | 216.9 | + 10.9 | 8.6 | |
| I-E overall Section | 206.0 | 6.6 | ||
| 223 11" PCC, 4" PBTB, 4" AB, 500 psi, 12' l Wave speed 3609 m/s |
Approach Slab Cores | 289.6 | 10.8 | |
| Rod & Level Section | 278.7 | + 21.5 | 7.9 | |
| I-E overall Section | 257.2 | 6.2 | ||
| 224 11" PCC, 4" PBTB, 4" AB, 900 psi, 14' l Wave speed 3774 m/s |
Approach Slab Cores | 272.4 | 8.1 | |
| Rod & Level Section | 269.8 | + 9.8 | 7.7 | |
| I-E overall Section | 260.0 | 7.1 |
The data was analyzed using paired t-test analyses to compare the two techniques in terms of measured pavement thickness. If the two techniques are measuring the same thing, the mean difference in measurements should be zero. Unfortunately, the analyses were complicated by the fact that the data does not consist of true pairs, since the IE measurements were not performed at the exact same locations as the existing RL measurements. Only 21 of the 257 IE measurements were made in proximity to the RL measurement locations (within about 2 meters). Based on the paired t-test analysis of these 21 pairs at a 0.05 level of significance (a=0.05), it is clear that the true average difference in measured thickness is not zero (i.e. the techniques are on average not measuring the same thing). Figure 3 shows the data set and analysis results. Further paired t-test analyses of this same set of data (with different alternate hypotheses) suggest that the IE method underpredicts the pavement thickness (as determined by the RL method) by anywhere from 6 to 16 mm, at a level of significance of 0.05. This apparent bias is difficult to account for and may be coincidental.
| Section | Station(m) | Offset(m) | RL(mm) | IE(mm) | Q | Diff.(mm) |
|---|---|---|---|---|---|---|
| 213 | 120 | 0.15 | 213 | 203 | 4 | 10 |
| 2.15 | 201 | 198 | 5 | 3 | ||
| 214 | 115 | 0.15 | 185 | 4 | ||
| 1.8 | 187 | 6 | ||||
| 215 | 120 | 0.15 | 287 | 272 | 7 | 15 |
| 1.8 | 284 | 268 | 3 | 16 | ||
| 216 | 120 | 0.15 | 279 | 279 | 3 | 0 |
| 2.15 | 279 | 286 | 7 | -7 | ||
| 217 | 120 | 0.15 | 218 | 191 | 4 | 27 |
| 2.15 | 213 | 212 | 8 | 1 | ||
| 218 | 120 | 0.15 | 208 | 208 | 5 | 0 |
| 1.8 | 211 | 204 | 8 | 7 | ||
| 219 | 120 | 0.15 | 287 | 276 | 4 | 11 |
| 1.8 | 284 | 267 | 4 | 17 | ||
| 220 | 120 | 0.15 | 287 | 297 | 4 | -10 |
| 2.15 | 290 | 283 | 6 | 7 | ||
| 221 | 120 | 0.15 | 203 | 206 | 4 | -3 |
| 2.15 | 203 | 0 | ||||
| 222 | 115 | 0.15 | 231 | 212 | 3 | 19 |
| 1.8 | 231 | 208 | 3 | 23 | ||
| 223 | 120 | 0.15 | 287 | 253 | 7 | 34 |
| 1.8 | 287 | 250 | 3 | 37 | ||
| 224 | 120 | 0.15 | 277 | 265 | 7 | 12 |
| 2.15 | 269 | 255 | 3 | 14 | ||
| Avg | 251.318 | 237.609 | 11.0952 | |||
| St Dev | 36.5662 | 37.5327 | 12.5615 | |||
Paired t-test, a = 0.05
Ho: uD = 0 versus Ha: uD<>0
t = (avg diff) / ((st dev of diff) / Sqrt(n))
t = (11.095) / ((12.561) / Sqrt(21))
t = 4.047677291
rejected if t ≥ ta/2, n-1 OR t ≤ -ta/2,n-1
from tables, t.025, 20 = 2.086
Since t > t.025, 20 (4.04 > 2.09), Ho is rejected
I.e. The true average difference is not zero.
Conclusions: Based upon the analyses of the SPS-2 data, it appears that IE is not a suitable means to estimate the pavement thickness for LTPP's SPS sections within the 5mm desired accuracy. The primary reason for this is most likely related to the distressed condition of the subject pavement sections during testing. Although successful use of IE for pavement thickness determinations (with high degrees of accuracy) has been documented on recently constructed and sound concrete pavements, the subject tests were performed on older, distressed concrete pavements. The majority of these SPS-2 pavement sections were visually distressed with evidence of map cracking and some transverse and longitudinal cracking. Figure 4 shows an example of typical distress. As the IE method relies on an assumed "wave-speed" (previously measured on the approach-slab) to determine thickness, it is imperative that this wave-speed does not change appreciably from location to location within a section. This is a valid assumption for sound concrete with no signs of distress. However, if significant distress is present, the wave speed will vary as a consequence. If the wave speed varies by 10%, for example, the resulting thickness measurement will be off by 10% as well. Consequently, since the subject SPS-2 sections exhibit sporadic signs of significant distress, a representative wave speed is impossible to determine, and the IE thickness measurements will be inaccurate.
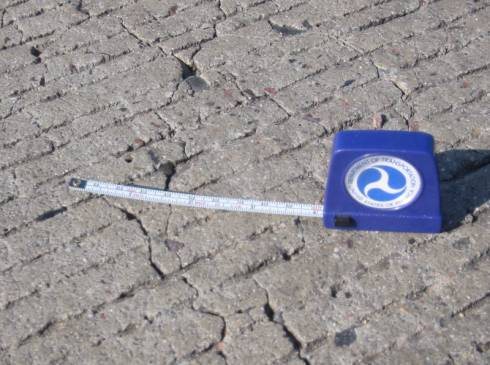
Figure 4. Example of pavement distress
Further Work: Although the data indicates that IE is not suitable for characterizing thickness of damaged and distressed pavements, the analyses are based on two assumptions that may be false: 1) The RL measurements are representative of the pavement thickness, and 2) The pavement thickness does not change significantly within the area of each pair of measurements. The former may be false, as we have no actual documentation about the accuracy of the RL measurements. The latter assumption may not be valid either, since the several cores within each test section's approach slab differ in length from one another anywhere from 3 to 26 mm (see appendix B). Since these cores were retrieved from within 2 meters of one another, it appears that the pavement thickness can vary significantly within a small area. Consequently, in order to make a valid assessment of the applicability of IE to measure thickness of distressed pavements, we would have to compare known pavement thicknesses (established either through coring, detailed RL, dipstick, etc) to IE measurements. Only then can we with a high degree of certainty establish whether IE technique is a good tool for characterizing the concrete pavement thickness of LTPP's SPS sections.