U.S. Department of Transportation
Federal Highway Administration
1200 New Jersey Avenue, SE
Washington, DC 20590
202-366-4000
Moving FoRRRwD to Reduce Rural Roadway Departures
States STEP Up to Enhance Pedestrian Safety
Using Data to Improve Traffic Incident Management
States Make Innovation Everyday Practice
EDC-4 Success Stories: States Report Innovation Deployment Progress
At Innovator, we're all about keeping you on the cutting edge of the highway industry. That means Innovator itself must continue to evolve. Starting with the November/December issue, Innovator will be on a new web platform that is accessible from any device.
Until the official launch, we invite you to have a sneak peek with the current issue! Click here to view Innovator in the new platform.
Comments? Questions? We'd love your feedback! Drop us a line and let us know what you think.

Credit: FHWA
Rural roadway departures make up a third of U.S. traffic fatalities—about 30 people a day. The Every Day Counts round five (EDC-5) initiative on reducing rural roadway departures features strategies to keep vehicles in their travel lanes, lower the potential for crashes, lessen the severity of crashes that do occur—and save lives.
"Roadway departures are not just run-off-the-road crashes, but any crash in which a vehicle crosses an edge line or center line or otherwise leaves the traveled way," said Cathy Satterfield, Federal Highway Administration roadway safety engineer and EDC-5 team co-leader.
About half of rural roadway departure fatalities occur on locally owned roads, so what the team calls its "focus on reducing rural roadway departures," or FoRRRwD, involves working with both local and State transportation agencies. The team encourages agencies to use a systemic approach to identify safety improvement locations, deploy proven countermeasures, and develop safety action plans.
Thirty-two State Transportation Innovation Councils set goals to move FoRRRwD in EDC-5 by demonstrating, assessing, or using systemic application of safety countermeasures on rural roads as a standard practice.
"Rural roadway departure crash locations can be random, but fatal crash types tend to be predictable," said Dick Albin, FHWA roadway safety engineer and EDC-5 team co-leader. "We can have the greatest impact by identifying roadway features connected with fatal and severe injury crashes and implementing countermeasures to address those features across the system."
This systemic approach identifies safety improvements based on high-risk roadway features that correlate with particular severe crash types rather than solely on crash data. Three-quarters of rural roadway departure fatalities involve vehicle rollovers, head-on crashes, or collisions with trees.
At a national level, risk factors in these types of crashes include curves and speeds of more than 50 miles an hour. "When agencies look at these crashes based on their own roadway data, we expect they will find more specific risk factors, such as traffic volume ranges or a curve radius," said Albin.
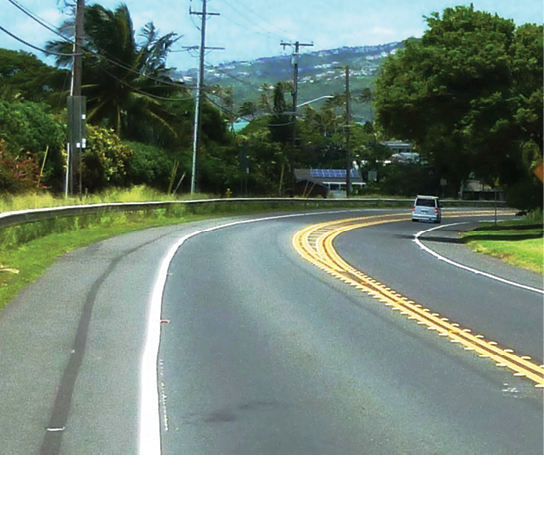
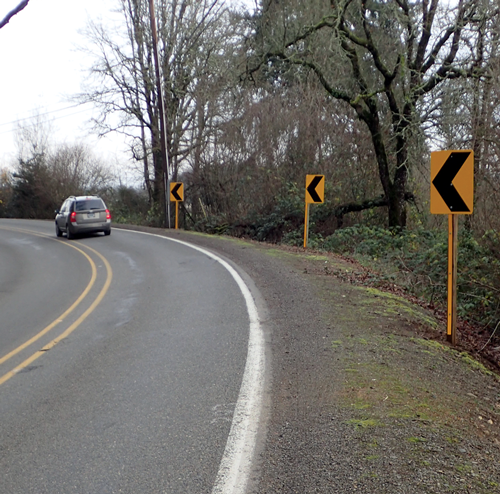
Roadway departure countermeasures applied at this curve include wider lane separation to prevent head-on collisions in the curve, raised pavement markers, widened shoulders, and a guardrail. Credit: FHWA
The EDC-5 team provides training and technical assistance to help agencies find ways to more effectively use a variety of countermeasures to reduce rural roadway departures:
Safety action plans help agencies prioritize the locations and countermeasures that will reduce rural roadway departures most effectively. In Washington, 35 of the State's 39 counties completed local road safety plans (LRSPs) to identify priorities for Highway Safety Improvement Program funding.
"The plans made it easier for the Washington State Department of Transportation to support funding requests made by the counties," said Scott Davis, Thurston County traffic engineering and operations manager.
Thurston County, where about two-thirds of the roads are in rural areas, used FHWA's Systemic Safety Project Selection Tool to determine risk factors and prioritize rural safety investments. "The tool allowed us to go from a reactive to proactive approach, from events-based to risk-based, so we can address problems before a crash can happen," said Davis.
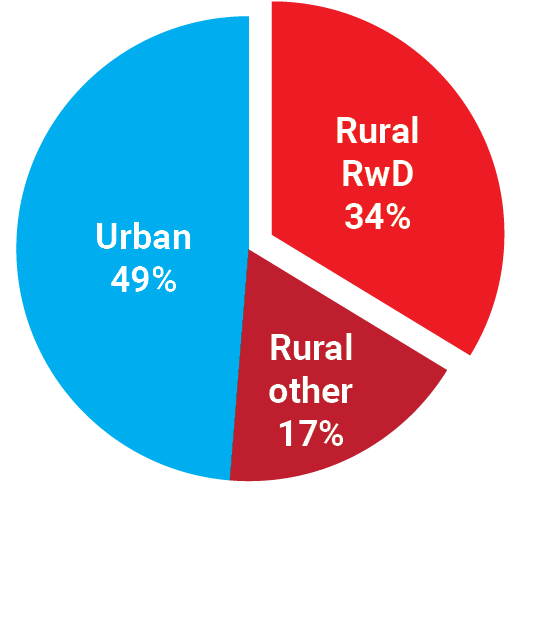
Rural roadway departures account for about a third of all U.S. traffic fatalities. Credit: National Highway Traffic Safety Administration
One area of concern targeted in Thurston County's LRSP was curves, where 45 percent of fatal and serious injury crashes occurred from 2006 to 2010. Over several years, the county implemented countermeasures at curves such as enhanced signage, raised pavement markers, rumble strips, and guardrail delineation. As a result, 2012 to 2016 crash data showed a 35 percent reduction in fatal and serious injury crashes at curves.
"Now that we have performance results, it is easier to communicate to our executives and elected officials about our safety programs," Davis said. "It helps build support for future funding."

Crosswalk visibility enhancements such as high-visibility markings and in-street signs improve pedestrian safety.
Pedestrian fatalities have surged 35 percent since 2008, while all other traffic deaths have decreased 6 percent. "This is why it's more important than ever for transportation professionals to design roads and bridges for all people, not just those who drive," said Wayne Emington, safety and operations engineer in the Federal Highway Administration Maine Division.
The Every Day Counts round five (EDC-5) initiative on safe transportation for every pedestrian (STEP) focuses on this national safety problem by promoting cost-effective countermeasures. "We like to call them our 'Spectacular Seven'," said Becky Crowe, FHWA transportation specialist and STEP team co-leader. "Countermeasures in the toolbox include rectangular rapid flashing beacons and crosswalk visibility enhancements that have proven safety benefits to reduce pedestrian crashes at urban and rural crossing locations."
The STEP team helps agencies create pedestrian safety action plans and deploy countermeasures. "We're available to conduct training, workshops, and road safety audits," said Crowe. "We are organizing peer exchanges and scan tours so States can learn from each other and actually see how these countermeasures work."
Fifty-two State Transportation Innovation Councils plan to achieve the demonstration, assessment, or institutionalized stages of STEP countermeasure deployment in EDC-5.
The Virginia Department of Transportation (VDOT) developed a Pedestrian Safety Action Plan to address a 19 percent increase in pedestrian fatalities since 2012. "VDOT is taking action by applying training, FHWA guidance, and data analysis to select locations for pedestrian safety improvements," said Mark Cole, VDOT assistant State traffic engineer.
To develop the plan, VDOT used systemic and crash-based analysis to identify priority corridors and sites for installing pedestrian safety countermeasures. The plan includes an inventory of pedestrian countermeasures and their potential crash reduction benefits. "Many of our countermeasures are lower cost, higher benefit treatments," said Cole.
After creating the plan, VDOT issued a call for projects that met the objectives of the safety analysis and advanced implementation of STEP countermeasures. VDOT scheduled 25 projects totaling more than $8 million to deploy pedestrian safety improvements in 2019.
Maine's 5-year pedestrian fatality average was 10.4 a year in 2014. After annual pedestrian fatalities jumped to 19, 17, and 21 in the next 3 years, the Maine Department of Transportation (DOT) launched the Heads Up campaign to raise awareness of pedestrian safety and reduce crashes.
As part of Heads Up, MaineDOT partnered with the Bicycle Coalition of Maine to conduct pedestrian safety forums, focusing on 21 communities that represent 29 percent of Maine's population but 65 percent of pedestrian crashes. The forums reviewed pedestrian safety issues and crash statistics and enabled participants to discuss problem areas in their communities.
One goal of the forums and subsequent road safety audits was to identify potential pedestrian safety projects. In 2019, MaineDOT allocated $250,000 in Highway Safety Improvement Program funds for pedestrian safety and another $150,000 for crosswalk projects.
Watch a webinar on STEP countermeasures and how agencies are incorporating them into safety plans.
Read the "Guide for Improving Pedestrian Safety at Uncontrolled Crossing Locations" for best practices on countermeasure selection.
Contact Becky Crowe of the FHWA Office of Safety or Peter Eun of the FHWA Resource Center for information and technical assistance.
The Safe Transportation for Every Pedestrian initiative features seven proven countermeasures for crossing locations.
Rectangular rapid flashing beacons use an irregular flash pattern at midblock or uncontrolled crossing locations to increase driver yielding behavior, reducing pedestrian crashes up to 47 percent.
Leading pedestrian intervals at signalized intersections allow pedestrians to walk before vehicles get a green signal to turn, increasing visibility, reducing conflicts, and lowering pedestrian crashes up to 59 percent.
Crosswalk visibility enhancements, such as lighting and enhanced signage and markings, help drivers detect pedestrians and reduce pedestrian crashes 23 to 48 percent.
Raised crosswalks can serve as a traffic calming measure, reduce vehicle speeds, and cut pedestrian crashes up to 45 percent.
Pedestrian crossing, or refuge, islands provide a safer place for pedestrians to stop at a road's midpoint before crossing the remaining distance, which can decrease pedestrian crashes up to 32 percent.
Pedestrian hybrid beacons (PHBs), an intermediate option between a flashing beacon and a full pedestrian signal, provide stop control for higher speed, multilane roadways with high vehicular volumes. PHBs can reduce pedestrian crashes up to 55 percent.
Road diets can reduce vehicle speeds and the number of lanes pedestrians cross, as well as create space to add facilities such as pedestrian crossing islands. Road diets can cut total crashes 19 to 47 percent.
The number of States using data to improve traffic incident management (TIM) doubled during Every Day Counts round four (EDC-4) as agencies expanded the collection and analysis of data to gauge the effectiveness of TIM strategies and support TIM response efforts.
Traffic incidents put travelers' and emergency responders' lives at risk and cause a quarter of all traffic delays. Resulting congestion can lead to secondary crashes. TIM programs that plan for and coordinate incident response among agencies reduce the duration and impact of incidents.
In EDC-4, the Federal Highway Administration promoted the use of low-cost technologies to collect new crash-related data to help agencies enhance TIM programs. FHWA encouraged adoption of three key TIM performance measures: roadway clearance time, incident clearance time, and number of secondary crashes. Some States went further by collecting data such as incident response time, time to return to normal flow, and roadway conditions.
"With better data and analytics, agencies can quantify program performance, demonstrate program effectiveness, and improve TIM planning and resource management," said Paul Jodoin, FHWA TIM program manager and EDC-4 team leader.
The team offered technical assistance on creating data collection systems and using analysis tools and conducted workshops and peer exchanges on implementing TIM performance measurement programs. Forty States reached demonstration, assessment, or institutionalized stages of using data to improve TIM by the end of 2018, compared to 21 at the start of 2017.
Before EDC-4, Arizona's analysis of TIM performance measures focused on crash data from the Arizona Department of Public Safety (AZDPS) only. During EDC-4, Arizona expanded the analysis to include crashes investigated by all law enforcement agencies. A 2015 to 2017 assessment showed that AZDPS collection of TIM performance measures reached 100 percent in 2016, while collection of TIM performance measures by other agencies increased steadily over the 3-year period. Arizona is now targeting specific agencies to further improve collection of the performance measures.
In the past, California had limited data for TIM performance analysis. In EDC-4, the California Department of Transportation (Caltrans) assessed multiple potential data sources, including the agency's major incident database, safety service patrol (SSP) data from one county, and California Highway Patrol (CHP) computer-aided dispatch (CAD) data. The assessment showed that the CHP CAD data offered the best potential for a statewide source of TIM performance measures. The win for California was finding it could use an existing data source to measure TIM performance.
The Indiana Department of Transportation (INDOT) trained traffic management center (TMC) operators to record key data points in incident timelines to estimate roadway and incident clearance times. Operators now input numerical data rather than solely descriptive data. Based on closed-circuit television, operators report whether an incident is secondary when they can make that determination. INDOT also uses real-time third-party crowdsourced data to support incident detection. INDOT and Purdue University created the Traffic Ticker tool to identify speed variations as alerts for potential incidents.
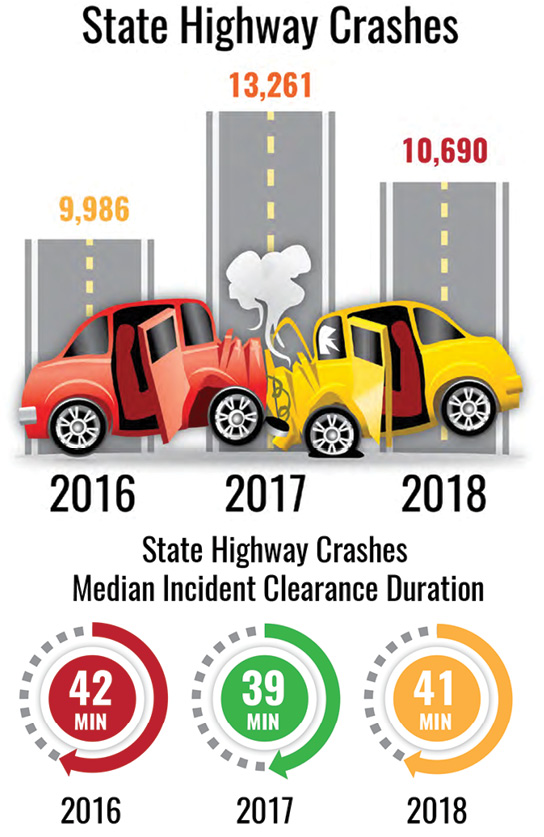
From 2016 to 2017, State highway crashes increased while median incident clearance duration decreased. In 2018, crashes decrease while median incident clearance duration increases. Data analysis helps ODOT assess the context for these shifts and identify a course to improve their TIM program. Credit: Oregon Department of Transportation
The Oregon Department of Transportation (ODOT) created a Transportation Systems Management and Operations Program Performance Management Plan for TIM that outlines goals, core performance measures, action items, and communication. ODOT developed a training program to improve TIM data collection and support performance measure analysis. ODOT leverages traffic operations center data with CAD data from the Oregon State Police and public safety answering points. Using the data, ODOT created a TIM performance measures report, which prompted police to improve roadway and incident clearance times.
The Pennsylvania Department of Transportation (PennDOT) built a Traffic Operations Analytics tool that integrates multiple data sources to better capture incident timelines. The tool combines PennDOT's Road Condition Reporting System and maintenance records, crash data, third-party crowdsourced data, and road weather information. Adding these features to a common platform provides a clearer picture of where, why, and how incidents happen. PennDOT generates quarterly performance management reports for TIM stakeholders.
The Puerto Rico Highways and Transportation Authority (PRHTA) deployed a mobile application for SSP incident reporting that communicates with the TMC using a web-based service to catalog calls. The app replaces paper forms used in the past to document activities. A new SSP dashboard allows decision makers to use the improved quality, quantity, and precision of data to better understand trends and performance by facility and services. In the future, San Juan's TMC will migrate to advanced traffic management system software, and the information from the SSP app will be integrated for seamless collection of event data.
Go to the FHWA TIM knowledgebase for resources and tools to help agencies implement TIM programs.
Contact Paul Jodoin of the FHWA Office of Operations for information, technical assistance.
State Transportation Innovation Council (STIC) Incentive funds offer STICs an edge in their efforts to mainstream new technologies and practices. STICs are using funds to advance innovations such as weather-responsive management strategies, involvement, data for traffic operations, three-dimensional (3D) modeling, and traffic incident management (TIM).
In Colorado, Weld County installed road weather information system (RWIS) stations on County Road 49, a primary arterial connecting two interstates. The stations relay pavement surface conditions, pavement temperature, and atmospheric conditions to the Weld County Public Works Department. This enables the department to deploy snowplows proactively and use deicing materials more efficiently during severe weather, improving safety and saving time and resources. The RWIS data helped the county make decisions on snow and ice strategies during several storms in the 2018-2019 winter season. For information, contact Clay Kimmi of Weld County.
In Delaware, the Wilmington Area Planning Council (WILMAPCO) used virtual public involvement tools to bolster outreach for its 2050 Regional Transportation Plan. The council's strategy combined technological tools, such as virtual workshops and public outreach software to conduct a survey on plan goals and investment priorities, with in-person events, such as pop-up workshops at farmers markets and universities and presentations at community meetings. By adding innovative outreach methods, WILMAPCO doubled engagement to 1,855 people on the 2050 plan, compared to 926 people on the 2040 plan. The council got 639 comments on the 2050 plan, more than 125 times the five comments received on the 2040 plan. For information, contact Tigist Zegeye of WILMAPCO.
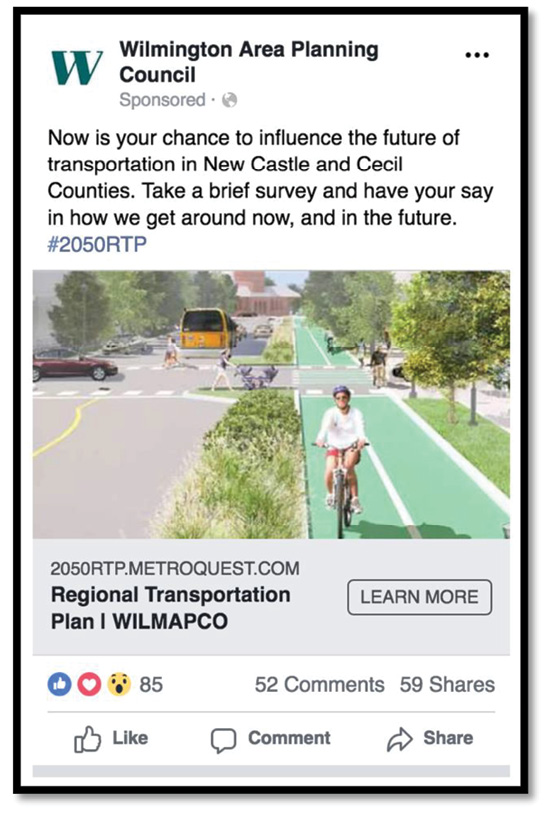
The Wilmington Area Planning Council reached 40,000 people with social media promotion of 2050 Regional Transportation Plan outreach activities, including a survey. Credit: Wilmington Area Planning Council
STIC Incentive funds helped the Iowa Department of Transportation (DOT) implement a traffic operations open data service. The Iowa DOT uses the data feeds from this service in project prioritization, lane-closure planning, and traffic management center (TMC) applications. A work zone alert feed, for example, identifies work zones where traffic has slowed or stopped and triggers text alerts to Iowa DOT staff. The Iowa DOT expects the data service to provide savings to State and local agency staff who obtained information from multiple services in the past. For information, contact Skylar Knickerbocker of the Iowa State University Center for Transportation Research and Education.
The Maine Department of Transportation (MaineDOT) used STIC Incentive funds to develop and implement a process to share 3D model data with contractors to simplify the use of automated machine guidance (AMG) on projects. The process provides contractors with 3D data generated through the design process for use in construction model creation and choice on the selection of AMG equipment. MaineDOT then compares the contractor's construction model with the design data and inspects the project to verify conformity to the design. MaineDOT reports that both large and small contractors are now expanding their use of AMG equipment. For information, contact Brian Kittridge of MaineDOT.
The Tennessee Department of Transportation (TDOT) is adapting a predictive analytics model to enhance its HELP program, which operates service patrols to respond to urban freeway incidents. HELP is part of the department's TIM program to clear incidents safely and quickly. The Tennessee Department of Safety and Homeland Security developed the original analytics model, which predicts the likelihood of incidents occurring in an area at a given time. TDOT will use the adapted model at its TMCs to guide HELP truck deployment. TDOT used STIC Incentive funds to begin the systems engineering development process, including producing a concept of operations and outlining specific systems requirements. Vanderbilt University is continuing design and implementation of the model, which will improve safety and incident response times. For information, contact Brad Freeze of TDOT
The STIC Incentive program provides up to $100,000 a year per STIC to support standardization of innovations by a State transportation agency or other public-sector STIC stakeholder. Funds may be used to develop technical guidance, implement process changes, organize peer exchanges, deploy innovations, or conduct other activities that support STIC goals.
States are using STIC Incentive funds to mainstream innovations from a variety of sources, including Every Day Counts (EDC). During a national STIC meeting webcast, Center for Accelerating Innovation (CAI) Director Thomas Harman offered ideas for EDC-related projects.
"Develop performance measures based on crowdsourced data that are consistent with your organization's goals," Harman said. "Or conduct outreach to help local governments understand value capture and identify funding opportunities to advance transportation projects faster."
State EDC coordinators can supply additional suggestions for STIC Incentive projects and assist with funding applications.
See more projects on the STIC Incentive projects web page.
Contact Sara Lowry of CAI for information on the STIC Incentive program.
States achieved 82 percent of their goals to reach demonstration, assessment, or institutionalized implementation of the 11 innovations in Every Day Counts round four (EDC-4). "Every Day Counts: An Innovation Partnership With States" documents progress in accelerating deployment of the innovations in 2017 and 2018 and highlights State success stories.
Thirty-one States attained demonstration, assessment, or institutionalized stages of automated traffic signal performance measure (ATSPM) implementation. The Metropolitan Transportation Commission (MTC)—the metropolitan planning organization for the San Francisco Bay Area—launched a $13 million challenge grant program called IDEA: Innovative Deployments to Enhance Arterials. The objective is to help cities, counties, and transit agencies improve arterial operations through the deployment of commercially available technologies, such as ATSPM systems or emerging technologies that support regional readiness for a connected and automated vehicle environment.
Nine ATSPM projects were selected. A systems engineering analysis is being conducted for each project, to be followed by system procurement and implementation. The MTC intends to conduct a comprehensive evaluation to assess costs and benefits at the completion of each project. The ATSPM projects selected through MTC's IDEA Program are expected to provide a foundation for continued expansion of the technology in California.
Twenty-six States achieved demonstration, assessment, or institutionalized stages of implementing community connections strategies for planning, designing, and building transportation projects. The Ohio Department of Transportation (ODOT) developed an Active Transportation Policy to direct its planners and engineers to consider the need for community connections on all projects. ODOT evaluates projects for safe, convenient access for all users, including pedestrians, bicyclists, transit users, and motorists, and assesses how projects will enhance connectivity between neighborhood, commercial, and recreational destinations.
ODOT also partnered with Stark County's metropolitan planning organization to use State Transportation Innovation Council Incentive funds to develop a planning and analysis tool for scenario planning along Interstate 77 in Canton. The decision matrix, which allows input of multiple variables, aids in making informed choices on how to connect communities and optimize the flow of people.
Many States deployed e-Construction and partnering tools and strategies in EDC-4 to improve communication and workflows while streamlining project delivery. Forty-six States reached the demonstration, assessment, or institutionalized stages of e-Construction implementation, while 28 States attained the demonstration, assessment, or institutionalized stages of e-Construction and partnering implementation.
An example of e-Construction tools States are using is the Mobile Solution for Assessment and Reporting (MSAR) application, which played a key role in disaster recovery after some of the largest natural disasters in U.S. history. The MSAR app replaces time-consuming paper surveys and inspection reports on disaster damage required for FHWA Emergency Relief programs. When the Texas Department of Transportation (TxDOT) used the app after Hurricane Harvey in 2017, more than 500 sites were approved for Federal recovery funds within 7 months instead of up to 2 years for prior paper-based processes. Reducing clerical work and time needed to create reports saved TxDOT about $1.3 million.
See more EDC-4 success stories in the EDC-4 final report.
The Federal Highway Administration's new "Bridge Bundling Guidebook" leads users through 10 steps for developing an effective bundling program. Although the guide focuses on bridges, agencies can apply the information to develop bundles that maximize resources on all types of projects, such as safety, pavement, and traffic operations.
Topics the guide covers include project delivery methods, funding and financing, coalition building, and risk assessment. The guide features tools to help deliver bundled projects, such as selection criteria and sample contracts. For information, contact Romeo Garcia of the FHWA Office of Infrastructure or David Unkefer of the FHWA Resource Center.
In the past 2 years, the Kentucky Transportation Cabinet (KYTC) has improved overall road conditions by using pavement preservation techniques such as scrub seals, chip seals, cape seals, hot-mix asphalt thinlays, and microsurfacing. By implementing a pavement preservation strategy, KYTC reports an estimated $200 million reduction in its pavement project backlog and believes that by 2022 the backlog will decline by about $400 million. Visit the Federal Highway Administration pavement preservation web page for a pavement preservation checklist series, best practices, and case studies.
Lehigh County, PA, completed the first U.S bridge installation of electrically isolated post-tensioning tendons (EITs) to conduct long-term corrosion monitoring. The project installed five EITs on the 542-foot-long Coplay-Northampton Bridge. EITs provide enhanced corrosion protection and the electrical isolation allows monitoring of each tendon's encapsulation quality and possible corrosion initiation throughout the bridge's service life. Project officials report that these benefits were gained with minimal added construction effort or project cost.
The Narragansett Indian Tribe, Rhode Island Department of Transportation (RIDOT), Rhode Island Historical Preservation & Heritage Commission, and FHWA collaborated on a programmatic agreement (PA) to streamline project delivery. As a result, the tribe is now better able to participate in the conservation, preservation, and protection of Native American cultural resources or human remains that may be impacted by Federal-Aid projects. Under the PA, the Narragansett Indian Tribal Historic Preservation Office will observe archaeological fieldwork performed by the State and help identify archaeological and cultural resources significant to the tribe. The agreement helps integrate National Environmental Policy Act and permitting processes and expedite the consultation process under National Historic Preservation Act Section 106.
Watch live or on-demand: Webinars provide an opportunity to increase your knowledge of new innovations. The value capture webinar series features techniques to capture a portion of the value generated by public infrastructure investment to address funding gaps.
The "Extending Our Reach" webinar series highlights virtual public involvement techniques to enhance transportation agencies' engagement efforts.
Innovator, published by the FHWA Center for Accelerating Innovation, advances implementation of innovative technologies and accelerated project delivery methods in the highway industry. Its audience is transportation professionals in highway agencies, trade and research groups, academia and the private sector, and the driving public.
Elaine L. Chao, Secretary, U.S. DOT
Nicole R. Nason, Administrator, FHWA
Thomas Harman, Director
Jeffrey Zaharewicz, Senior Advisor
Sara Lowry, Program Coordinator
Fawn Thompson, Program Coordinator
Julie Zirlin, Program Manager
Nichole Causey, Marketing Specialist
Ellen Schweppe, Managing Editor
James Cline, Jr., Designer
Pat Holcombe, Designer
Rodney Walker, Designer
Email reprint requests to Nichole Causey
View Innovator archive.

