

MCL Project Reports
Woodrow Wilson Bridge Foundation Concrete Thermal Modeling 0202
Background: The replacement of the Woodrow Wilson Bridge represents a multibillion-dollar project that is being executed by the Maryland State Highway Agency and the Virginia Department of Transportation. A consortium of engineering and contracting firms (TKC) is building the structure. A significant portion of the overall cost of the new bridge is the work required for the pier foundations. The foundations are located both on land and in the Potomac River. Driven piles are providing the load carrying capacity of the foundation. Cast in place pile caps and pedestals complete the foundation structure. The cast in place pile caps and pedestals reflect the size of the bridge and thus can be considered mass concrete placements.
Modeling of the combination of varying air temperature, river water temperature, concrete temperature, placement scheduling, and concrete insulation had been previously performed by CTL for TKC. The FHWA Maryland Division Office requested assistance from the FHWA Mobile Concrete Laboratory to perform independent verification utilizing a semi-adiabatic calorimeter, data collection, and modeling software. The semi-adiabatic calorimeter and software has the trade name of QuadrelTM, a product of Digital Site Systems of Pittsburgh, Pa. The FHWA PCCP Lab at Turner Fairbank Highway Research Center became involved since the contact laboratory staff have experience with the Quadrel hardware and software. This report deals specifically with the results of modeling the pile cap mass concrete placements.
Problem Statement: Predict the performance of pile cap concrete placements under varying air temperatures, river water temperatures, concrete temperatures, and placement times. Predict maximum concrete temperature, maximum temperature differential, and verify concrete strength development. Various cross sections and conditions are to be modeled. Note that modeling in Quadrel will not allow the inclusion of cooling pipes in the concrete mass as allowed with CTL's proprietary software.
Procedure: Materials from the jobsite were secured and shipped to TFHRC. The FHWA Maryland Division Office supplied concrete mixture design information. The laboratory mix was batched and mixed and resultant plastic concrete data recorded. Compressive strength testing was done at 2, 7, 14, 28, and 56days. Concrete mixture data is found in Table #1. The design mixture for the pile caps along with the Quadrel batch is presented in the table
Pile caps of particular interest were highlighted. Three types of conditions can be modeled in Quadrel. The conditions are; a symmetrical cross section with both faces with the same boundary conditions; an unsymmetrical cross section with each face with varying boundary conditions; and a foundation condition, with the concrete in contact with a base material and an exposed face. Cross section geometry of the pile caps and environmental conditions dictated what would be the most appropriate selection for modeling.
| Pile Cap Mix As Designed WBJS-PC40-S75 | Quadrel Mix 20206-1 Yield Adjusted | |
|---|---|---|
| Lehigh Type I/II (Pcy) | 159 | 162 |
| Newcem Grade 120 GBFS | 476 | 486 |
| # 67 Gravel (E.L. Gardner) | 1500 | 1888 |
| Natural Sand | 1400 | 1064 |
| W/C +P ratio | 0.40 | 0.40 |
| Water Content (pcy) | 250 | 255 |
| Plastic Air Content | 6.5 % | 4.5% |
| Slump (inches) | 4 -8 | 6 |
| Air Entraining Admixture Darex II (oz/cwt) | Not Given | 0.45 |
| Water Reducer Type A/D WRDA-35 (oz/cwt ) | 3 | 3 |
| High Range Water Reducer Type G Daracem-100 Addition Rate oz/cwt | 8 | 8 |
| Relative Yield | 1.00 | 0.978 |
| Theoretical Unit Weight (lb/ft3) (Yield Adjusted) | 140.3 | 142.8 |
| Measured Unit Weight (lb/ft3) | --- | 143.1 |
| Concrete Temperature (°F) | --- | 72°F |
| Compressive strength at 2 Days (psi) | 720 | |
| 7 days | 4380 | 4490 |
| 14 days | --- | 5700 |
| 28 days | 5720 | 5200 |
| 56 days | 6180 |
Compressive strength data is also found in Table #1. Two-day tests were required due to the slow rate of hydration.
Quadrel Data: Figure #1 plots Temperature versus Time data along with calculated equivalent maturity hours from the Qdrum specimen Mix 20206-1. The rate of heat generation (the speed of the reaction) and the cumulative heat generated expressed in BTU/lb cementitious are plotted in Figure #2 as a function of Maturity Hours on a log scale
Figure #1 Qdrum Temperature Data and Calculated Maturity Hours Mix 20206-1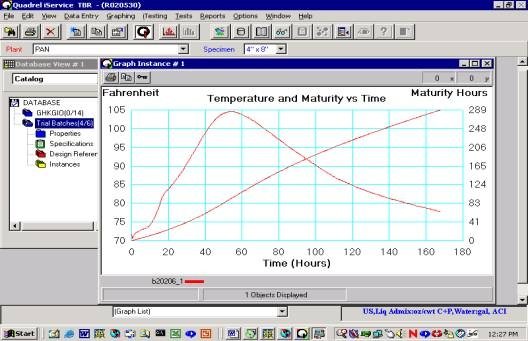
Figure #2 Adiabatic Heat Signatures - Mix 20206-1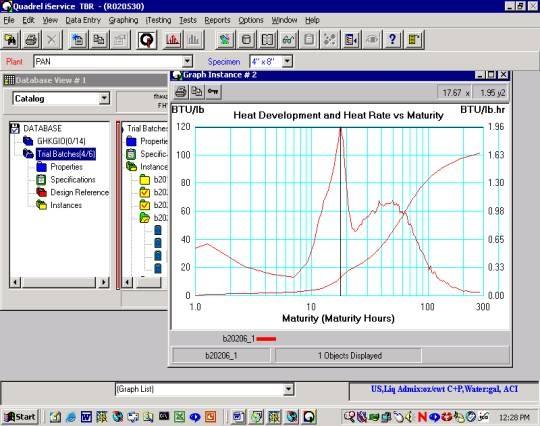
Modeling Concrete Placement with Quadrel: Two construction techniques are being used for the pile cap concrete placements. They are:
- Insulated Forms in Contact with Ambient Air: (Majority of pile caps) The outside face of form is exposed to ambient air temperatures through the placement and curing process.
- Uninsulated Forms in Contact with the Potomac River (A few deep water piles) A few of the more massive pile cap placements are in deep water and do not have cofferdams around the pile cap. This means that the concrete forms are in contact with Potomac River water. In addition, these forms do not have the same level of insulation as the majority of the pile caps discussed previously.
Modeling : Pile Caps- Insulated Forms in Contact with Ambient Air. Depths of these pile caps range from a minimum of 9 feet to a maximum depth of 16 feet. Widths of the pile caps range from 40 feet to 53 feet. All are cast on a concrete tremie slab. The critical dimension for heat loss from the placement will be the depth of the pile cap. Based on the above information, the best model selection from Quadrel for the insulated pile caps is the foundation model. Table #2 contains the range of conditions modeled for the insulated pile caps. The tremie slab concrete temperature is assumed to be 60 °F.
| Model | Factors | Range (°F) | Comments |
|---|---|---|---|
| Foundation Model | Air Temperature | 30-90 | Tremie Slab= 60°F as foundation Concrete against (foam insulation +steel) form then ambient air, foam blanket on surface of placement |
| Concrete Temperature | 50-90 | ||
| Placement Depth (ft) | 9ft-16ft |
Modeling Uninsulated Forms (Deep Water Pile Caps) in Contact with the Potomac River The massive deep water pile cap placements are not insulated. There are potentially two paths of heat loss for the deep-water pile caps. With a length to depth ratio of 5.4 (87 foot length versus 16 foot depth) it would be expected that depth would govern the temperature distribution in the mass concrete placement. However, with the face of the uninsulated forms in contact with the water that has a thermal conductivity in the range of 7.0 Btu in/h ft2 versus 0.31 Btu in/h ft2 [1] for air, this condition also warrants investigation. For investigating the case that is governed by the concrete depth, the most appropriate model was the foundation model. For investigating the effects of water surrounding the forms, the most appropriate model was the symmetrical cross section.
| Model | Factors | Range (°F) | Comments |
|---|---|---|---|
| Foundation Model | Air Temperature | 30-90 | Tremie Slab= 60°F as foundation |
| Concrete Temperature | 50-90 | ||
| Symmetric Wall Model | River Water Temp | 40-70 | Sides of pile cap concrete against (plywood +steel forms) against Potomac River. |
| Concrete Temperature | 50-90 |
Quadrel Modeling Details:
- Simulations for a minimum of 1 month (672 hours)
- Ambient air temperature was kept constant at the level in the experimental design.
- River water temperature was also kept at a constant value during the simulation.
- The "thickness" of water around the concrete surface for the model involved in heat transfer was taken as five feet.
- River current velocity was not incorporated into the model.
Modeling Results
Results- Pile Caps- Insulated Forms in Contact with Ambient Air. An example output from Quadrel is found in Figure #3. This is for the midpoint range of allowable concrete placement temperature 70°F and ambient air temperature of 60°F. Temperature curves for various depths into the concrete mass and the two surfaces are plotted
Figure #3 - Pile Caps- Insulated Forms in Contact with Ambient Air Model - Air temperature=60°F and Concrete Temperature at Placement= 70° Depth =16 ft
Comments on Results Pile Caps- Insulated Forms in Contact with Ambient Air Model:
- Center of the concrete mass is still at an elevated temperature one month after placement for all concrete placement temperatures.
- Minimum concrete temperatures will occur at either the tremie slab interface or the surface of the pile cap depending on the time after concrete placement.
- Initially, the tremie slab interface represents the location of minimum concrete temperature. As heat is transferred through the interface to the tremie slab, the temperature rises until the location of the minimum concrete temperature is found at the pile cap concrete - insulation blanket (ambient air) interface at the top of the pile cap
- The simulation results indicate that for a 16 foot deep pile cap to not exceed the 35°F differential, the initial concrete placement temperature must be less than 65°F (see figure 4).
- The simulation results indicate that for a pile 9 foot deep pile cap to not exceed the 35°F differential, the initial concrete placement temperature must be less than 70°F (see figure 4).
- Changes in ambient air temperature had no significant effect on the model results
- Only concrete placement temperature (major effect) and depth of pile cap (minor effect) were significant.
Maximum Temperature Differentials: The influence of concrete placement temperature and maximum temperature differential are plotted in Figure #4. The maximum temperature differentials are plotted over the whole range of anticipated concrete placement temperatures and pile cap depths. The plot illustrates that the major factor for the maximum temperature differential through the pile cap cross section is the initial concrete placement temperature, with the change in pile cap placement depth from 16 feet to 9 feet having a minor effect.
Figure #4 - Maximum Concrete Temperature Differential for Insulated Forms in Contact with Ambient Air
Peak Concrete Temperature Figure #5 is a plot of the maximum concrete temperatures for the varying thickness of the insulated pile caps. Ambient air temperature is not a significant factor. The concrete placement temperature is the main factor that affects maximum concrete temperature.
Figure #5 - Maximum Concrete Temperature for Insulated Forms in Contact with Ambient Air
Time of Peak and Maximum δ Temperature: The near adiabatic conditions that exist in the pile cap placements influence the time when peak concrete temperatures and maximum temperature differentials occur. The influence of concrete placement temperature and pile cap thickness is found in Figure #6. There is at minimum a doubling of the time to reach peak concrete temperatures and maximum temperature differential when the concrete placement temperature is reduced from 90°F to 50 °F.
Figure #6 Time of Peak and Maximum δ Temperature Events for Insulated Pile Caps Form in Contact With Ambient Air
Results - Deep Water Pile Caps- Uninsulated Forms in Contact with the Potomac River An example of the simulation results for this model is found in Figure #7. Figure #9 plots the simulation results for a concrete placement temperature of 70°F and a water temperature of 70°F. The data on the simulation temperature versus time plot have been labeled for easier identification. The simulation was run for a period of two months (1320 hours).
Figure #7- Pile Caps- Uninsulated Forms in Contact with the Potomac River - Investigation of Steel Form- Symmetrical Wall Model -Water Temperature=70°F and Concrete Temperature at Placement= 70° 
Comments on Results Deep Water Pile Caps- Uninsulated Forms in Contact with the Potomac River.
- Adiabatic conditions still exist in the center of the mass after 2 months.
- Surface of the concrete mass in this case is also the minimum concrete temperature.
- The surface of the concrete mass approaches the river water temperature over an extended period of time.
- Maximum temperature differential occurs much later when the concrete surface temperature approaches water temperature
- Peak concrete temperature is only influenced by the initial concrete temperature placement.
- The temperature differential for the deep water uninsulated pile caps cross section is greater compared to the insulated form model in contact with ambient air.
- The temperature of the river water is a very significant factor in determining the maximum temperature differential in the deep pile cap cross section.
Maximum Temperature Differentials Figure #8 plots the maximum temperature differential for the uninsulated pile caps. As discussed previously, the maximum temperature differential comes at later ages in the pile cap since the center of the cross section remains at adiabatic conditions while the form face is cooling to the river water temperature. Maximum temperature differentials are almost twice that of the insulated piles caps exposed to air discussed previously,
Figure #8 Deep Water Pile Caps- Maximum Temperature Differential (δT) for Uninsulated Forms in Contact With Potomac River Water
Results - Deep Water Pile Caps-Insulated Form Model in Contact With Ambient Air: Away from the interface of river water and the uninsulated form of the deep water pile cap the most appropriate model is the insulated form model at a fixed depth of 16 feet. Heat generated by hydration will escape either through the concrete tremie slab or through the blanket insulation at the surface. Results were discussed previously.
Superposition of the Two Models - Deep Water Pile Caps The major difference between the two models is the eventual reduction of the temperature at the center of the concrete mass over time for the insulated foundation model that is in contact with ambient air. The actual maximum temperature differential for the deep-water pile cap placement is somewhere between the two model values. That is, the maximum temperature differential is not as severe as the uninsulated wall model in contact with the Potomac River or as moderate as the insulated forms in contact with ambient air. This is because the temperature at the center of the concrete mass is controlled by heat loss to the top and bottom (due to height being the least dimension), while temperatures near the edges are controlled by heat loss to the river (due to the greater thermal conductivity of water). By measuring temperatures at discrete intervals an estimated temperature differential can be determined by superposition. The minimum temperature of the two models is compared and the lowest value selected. The differential at time interval t is then determined by subtracting the peak temperature of the insulated form model -minimum temperature. Results are plotted in Figures 9, 10 and 11.
Figure #9 - Estimated Maximum Temperature Differential- 50°F Concrete Placement - Deep Water Pile Cap
Figure #10- Estimated Maximum Temperature Differential- 70°F Concrete Placement- Deep Water Pile Cap
Figure #11- Estimated Maximum Temperature Differential- 90°F Concrete Placement - Deep Water Pile Cap
Examination of Figures #9 through #11 indicates that temperature differentials exceed the limit of 35 °F for most scenarios. In fact, the temperature differentials exceed 35°F for extended periods of time. Again, the lower the initial concrete placement temperature, the lower the temperature differential in the deep-water pile cap placement. When the concrete placement temperature is lowered to 50°F and exposed to warm river water with a temperature of 70°F, the differential is no more than 30°F. This is best illustrated with Figure #12 . The most effective way to reduce the concrete temperature differential would be to place the deep-water pile caps when the river temperature is elevated provided the concrete placement temperatures can be lowered to the range of 60°F. Achieving a placement temperature of 60°F should be feasible with a combination of cooling methods for concrete materials and the mixing process.
Figure #12 - Deep Water Pile Cap Concrete Placement Temperature Differentials at - River Water 70°F
Conclusions: The following conclusions can be made about the pile cap concrete placements and modeling with Quadrel based on the materials received, mixed, and tested:
General:
- The geometry of the pile caps creates close to, if not actual, adiabatic conditions in the center of the concrete mass.
- Removal of insulation blankets or insulated forms to "speed up" the cooling of the concrete mass will only cause an increase in the temperature gradient from the center of the concrete to the exposed surface. The risk of exceeding tensile strength of the concrete by the increase in the stress caused by the thermal gradient of the concrete mass greatly outweigh the benefit of the heat reduction since heat is not being removed directly from the center the pile cap placement
Insulated Pile Caps Exposed to Ambient Air
- Ambient air temperatures over the range modeled were not significant in the outcome of the pile cap concrete placements.
- The responses of peak concrete temperature, maximum temperature gradient, time of peak temperature of cross section, and time of maximum temperature gradient within the mass of concrete are drastically influenced by the temperature of the concrete at time of placement. As an example, lowering concrete placement temperature from 90°F to 70°F will reduce the peak concrete temperature at the center of the mass from 160°F to 140°F for a pile cap with a depth of 16 feet. Also, controlling concrete placement temperatures will provide a passive means to control the overall performance and quality of the concrete that does not rely on active cooling systems.
- Based upon this analysis with its associated assumptions of constant concrete placement temperature, and an initial tremie slab temperature of 60°F, the concrete placement temperature should not exceed 65 °F to ensure that the maximum in-place temperature differential does not exceed 35 °F. It should be noted that the temperature of the concrete leaving the batch plant prior to being transported by barge must be several degrees lower than 65°F to account for concrete temperature rise during haul time prior to placement.
- Means of attaining a concrete placement temperature of less than 65°F with the current pile cap mixture design can be achieved by many methods. They include the following:
- Lower concrete constituent temperatures through:
- Watering aggregate sources
- Shading aggregate sources
- Chilling water
- Using ice instead of a portion of the mixing water
- Using liquid nitrogen to cool the concrete down during mixing
- A more economical approach to minimizing concrete temperature differentials could be achieved using a systems approach. A reduction in the overall heat generation of the mixture design would allow for higher concrete placement temperatures while still meeting the stated 35 °F maximum temperature differential through the concrete mass. The concrete would be less sensitive to control of constituent material temperatures and ambient air temperatures during transport. The reduction of overall heat generation of the mixture can be accomplished by:
- An overall reduction in the total cementitious content of the mixture to reduce total heat generation
- A concrete mixture design that has lower rate of heat generation per pound of cementitious material (i.e. use of fly ash, etc.).
Deep Water Uninsulated Pile Caps Exposed to River Water
- River water temperature did not influence the peak concrete temperature in the pile cap
- Ambient air temperature did not did not influence the peak concrete temperature in the pile cap.
- Peak concrete temperature in the pile cap is only affected by initial concrete placement temperature
- River water temperature has a very significant influence on the peak temperature differential in the pile cap section.
- Deep pile cap placements should occur when the river temperature is elevated Thermal gradients are reduced when water temperature is elevated. If the initial concrete placement temperature is lowered to 20 degrees below river water temperature, thermal cracking risk is minimized and a passive system (cooled concrete placement) is sufficient to prevent the 35°F temperature differential from being exceeded.
- Extra care to prevent excessive thermal gradients is to be taken when river water temperatures are below 55°F. An active cooling system will be required at lower water temperatures to prevent thermal cracking. Active systems should be run initially in the center of the concrete mass and monitored closely.
- Additional thermocouples are highly recommended to get a more complete picture of thermal gradients in the deep-water pile caps due to the variation in the means of heat transfer throughout the cross section.
Dobrowksi, Joseph A,[1]"Concrete Construction Handbook- 4th Edition", pp 20.3-20.4, McGraw-Hill Book Company, New York, 1998