U.S. Department of Transportation
Federal Highway Administration
1200 New Jersey Avenue, SE
Washington, DC 20590
202-366-4000
Federal Highway Administration Research and Technology
Coordinating, Developing, and Delivering Highway Transportation Innovations
| SUMMARY |
| This report is an archived publication and may contain dated technical, contact, and link information |
| Publication Number: FHWA-HRT-11-036 Date: July 2011 |
Publication Number: FHWA-HRT-11-036 Date: July 2011 |
PDF files can be viewed with the Acrobat® Reader®
The Federal Highway Administration's (FHWA) Office of Operations R&D and the Exploratory Advanced Research Program Team hosted a workshop in May 2010 as part of an ongoing effort to examine the area of Agent-Based Modeling and Simulation (ABMS) and its application in transportation research. The workshop successfully brought together experts from various fields outside of transportation to share their knowledge and experience in applying ABMS to study topics such as consumer behavior in the market place, the impact of certain policies on Hawaii's fisheries, and predicting the spread of epidemics. The workshop also connected FHWA technical experts with those from academia, national laboratories, and other sources conducting relevant ABMS research.
Through the distribution of this workshop summary report, it is our hope that the information and thoughts shared at the meeting will help shape the scope of FHWA's further investment in modeling and simulation research through open solicitation, interagency agreements, or other appropriate mechanisms.
Michael F. Trentacoste
Associate Administrator
Office of Research, Development, and Technology
Federal Highway Administration
Notice
This document is disseminated in the interest of information exchange under the sponsorship of the Department of Transportation. The United States Government assumes no liability for its contents or use thereof. This report does not constitute a standard, specification, or regulation.
The United States Government does not endorse products or manufacturers. Trade and manufacturers' names appear in this report only because they are essential to the object of the document.
Quality Assurance Statement
The Federal Highway Administration (FHWA) provides high-quality information to serve government, industry, and the public in a manner that promotes public understanding. Standards and policies are used to ensure and maximize the quality, objectivity, utility, and integrity of its information. FHWA periodically reviews quality issues and adjusts its programs and processes to ensure continuous quality improvement.
Technical Report Documentation Page
| 1. Report No.
FHWA-HRT-11-036 |
2. Government Accession No. | 3 Recipient's Catalog No. | ||
| 4. Title and Subtitle
Agent-Based Modeling and Simulation Workshop Summary Report |
5. Report Date July 2011 |
|||
| 6. Performing Organization Code | ||||
| 7. Author(s)
Office of Operations R&D |
8. Performing Organization Report No.
|
|||
9. Performing Organization Name and Address Woodward Communications, Inc. |
10. Work Unit No. (TRAIS) |
|||
11. Contract or Grant No. DTFH61-09-F-00027 |
||||
| 12. Sponsoring Agency Name and Address
Office of Operations R&D |
13. Type of Report and Period Covered
Summary Report |
|||
14. Sponsoring Agency Code
|
||||
15. Supplementary Notes FHWA Technical Point of Contact: C. Y. David Yang, Office of Operations R&D |
||||
| 16. Abstract
The report summarizes a workshop held in May 2010 as part of an ongoing effort to examine Agent-‐‑Based Modeling and Simulation and its application in transportation research. Part One focuses on the following presentations: Agent-‐‑Based Simulation and Modeling: Identification of Breakthrough Research for Highway Transportation, Computer Simulation for Transportation Studies – A Brief History; Overview and Development of Agent-‐‑Based Modeling and Simulation; Agent-‐‑Based Modeling with Repast Simphony Including a Consumer Products Modeling Example; Using Pattern-‐‑Oriented Modeling in Developing the Agent-‐‑Based Model of Hawaii’s Longline Fishery; Predicting Pandemic Disease Spread in Urban Environments With Agent-‐‑Based Simulation, Agent-‐‑Based Modeling of Transportation Systems. Part Two of the report summarizes the group breakout discussions. |
||||
| 17. Key Words
Agent-Based Modeling Simulation (ABMS), Computer |
18. Distribution Statement
No restrictions. This document is available to the public |
|||
19. Security Classification Unclassified |
20. Security Classification Unclassified |
21. No. of Pages 24 |
22. Price | |
| Form DOT F 1700.7 | Reproduction of completed page authorized |
Following a welcome from Michael Trentacoste, Associate Administrator for Federal Highway Administration (FHWA) and Director of the Turner-Fairbank Highway Research Center, the Agent-Based Modeling and Simulation (ABMS) Workshop began with a presentation by David Kuehn, Exploratory Advanced Research (EAR) Program Manager.
Kuehn gave an overview of the EAR Program and its current status, explained the steps of the research process, and commented on the high value the program places on partnerships and collaboration. Kuehn explained that the goal of the workshop was to gain insight into how other fields of study utilize agent-based modeling.
Next, David Yang of FHWA's Office of Research and Development gave a brief historical perspective on the significant developments of computer simulation used in transportation studies—highlighting the link between computer programming languages, transportation theories, and analytical tools.
Argonne National Laboratory's Charles Macal continued the workshop with an overview of agent-based modeling and its development. A relatively new approach to modeling systems, agent-based models are useful in analyzing and understanding how people's behavior may affect factors such as pedestrian movement, transportation, and traffic. Macal defined characteristics and features of agents, and offered nine suggestions on when agent-based modeling is an appropriate methodology.
Michael North, also of Argonne, proceeded to showcase Repast Simphony and explained the capabilities and system requisites of this free and open-source software for agent-based modeling. He also provided multiple, non-transportation examples of agent-based modeling studies, including a successful effort in a consumer product market.
The practice of longline fishing in Hawaii was the next example, presented by Run Yu of University of Hawaii and Apple Inc. By illustrating an agent-based model using pattern-oriented modeling, Yu explained how this research method is useful in evaluating policy and the impact of regulations on Hawaii's fishery.
Following this, the University of Toronto's Dionne Aleman highlighted how using an agent-based simulation can aid public health officials in preparing a population for a pandemic disease. Information gleaned can aid officials in planning for public information campaigns, vaccine supply needs, and healthcare facility utilization.
Finally, William Rand of the University of Maryland discussed a transportation-related study that used an agent-based model. He also explained the key attributes of NetLogo, a tool often used for agent-based modeling and simulation.
The remainder of the 1-day workshop included small group discussions on three critical topics related to ABMS: technical gaps to overcome, challenges of incorporating ABMS in transportation, and potential applications of ABMS in transportation.
Key Technical Gaps to Overcome
Challenges of Incorporating ABMS in Transportation
Potential Applications of ABMS in Transportation
APPENDIX B: KEY CONTACT INFORMATION
On May 4, 2010, at the Turner-Fairbank Highway Research Center in McLean, VA, the Federal Highway Administration's (FHWA) Exploratory Advanced Research (EAR) Program convened a 1-day workshop on Agent-Based Modeling and Simulation (ABMS).
A panel of five speakers presented tools, methods, and concepts related to ABMS. These presentations, including answers to any additional questions raised, are incorporated into part one of this report. Following the presentations, these speakers and representatives from academia, the transportation industry, and other professional areas specific to agent-based modeling, discussed applications to transportation, knowledge gaps, and barriers to implementation. These small group discussions are summarized in part two of this report.
The workshop was part of a targeted effort to convene special workshops and symposia and invite noteworthy speakers on groundbreaking topics for brainstorming future trends and research gaps.
This report is being distributed to the workshop participants, as well as to the broader highway community.
David Kuehn, EAR Program Manager, FHWA
202-493-3414 (email: david.kuehn@dot.gov)
In 2005, the EAR Program received approximately $10-11 million in funding to focus on long-term needs of the larger highway community, address persistent research gaps, and utilize ideas from basic research in different industries and sectors to match highway research questions and needs.
There have been four cycles of solicitations, resulting in 32 awards—9 of which are in process now. Most projects have some level of funding match, with about $29 million in Federal funding currently involved in projects. These projects are generally between 2 and 4 years in duration, and FY 2010 will see a full complement of EAR Program projects running, with some nearing completion.
The EAR Program process begins with an initial stage investigation, which has included more than 40 workshops, literature reviews, and frequent scanning—all designed to help identify the best opportunities from different fields and areas of science and engineering. Not all initial stage research is selected to move to the next stage.
The next step in the process is solicitation and a search for the best and brightest teams, with particular importance placed on collaboration. Merit review is used in the initial evaluation of proposals and throughout the research projects, and stakeholders representing academia, government, industry, and international interests are involved from beginning to end in communicating results.
The topic areas of greatest interest to the EAR Program are integrating highway system concepts, nanoscale research, human behavior and travel choices, new technology and advanced policies for energy and resource conservation, information sciences, breakthrough concepts in material science, and technology for assessing performance.
The hidden gems of the EAR Program are the partnerships created in the various stages of the research. The stakeholder involvement, the networking, and the sharing of ideas—all these aspects increase the knowledge base in advance of published papers and formal reports. The EAR Program is looking for original ideas and concepts that are going to advance the science and engineering of highway transportation. It is trying to accelerate the capacity of the industry to think about tough problems, and through innovative research and collaboration, attempt to solve them.
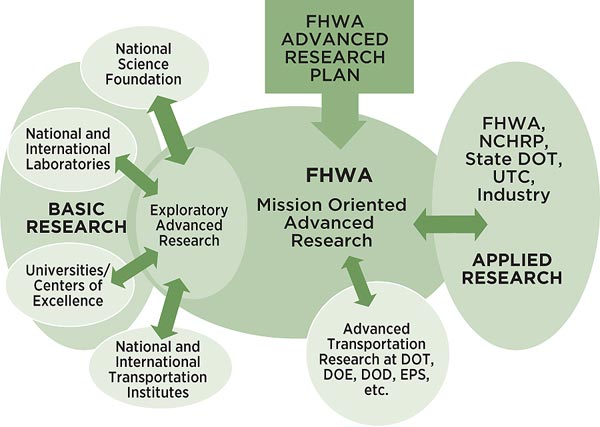
Diagram shows how EAR responds to the gap between basic and applied research.
David Yang, Ph.D., Office of Operations R&D, FHWA
202-493-3284 (email: david.yang@dot.gov)
There have been several key developments in traffic simulation history, starting with the Monte Carlo method. This commonly used simulation method in traffic and transportation can be traced back to the 18th century.1 The unveiling of the first general computer was another milestone in the 1940s, the same decade that saw the first formulation of a Monte Carlo computation for an electronic computing machine.2 In the 1950s, IBM launched FORTRAN, a useful programming language.3 The PC era began in the 1980s and by the mid-1990s, Web-based simulations began. All of these developments are useful reference points in the evolution of simulation used in transportation.
An important development of simulation tools for transportation research was the use of flight training devices, developed in the late-1920s, with American Airlines becoming the first airline to use a training simulator in the 1930s.4 The availability of simulation for rail and ships began to develop in the 1970s; and then in the late-1990s and early-2000s, the National Advanced Driving Simulator was developed to study driver behavior. In more recent years, the Federal Railroad Administration installed an advanced train simulator.
Bruce Greenshields was the first to use mathematical equations to study highway capacity in the 1930s.5 Shortly after, William Adams used probability theory to describe traffic flow. In the early-1950s, intersection simulation work was being conducted, as well as a University of California study on highway simulation. Since the 1960s, many simulation tools have been developed and used to examine various transportation and traffic events. Examples include the Model of Metropolis and TRANS (1960s); CORSIM and the Texas Model (1970s); INTRANS, INTEGRATION, and AMSUN2 (1980s); TRANSIMS, VISSIM, and PARAMICS (1990s); and NGSIM (2000s).
While all of these historical milestones are important to the type of models and simulation tools now used to study issues related to traffic and transportation, it is expected that this workshop will help determine how to improve upon these tools. Although these tools do help researchers model driver behavior, they do not do so at the level required and, in particular, offer no insight into the driver's decisionmaking process. Looking at methodology used in areas of study outside of transportation—such as agent-based methodology—may help improve transportation simulation models.
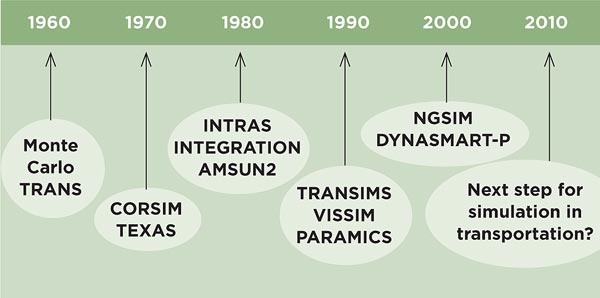
A timeline of computer simulation.
Source: FHWA
Charles Macal, Ph.D., Argonne National Laboratory
630-252-3767 (email: macal@anl.gov)
Agent-based modeling is a relatively new approach to modeling systems comprised of autonomous and interacting agents, and there are a growing number of agent-based applications in a variety of fields. Agent-based modeling can be used to study such phenomena as consumer choice, the spread of epidemics, and behavioral economics in stock market analyses, for example, and it can also be used to understand how people's behavior affects activities like pedestrian movement, transportation, and traffic.
Agents are decentralized, suggesting there is no central authority. They have behaviors and they operate according to what those behaviors dictate they should do. Although agents are autonomous and act independently, they also interact with other agents. This does not mean every agent in a simulation interacts with every other agent all the time, but their environment is dynamic and local.
One reason there is such interest in agent-based modeling is the notion of “emergence”: agent-based models often lead to the emergence of order, patterns, or structures—aspects not originally put into the model. Agent-based modeling also shows what, where, when, and how system-level consequences emerge from the individual level, or migrate from macro to micro and vice versa.
An agent-based model consists of four features: a set of agents defined by the user; a set of agent relationships, also defined by the user; an environment in which the agents live, such as infrastructure and roads; and a framework for simulating all these agent behaviors and interactions. Agent-based modeling begins and ends with the agent perspective, such as how a driver would behave in different situations.
When running a simulation, there are five essential features for an agent to have: it is self-contained; it is autonomous or self-directed; it senses information and translates it into actions; it has a state that varies over time; and it is social and has dynamic interactions with other agents. There are other features often seen in agents, but they are not essential to a good model.
There are different typologies in terms of how agents interact spatially, and agent-based models can often look different. People are working on larger scales now, using realistic maps and Geospatial Information Systems (GIS), and agents are connected through networks. According to Macal, most of the original agent-based models, including traffic models, were based on cellular automata—a field developed by John von Neumann in the 1940s looking at self-replicating machines.6
There are nine top scenarios to consider when deciding whether or not to use agent-based simulation (see box). When using a model, it is always very important to calibrate as much as possible based on available empirical data. In the future it is anticipated that people may even design data collection specifically for the requirements of an agent-based model. For now, there is a definite need to set up a standard for calibration and validation of agent-based models before people can begin to feel comfortable using them for real-world decisionmaking.
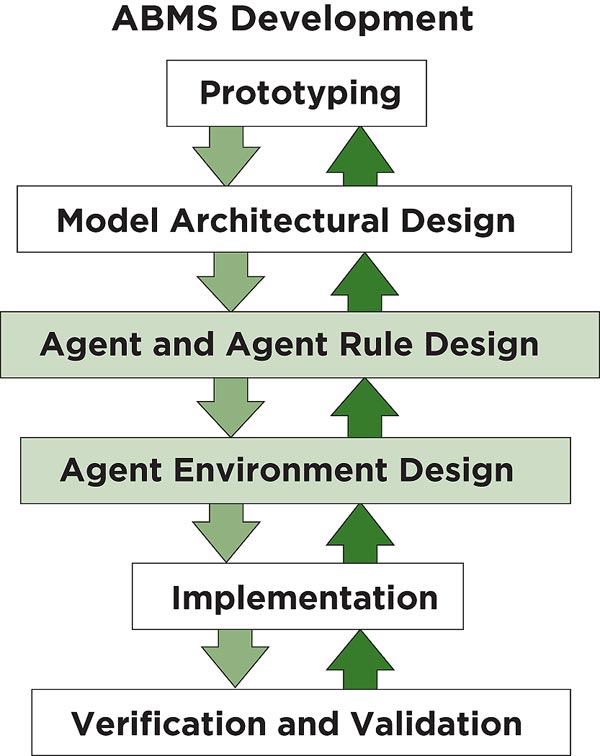
Diagram shows the steps to performing agent-based modeling.
Image courtesy of Charles Macal, Argonne Natl. Lab.
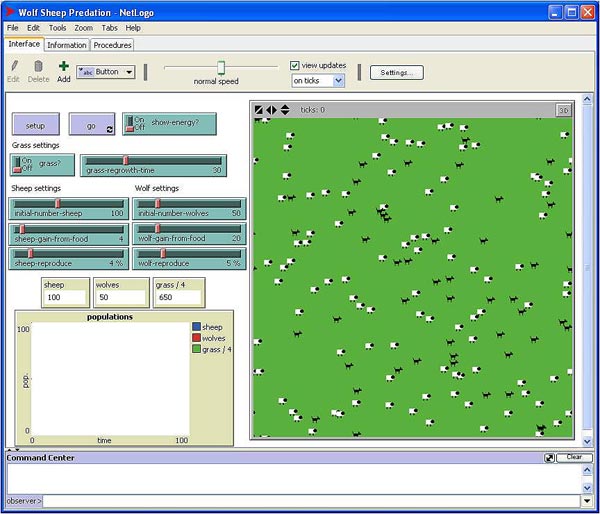
A screen capture from NetLogo.
Wilensky, U. (1997). NetLogo Wolf Sheep Predation model.
Evanston, IL: Center for Connected Learning and
Computer-Based Modeling, Northwestern University.
Top Nine Scenarios for Agent-Based Simulation9. When agents need to learn, adapt, or change their behavior. 8. When agents need to have dynamic relationships with other agents. 7. When agents engage in strategic behavior. 6. When it is important that agents form organizations. 5. When agents need a geospatial component to their behaviors. 4. When the past is no predictor of the future. 3. When scale-up to arbitrary levels is important. 2. When process structural change needs to be a result of the model. 1. When the problem has a natural representation as agents. |
Michael North, Ph.D., Argonne National Laboratory
630-252-6234 (email: north@anl.gov)
Repast is a free, open-source, agent-based modeling and simulation library that can be used as a software tool to write agent-based models. Repast stands for Recursive Porous Agent Simulation Toolkit and has a variety of tools built in or connected to the system for statistics, scientific visualization, data mining, and spreadsheets. Once a model is run, it is possible to immediately analyze results, and execute the model using a variety of experimental designs. One aspect of the system enables specific goal seeking; using a predefined objective function it can compare two different results from the model and improve parameters to get better results.
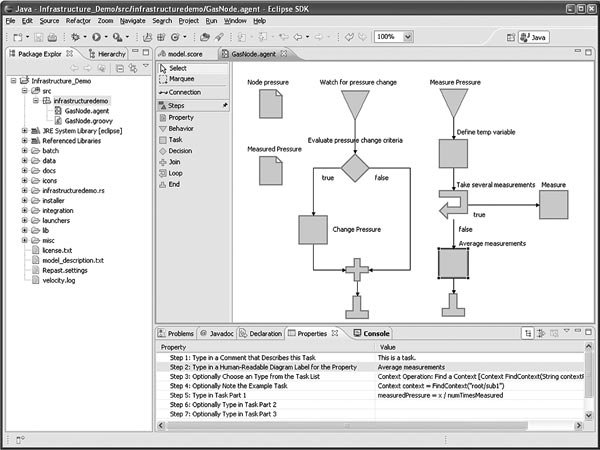
There are many different ways to write models using Repast: with flowcharts, written directly in Java, or using a tool called Groovy. For example, Repast is a powerful, flexible way to write models, allowing multiple paths from conception to analysis. In addition to the selection of different tools in the system, one exciting feature is the application's full geographical information capability in 3-D. Various government agencies are making more and more data available to enhance the GIS capabilities.
The system also features a neural network tool, called Java Object Neural Engine, which can give individual agents or groups a neural network to create patterns and perform pattern recognition. Additionally, there are built-in tools for integrating other types of models into the system. For example, it would be possible to model the flow of traffic and then model driver behavior and decisionmaking when it starts to rain.
The next software release is due out in early fall 2010 and will include the ReLogo system as a major upgrade. ReLogo has two functions: to write models using simple Logo semantics, and to convert NetLogo models. In summer 2010, the Repast Exascale System will be released online. This is designed for use in some of the world's fastest computers and uses the C++/MPI component of the core feature set.
Forecasting Environmental Resilience in Arctic Landscapes—This study looks at the impact of human water use. For example, if people are told there is a shortage of water, will they reduce water consumption?
Investigating Socio-Cultural and Genetic Process Interactions—This study allows researchers to study the effects of migration and social choices that influence long-term population genetics in Indonesia.
Red-Cockaded Woodpecker—The military is using this study to help them judiciously protect an endangered species living on bases in the southwestern United States, yet still continue necessary base operations.
Consumer Market Modeling (Virtual Lab)—This very detailed, successful model has been applied by Proctor and Gamble to two consumer product categories and has resulted in better decisionmaking and cost savings.
Numerous examples are provided by other fields of study, including energy systems, emergency response, social modeling, and chemical production. The failure of one infrastructure and how that may ripple and impact other areas is one area of interest; Repast could be used to investigate if a failure in electric power would propagate into gas infrastructure, for example.
ReLogo automatically converts NetLogo models to Repast Simphony.
Image courtesy of Michael North, Argonne Natl. Lab.
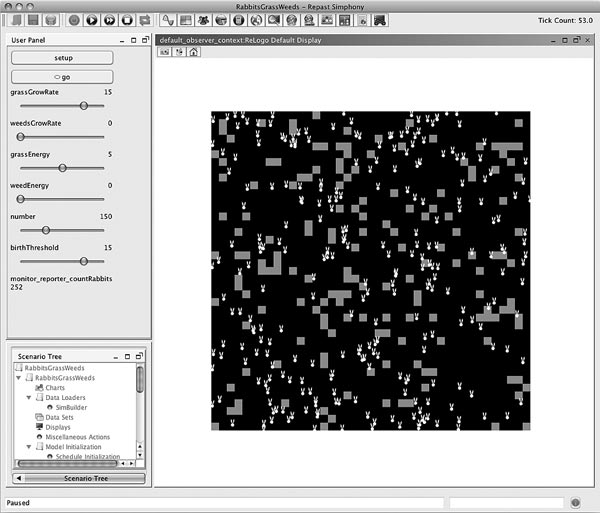
Screen capture of Repast Simphony software.
Image courtesy of Michael North, Argonne Natl. Lab.
Run Yu, Ph.D., University of Hawaii/Apple Inc.
808-956-8819 (email: run@hawaii.edu)
In 2009, the National Marine Fishery Service provided funding for a study of Hawaii's longline fishery using agent-based modeling. The study is ongoing and uses pattern-oriented modeling.
Environmental groups have concerns about the longlines due to the shallow water and the potential for protected animals to be harmed or killed, particularly sea turtles. Lawsuits have been filed, resulting in temporarily closed areas and new industry-wide parameters being set. Complaints from both sides of the debate continue, but longline fishing remains the most important fishery in Hawaii.
The goal of this project was to develop a simulation model for Hawaii's longline fishery, simulating fishing behaviors. It was necessary to identify the patterns and develop a model to reproduce them, then test and validate. The research team found, through literature reviews and preliminary surveys, that only a few fishermen actually make money and that there is a social network of fisherman based on ethnicity. Fortunately, there was already significant data about human fishing activities to start a study, owing to Federal regulations requiring that fishermen keep a detailed logbook.
Three patterns were recognized from the data: entry and exit; quarterly fishing efforts; and spatial fishing efforts. These patterns determined the following decisions to be simulated in a prototype model: when the fisherman wants to enter or exit the fisheries; whether to fish tuna or swordfish; where to fish; and when to return. The patterns also reveal learning opportunities that can influence future decisions.
The prototype model featured 120 vessels and one by-catch species, the loggerhead turtle. Both tuna and swordfish trips were included, with three species of fish. A daily catch index and three management options were also factors.
The model was used to evaluate policies and regulatory options and the resulting impacts on the fishery. The fish were modeled using standard catch per unit effort (CPUE) data, so there are no real or artificial fish in the model at this stage; however, an agent-based model of the fish population is being considered. The study is ongoing, and plans are in motion to calibrate the model against more patterns and to test alternative decision rules. Researchers also plan to look more at communication within the social networks and other management options.
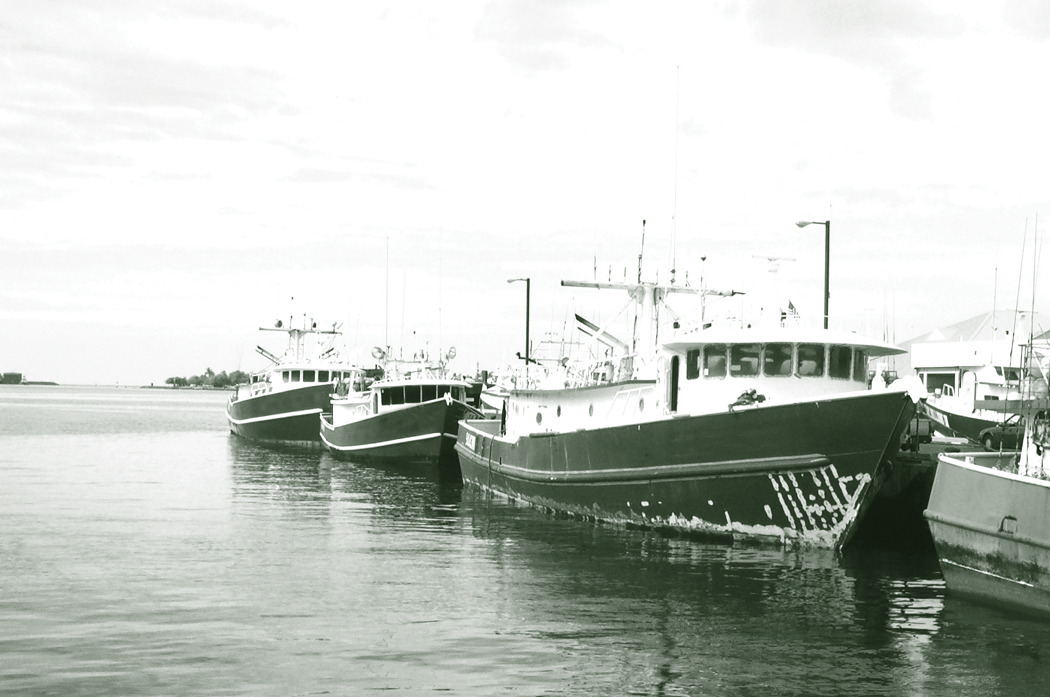
Longline fishing vessels, part of the most important fishery in Hawaii.
Source: Pacific Islands Fisheries Science Center, National Marine Fisheries Service, NOAA
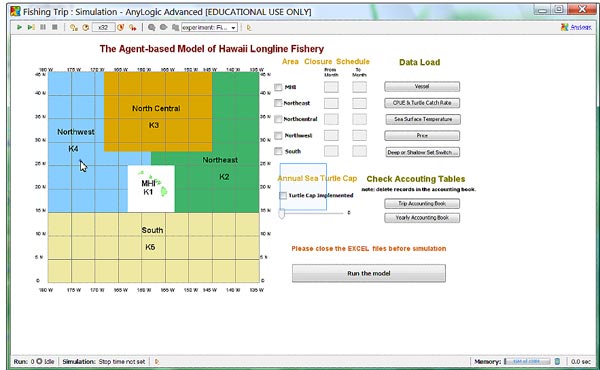
A screen capture showing the agent-based model of Hawaii's Longline Fishery.
Image courtesy of Run Yu and PingSun Leung.
Dionne Aleman, Ph.D., University of Toronto
416-953-3278 (email: aleman@mie.utoronto.ca)
The recent concern over the spread of the H1NI flu prompted study of pandemic disease spread for the Greater Toronto Region using agent-based simulation. The predicted spread of H1N1 was not as bad as expected, and the simulation yielded some valuable information for public health officials. In particular, it was found that there are differences in the spread of disease in rural and urban populations, and the need for better planning is apparent.
In considering the best way to study the spread of pandemic disease to prepare for the future, it was determined that the goals were to minimize the disruption to daily life, the duration of the outbreak, the number of people infected, the number of deaths, and the geographic spread. How to achieve these goals prompted scrutiny of the effect of resources (i.e., vaccines, personal protective equipment, staffing) and policies (i.e., school closings, public information campaigns, media).
In the past, decisions were based primarily on intuition, experience, and existing disease-spread models. Homogeneous mixing models, though widely used, are not considered easy to calculate and do not take into account different environments and scenarios. Non-homogeneous mixing models are not ideal either, due to their complexity and limited ability to track data. A simulation model was chosen for this study due to the simplicity and flexibility it afforded.
The classic SIR model was employed—where everyone is classified as Susceptible, Infected, or Recovered. People were the agents, with unique probabilities of becoming infected, and the probabilities were interrelated, allowing for infinite customizability and better bookkeeping. The whole collection was translated to a simple equation that defined the entire model.
With the simulation it was possible to model infection and death rates according to individual age, public transportation use, transmission within households, healthcare worker exposure, schools and daycare facilities, long-term care facilities, workplaces, effects of media information, and mitigation strategy effectiveness. Some drawbacks to agent-based simulation emerged: it is very time and resource intensive, and for this example, there was limited availability of reliable data. This is a common problem for all complex-systems models but especially so in this scenario when trying to assess people's behavior and not knowing whether they are staying in homes or going out.
No commercial simulation software was used for the study—instead, the model was written in pure C++ to facilitate parallelization and memory management. Particular interest was given to the effects of public service announcements, vaccination rates, and the availability of healthcare services. Because of concerns about the confidence level of the results, sensitivity analysis was carried out and multiple simulations were run, with variables for timing and the percentage of people staying at home. There was 99 percent confidence in the comparisons of viral load rates for the number infected and the number dead, and also in the conclusion that including healthcare makes a difference.
Agent-based simulation was a great choice to study pandemic disease spread and demonstrates the advantage of being able to test multiple scenarios to a very high degree of confidence. Reliable data are the key to success, but simulation models are still better used as “what-if” machines to compare relative outcome differences across various scenarios, rather than as crystal balls.
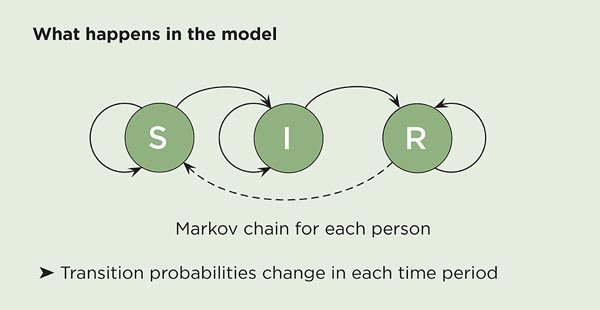
An individual's state of susceptible (S), infected (I), or recovered/removed (R)
can be thought of as a Markov Chain, where a system fluctuates probabilistically
between states according to the arcs.
© Dionne M. Aleman
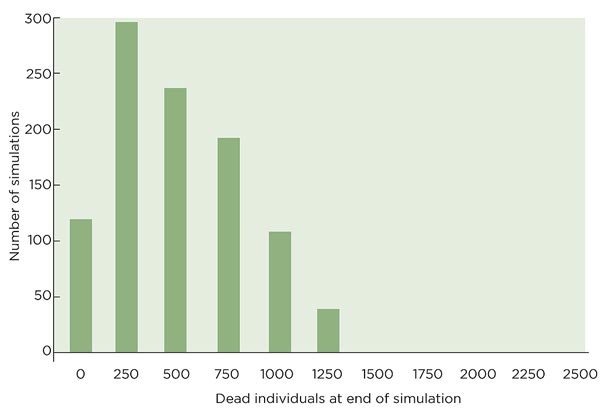
Graph shows that with 50 percent of the population engaging in the
simplistic social distancing behavior of staying home when infected,
the number of deaths after 60 days of the simulated outbreak
is skewed to relatively small values.
© Dionne M. Aleman
William Rand, Ph.D., University of Maryland
301-405-7229 (email: wrand@umd.edu)
A flock of birds provides a useful example of how individuals interacting come together to form emergent patterns of behavior. That same notion of local, individual action giving rise to emergent properties can be used to create interesting behaviors within human population models. In the flock example, the birds follow three simple rules: cohere and move toward the center of your flockmates; align and move in the same direction as your flockmates; or avoid and do not get too close to any of your flockmates.
Agent-based models are easy to build and construct, and this flock scenario is a good example that shows interesting behavior from simple rules that govern individuals. From this 2D example, it is possible to see how underlying rules can be extrapolated by observing behavior. The most important being the separation rule—overriding all other rules it tells the bird to turn if it is about to fly into another bird, something that can also be applied to cars in traffic simulations.
There are many tools other than agent-based modeling that are useful for gaining understanding across disciplines and fields: others are social network analysis, network science, GIS, and machine learning. NetLogo is a very simple programming language developed for agent-based modeling. It is specifically intended to be a low-threshold, high-ceiling language and is very easy to program. NetLogo has several built-in tools for running experiments on agent-based models and collecting data. One is BehaviorSpace, allowing optimization of parameter settings—such as decreasing transit time to the minimum amount possible. Another, HubNet, allows for participatory simulations in scenarios where humans are involved in decisionmaking. A GIS extension allows for high-performance computing clusters and even simulation of cities.
The following examples show a selection of traffic-related uses for NetLogo:
In another example, Yandan Lu, a graduate student at the University of Illinois, Chicago, looked at work-trip modal balance using agent-based modeling. Lu asked the question, “At what point will people switch to a sustainable mode of transportation?” With a huge set of data, a machine-learning algorithm was used to extract rules. Lu demonstrated the model on the six-county Chicago metropolitan area and then looked at the impact of various policy interventions on the system.
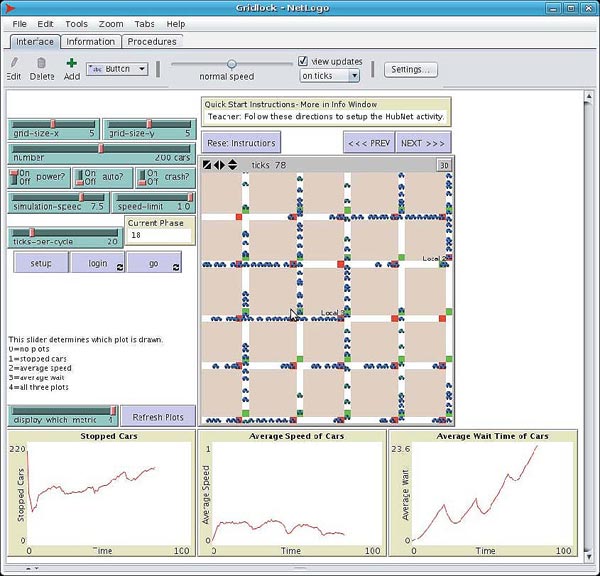
A screen capture showing gridlock in NetLogo.
Wilensky, U., & Stroup, W. (1999). NetLogo HubNet Gridlock model.
Evanston, IL: Center for Connected Learning and
Computer-Based Modeling, Northwestern University.

A flock of birds demonstrate how individuals can interact together and form emergent patterns of behavior.
© iStockphoto.com/Arpad Radoczy
For the afternoon session of the workshop, attendees were divided into three small groups, each tasked with making recommendations in a different area: key technical gaps to overcome, challenges of incorporating ABMS in transportation, and potential applications of ABMS in transportation. Following extensive discussion, each group summarized their findings and made recommendations.
Group 1 Identified Four Key Technical Gaps Facing Researchers:
Data Quality—Identified as the greatest challenge facing researchers, high-quality data are critical to creating a good model, but are expensive, time-intensive, and require sophisticated computer systems.
Data Type—Knowing what type of data to collect presents another challenge to researchers, particularly if the data must integrate with other types of models.
Behavior—Behaviors can change over time, making the predictions of planning models more like guesses.
Logic—Humans are not logical systems but despite this, to model human behavior, logical mathematical equations need to be employed.
The discussion raised the issue that all models are essentially wrong but still remain useful for comparison. For example, when modeling a non-logical system, such as a human being, the only way to do so is with a computer using logical mathematical equations, which does not truly represent reality. Models should therefore be thought of as tools to infer underlying behavior patterns, offering useful insight but not specific numbers.
Data accuracy and availability were also discussed and the group concurred that time, effort, and money should always be invested in collecting as accurate data as possible. In certain situations a lack of data can be overcome by limiting the use of a simulation to hypothesis-testing only. To develop strong simulations from this, an expert input is necessary for an understanding of the underlying model structure. Adjusting behaviors in a model and identifying what a simulation is sensitive to is another important factor to consider.
One school of thought believes in “modeling for insights not numbers.” This is the idea that modeling offers comparative results and insights that can be taken out of a model and tested in the real world. Researchers often resort to the purely statistical characterization of situations to actual behavior, ignoring the intervening parts of how situations lead to attitudes and attitudes lead to behaviors.
In the transportation domain, there are at least three potential applications of agent-based techniques in transportation systems analysis: short-term traffic operations for smaller scale purposes; long-term demand modeling for planning purposes; and interactions with other systems, such as energy, environment, etc. To collect data for these applications, it is important to look at the process of how a decision came about, rather than simply the end behavior. Simulators examining route choice are useful here, as are traditional survey methods, and also real-world observations on driving behavior.
Ultimately, with driver behavior data it is impossible to determine every situation under every set of conditions. Instead, key points must be connected to determine the driver behavior that may result.
Group 2 Identified the Following Challenges Facing ABMS Researchers:
Credibility—One of the biggest challenges in incorporating ABMS in transportation is that ABMS is outside the traditional box and not considered part of current, traditional methods of traffic simulation. It is therefore critical to demonstrate the credibility of ABMS in transportation study.
Data—Ensuring access to proper data is another big challenge facing researchers, and it is important to clearly define the scope of project requirements.
Limitations—Not all transportation problems can be solved using ABMS; it is therefore important for limitations to be acknowledged.
Education—Although it will take time and effort, the transportation community must be educated on the benefits of using ABMS.
The group established that one of the most important factors to establish ABMS credibility is acknowledging its limitations and appreciating that not all transportation problems can be addressed using the technique.
There has been much criticism and questioning in the economics field as to why ABMS was needed, when other tried and true research methods, similar to ABMS, were already in use. To counter this, the argument was made that using a new tool might provide new insight. Additionally, agent-based modeling is considered to be different from most aggregate modeling approaches, in that you can validate multiple levels of data. It was also stated that people have a duty to share knowledge with colleagues in the transportation community and begin to change the transportation curriculum.
A particular advantage of ABMS is the ability to describe the structure of a model to decisionmakers in terms of situations they already understand and have experience with. Progress is then quickly evident in the acceptance of ABMS in most domains. Although it does not replace all other techniques, it is a strong complementary process that can add to the portfolio of work.
The group concluded that making robust policy recommendations, regardless of the uncertainty of the underlying need, will assist in strengthening the case of using ABMS. Additionally, identifying a project area where ABMS may be helpful is another effective method to strengthen a case for using ABMS, demonstrate its value, and establish credibility. In other fields, anthropology and population domains have clearly demonstrated that a strong example can affect greater acceptance of ABMS.
Group 3 Identified the Following Transportation Applications for ABMS:
Although well-studied in terms of pedestrian traffic, evacuation models were suggested as an additional potential transportation application for ABMS. The group suggested it would be interesting to look at such a scenario within a vehicular traffic mode. Driver behavior is considered one of the missing pieces in the traffic and travel dimension simulations puzzle and an important area to develop.
Another potential area the group put forward for investigation is vehicle purchasing trends. Currently, the main criteria for controlling the long-term emissions outcome is based on what type of vehicle a driver purchases, and this knowledge is based on past trends. A research project could determine the type of vehicle people purchase and how long they keep and use a vehicle. ABMS could offer new light in this area and assist planners by accounting for changing driver choices. It could also offer a new tool to measure the resulting impact of government policies and purchasing decisions.
Given that people have different definitions of ABMS, the group suggested that one or two projects need to be clearly identified as good examples that demonstrate the value of ABMS in transportation research. Ideally, it would be beneficial to find a project that other modeling methods cannot perform easily but an agent-based model could excel on. These projects should illustrate that ABMS is the best tool to yield information for some types of research questions.
Agent-Based Modeling and Simulation Workshop
Turner-Fairbank Highway Research Center, McLean, VA, May 4, 2010
| 8:00 a.m. – 8:30 a.m. | IntroductionWelcomeMichael Trentacoste, Associate Administrator for RD&T and Director of TFHRC EAR Program OverviewDavid Kuehn, EAR Program Manager, FHWA |
|---|---|
| 8:30 a.m.–8:45 a.m. | Coffee Break |
| 8:45 a.m.–9:00 a.m. | Computer Simulation for Transportation Studies—A Brief HistoryDavid Yang, Ph.D., Office of Operations R&D, FHWA |
| 9:00 a.m.–12:00 p.m. | Overview and Development of Agent-Based Modeling and SimulationCharles Macal, Ph.D., Argonne National Laboratory Agent-Based Modeling With Repast Simphony Including a Consumer Products Modeling ExampleMichael North, Ph.D., Argonne National Laboratory Using Pattern-Oriented Modeling in Developing the Agent-Based Model of Hawaii's Longline FisheryRun Yu, Ph.D., University of Hawaii/Apple Inc. Predicting Pandemic Disease Spread in Urban Environments With Agent-Based SimulationDionne Aleman, Ph.D., University of Toronto Agent-Based Modeling of Transportation SystemsWilliam Rand, Ph.D., University of Maryland |
| 12:00 p.m.–1:15 p.m. | Lunch |
| 1:15 p.m.–2:30 p.m. | Small Group DiscussionGroup 1: Key Technical Gaps to Overcome Facilitated by Randy VanGorder Group 2: Challenges of Incorporating ABMS in Transportation Facilitated by Deborah Curtis Group 3: Potential Applications of ABMS in Transportation Facilitated by David Yang |
| 2:30 p.m.–4:00 p.m. | Present Findings/Recommendations from Small GroupsAdjournment |
C. Y. David Yang, Ph.D.
Office of Operations R&D
Turner-Fairbank Highway Research Center
Federal Highway Administration
202-493-3284
david.yang@dot.gov
David Kuehn
Exploratory Advanced Research Program
Turner-Fairbank Highway Research Center
Federal Highway Administration
202-493-3414
david.kuehn@dot.gov
For more information visit /advancedresearch/index.cfm
Office of Operations R&D
Turner-Fairbank Highway Research Center
6300 Georgetown Pike
Publication No. FHWA-HRT-11-036
HRTM-30/07-11(1M)E
McLean, VA 22101-2296

