Effects of Inlet Geometry on Hydraulic Performance of Box Culverts
CHAPTER 5. EXPERIMENTAL PROCEDURES
MINIFLUME EXPERIMENTS
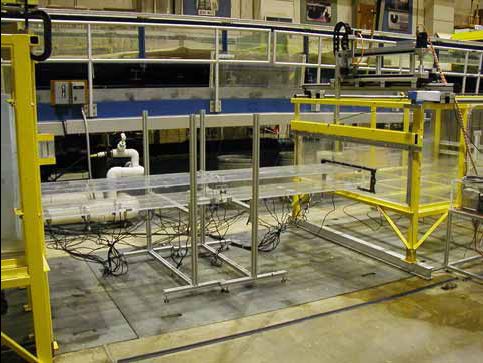
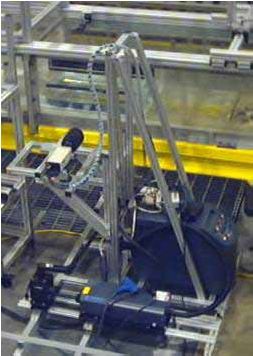
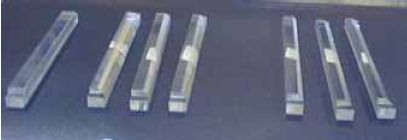
A miniflume was used to conduct experiments to optimize the bevel edges of the wing walls and top edges using two-dimensional PIV. The miniflume was 2800 millimeters (mm) (109.2 inches) long and 450 mm (17.6 inches) wide (figure 27). The culvert model and bevel models (figure 28) were constructed with Plexiglas to avoid reflections. The scale of the models was 1:30. The upstream flow conditioning was achieved using filter mats and honeycomb flow straighteners. The sidewalls of the flume were made of glass, allowing excellent flow visibility. The flow discharge could be varied between 0 and 5 liters per second (L/s) (0 and 1.32 gallons per second (gal/s)). An ultrasonic distance meter measured the flow depth. An electromagnetic velocity probe measured the approach velocity.
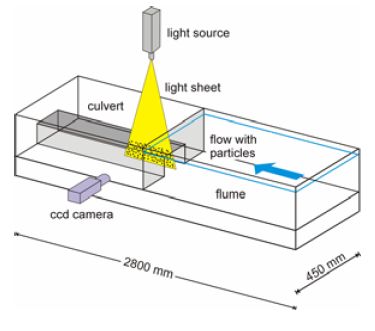
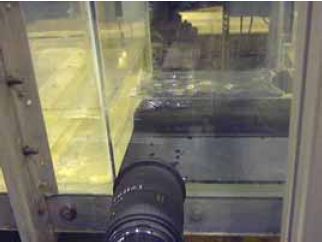
A two-dimensional PIV system typically consists of several subsystems. In most applications, tracer particles are added to the flow. These particles are illuminated in a plane of the flow at least twice within a short time interval. The light scattered by the particles is recorded either on a single frame or on a sequence of frames. The displacement of the particle images between the light pulses is determined using cross correlation techniques. In this study, the camera, a charge coupled device (ccd) camera, used for PIV recordings, was a Roper Scientific MEGAPLUS® Model ES1.0 digital camera. The camera was a stand-alone device connected to a frame grabber card (NI PXI 1422) by a PXI computer. To generate the light sheet, a double-pulsed Solo PIV 120 laser was used. The Solo PIV 120 laser is a compact, dual laser head system designed to provide a highly stable green light source for PIV applications.
Figure 27. Diagram and Photo. Miniflume and PIV setup.
a.
|
b.
|
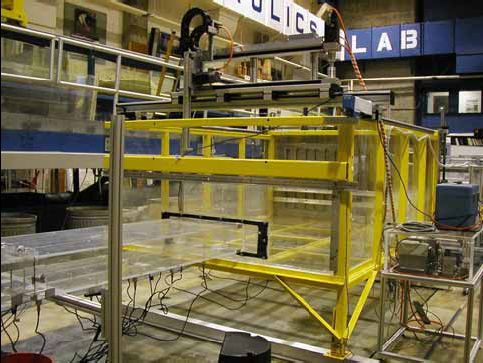
Figure 28. Photos. Bevel models and PIV camera at culvert entrance.
a.
|
b.
|
PIV–Post Processing
The evaluation of the two-dimensional PIV data results in instantaneous velocity vectors of the flow field. To study the contracted area in the culvert, it was useful to integrate the velocity fields resulting in stream function and potential function. The integration is based on the assumption that the integrand, which is the flow field, is two-dimensional as well as incompressible. In this case, potential theory relates the velocity field, U = (U (X,Y), V (X,Y)), to the stream function Ψ, which can be integrated over the domain (X,Y plane) as shown in figure 29. Fifty double-image frames were recorded to correlate 50 velocity flow field samples. The integration procedure for the stream functions was applied by taking the average of the velocity flow field sequence.
Seven different bevel edge conditions were tested for the miniculvert setup (figure 30). The criterion to determine the best bevel performance was the contracted distance outside the viscous boundary layer (effective flow depth at vena contracta).
Figure 29. Diagram. Integration of velocity flow field in stream functions to study culvert flow contraction.
Figure 30. Diagrams. Tested bevel edge conditions and effective flow depth criterion.
| a. | b. |
| |
| c. | d. |
| |
| e. | f. |
| |
| g. | h. |
| |
| 1 inch = 2.54 cm |
CULVERT SETUP EXPERIMENTS
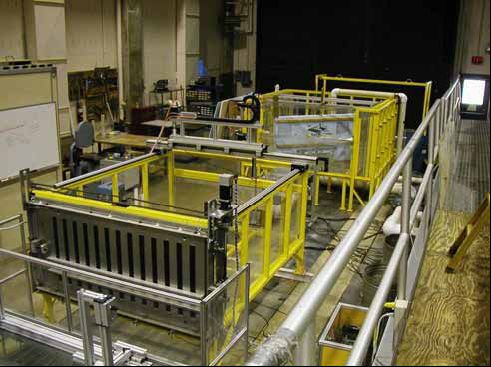
The culvert setup consists of two water tanks (a headbox 2.44 m (8 ft) long by 2.44 m (8 ft) wide by 1.22 m (4 ft) high and a tailbox 2.44 m (8 ft) long by 1.83 m (6 ft) wide by 0.92 m (3 ft) high) that were connected to the tested culvert barrel (figures 31 to 34). Five electronic pressure sensors were integrated into the bottom floor of the head and tailbox. An additional 40 pressure sensors measured the hydraulic grade line inside the culvert model barrels. The side rails of the tailbox supported a two-dimensional robot to measure the velocity distribution inside the tailbox (figure 35). The robot was automated to measure an area perpendicular to the main flow direction. A laser distance sensor recorded the position of the robot in the flow direction. An automated tailgate at the downstream end of the tailbox allowed for adjustment of the tailwater depth. The culvert setup was fully automated (pump/flowmeter and tailgate/pressure sensor control logic) and was network controlled.
The experimental setup was based on flow being in alignment with the barrels. The barrels were tested for two different slope settings (3 percent and 0.7 percent). The purpose of the steep slope (3 percent) was to guarantee inlet control conditions. The flat (0.7 percent) slope was designed to simulate outlet control conditions and was controlled by the adjustable tailgate. The pressure sensors in the culvert barrel were evaluated for subcritical flow for each outlet control test run. If this was not the case, the tailgate was lowered until outlet control conditions were achieved. The velocity distribution at the exit of the culvert was also measured for each outlet control test run using an electromagnetic velocity probe mounted on a two-dimensional robot in the tailbox. Conclusions based on the recorded velocity distribution were made about the flow distribution in the barrels.
Figure 31. Diagram. Culvert setup–side view.
Figure 32. Diagram. Culvert setup–top view.
Figure 33. Photo. Culvert setup–overview.
Figure 34. Photo. Culvert model barrels.
Figure 35. Photo. Two-dimensional robot to measure velocity distribution in tailbox.
Inlet and Culvert Barrel Models
All barrels used for the tests were fabricated out of Plexiglas consisting of two 155.58-cm (61.25-inch) sections. Tapped holes for the pressure sensors were placed every 28.78 cm (11.33 inches) on the bottom side of the culvert model barrels. Special holes on the top and bottom of the barrels provided a mounting for the corner fillets. Two sets of model fillets (1.27 and 2.54 cm (0.5 and 1 inch)) were fabricated using polyvinyl chloride (PVC) material.
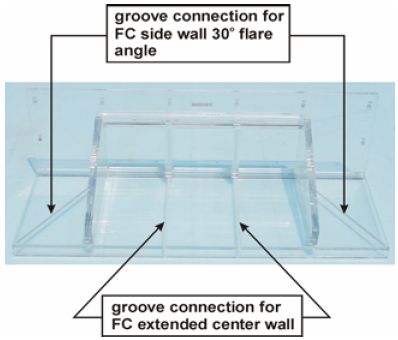
The inlet models were designed to consist of modular parts (wingwalls, center walls, top plates) that were easily changed for various configurations. Tongue and groove connectors were used to assemble the models (figure 36).
Overviews of models tested in the culvert setup are listed in appendix A.
Figure 36. Photo. Groove connectors to assemble models.
Previous | Contents | Next
|