U.S. Department of Transportation
Federal Highway Administration
1200 New Jersey Avenue, SE
Washington, DC 20590
202-366-4000
Federal Highway Administration Research and Technology
Coordinating, Developing, and Delivering Highway Transportation Innovations
| REPORT |
| This report is an archived publication and may contain dated technical, contact, and link information |
|
| Publication Number: FHWA-HRT-15-063 Date: March 2017 |
Publication Number: FHWA-HRT-15-063 Date: March 2017 |
FWD test information, sensor location, peak stress, peak load, and peak deflection for Waverly road test near Lansing, MI, at section 1 and 3 are shown in table 67 and table 68, respectively.
Table 67. FWD Test information from station 1 (afternoon test).
| Contact Radius 5.9 | Morning Test | Afternoon Test | Evening Test | |||||||||||
|---|---|---|---|---|---|---|---|---|---|---|---|---|---|---|
| Drop 1 | Drop 2 | Drop 3 | Drop 4 | Drop 1 | Drop 2 | Drop 3 | Drop 4 | Drop 1 | Drop 2 | Drop 3 | Drop4 | |||
| Stress (psi) | 57.9 | 86.3 | 111.7 | 147.5 | 54.9 | 83.7 | 108.2 | 142.9 | 55.0 | 83.7 | 108.2 | 142.9 | ||
| Force (kip) | 6.33 | 9.46 | 12.23 | 16.15 | 6.01 | 9.16 | 11.86 | 15.65 | 6.01 | 9.16 | 11.86 | 15.65 | ||
| Sensors location (inches) |
Deflection (mil) | |||||||||||||
| D1 | 0 | 12.7 | 19.8 | 26.2 | 34.8 | 15.2 | 24.2 | 32.5 | 44.1 | 15.2 | 24.2 | 32.5 | 44.1 | |
| D2 | 8 | 9.8 | 15.3 | 20.4 | 27.3 | 10.9 | 17.4 | 23.4 | 31.8 | 10.9 | 17.4 | 23.4 | 31.8 | |
| D3 | 12 | 8.2 | 12.9 | 17.3 | 23.1 | 8.4 | 13.6 | 18.3 | 25.0 | 8.4 | 13.6 | 18.3 | 25.0 | |
| D4 | 18 | 5.9 | 9.5 | 12.8 | 17.2 | 5.7 | 9.4 | 12.8 | 17.5 | 5.7 | 9.4 | 12.8 | 17.5 | |
| D5 | 24 | 4.4 | 7.1 | 9.6 | 13.0 | 4.1 | 6.8 | 9.3 | 12.8 | 4.1 | 6.8 | 9.3 | 12.8 | |
| D6 | 36 | 2.6 | 4.1 | 5.6 | 7.7 | 2.4 | 3.9 | 5.4 | 7.5 | 2.4 | 3.9 | 5.4 | 7.5 | |
| D7 | 48 | 1.7 | 2.6 | 3.6 | 4.9 | 1.6 | 2.5 | 3.5 | 4.8 | 1.5 | 2.5 | 3.4 | 4.8 | |
| D8 | 60 | 1.1 | 1.9 | 2.6 | 3.5 | 1.1 | 1.8 | 2.4 | 3.4 | 1.1 | 1.8 | 2.4 | 3.4 | |
Table 68. FWD Test information from station 3 (afternoon test).
| Contact Radius 5.9 | Morning Test | Afternoon Test | Evening test | ||||||||||||
|---|---|---|---|---|---|---|---|---|---|---|---|---|---|---|---|
| Drop 1 | Drop 2 | Drop 3 | Drop 4 | Drop 1 | Drop 2 | Drop 3 | Drop 4 | Drop 1 | Drop 2 | Drop 3 | Drop 4 | ||||
| Stress (psi) | 57.3 | 85.6 | 111.0 | 145.6 | 54.5 | 82.5 | 107.3 | 141.9 | 54.5 | 82.5 | 107.3 | 54.5 | |||
| Force (kip) | 6.28 | 9.37 | 12.16 | 15.95 | 5.98 | 9.04 | 11.75 | 15.54 | 5.98 | 9.04 | 11.75 | 15.54 | |||
| Sensors location (inches) |
Deflection (mil) | ||||||||||||||
| D1 | 0 | 14.7 | 22.2 | 29.2 | 38.7 | 16.9 | 25.7 | 34.1 | 45.5 | 16.9 | 25.7 | 34.1 | 45.5 | ||
| D2 | 8 | 11.8 | 17.9 | 23.4 | 30.9 | 12.7 | 19.4 | 25.7 | 34.2 | 12.7 | 19.4 | 25.6 | 34.2 | ||
| D3 | 12 | 9.9 | 15.0 | 19.8 | 26.1 | 10.2 | 15.8 | 21.0 | 27.9 | 10.2 | 15.8 | 21.0 | 27.9 | ||
| D4 | 18 | 7.3 | 11.2 | 14.7 | 19.6 | 7.0 | 11.0 | 14.7 | 19.7 | 7.0 | 11.0 | 14.7 | 19.7 | ||
| D5 | 24 | 5.3 | 8.2 | 10.9 | 14.6 | 5.0 | 7.8 | 10.5 | 14.2 | 5.0 | 7.8 | 10.5 | 14.2 | ||
| D6 | 36 | 3.0 | 4.6 | 6.2 | 8.3 | 2.7 | 4.3 | 5.8 | 7.9 | 2.7 | 4.3 | 5.8 | 7.9 | ||
| D7 | 48 | 1.8 | 2.8 | 3.9 | 5.2 | 1.7 | 2.6 | 3.6 | 4.9 | 1.7 | 2.6 | 3.6 | 4.9 | ||
| D8 | 60 | 1.2 | 2.0 | 2.7 | 3.7 | 1.1 | 1.8 | 2.5 | 3.5 | 1.1 | 1.8 | 2.5 | 3.5 | ||
Temperatures along the depth of the pavement were recorded each time the FWD test was performed. Variation in temperature along the depth at section 1 and section 3 at three FWD tests are shown in table 69 and table 70, respectively.
Table 69. Temperature profile at section 1.
| Time (h:min) | Temperature for Actual Depth (°F) | Remarks | |||||
|---|---|---|---|---|---|---|---|
| 0 inches |
2 inches |
4 inches |
6 inches |
8 inches |
10 inches |
||
| Morning 9:40 | 63.1 | 61.0 | 59.7 | 59.2 | 59.2 | 59.4 | Cloudy |
| Afternoon14:05 | 90.0 | 83.8 | 74.8 | 68.5 | 65.1 | 62.8 | Cloudy |
| Evening 19:05 | 91.6 | 90.0 | 85.1 | 79.9 | 75.7 | 72.1 | Cloudy |
| Temperature holes 5 ft behind FWD load (north). | |||||||
Table 70. Temperature profile at section 3.
| Time (h:min) | Temperature for Actual Depth (°F) | Remarks | |||||
|---|---|---|---|---|---|---|---|
| 0 inches |
2 inches |
4 inches |
6 inches |
8 inches |
10 inches |
||
| 10:15 | 68.7 | 64.0 | 60.3 | 59.2 | 58.5 | 58.3 | Cloudy |
| 14:40 | 87.1 | 81.1 | 73.4 | 69.3 | 65.7 | 63.1 | Cloudy |
| 19:45 | 82.6 | 83.7 | 80.2 | 77.0 | 73.8 | 70.3 | Cloudy |
| Temperature holes 10 ft behind FWD load (north). | |||||||
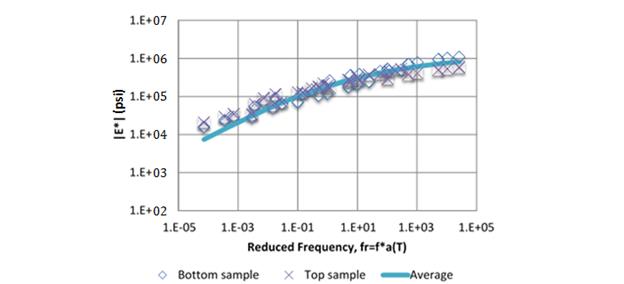
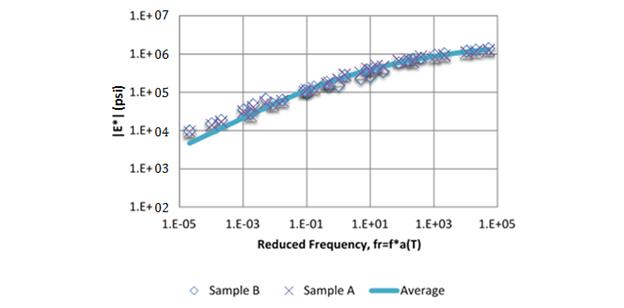
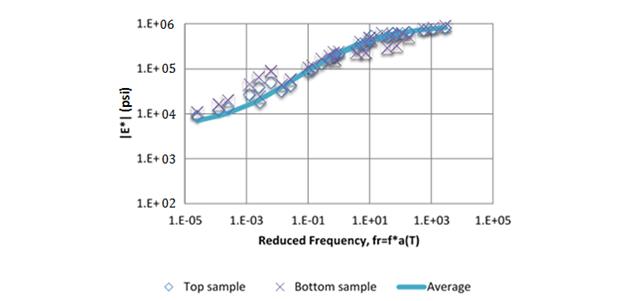
Figure 354 through figure 356 present graphs of the laboratory-measured results for Waverly Road using different sample sizes.

Figure 354. Graph. Laboratory-measured dynamic modulus at station 1 using 1.5- by 3.94‑inch samples.

Figure 355. Graph. Laboratory-measured dynamic modulus at station 1 using 3.94- by 5.9‑inch samples.

Figure 356. Graph. Laboratory-measured dynamic modulus at station 3 using 1.5- by 3.94‑inch samples.