U.S. Department of Transportation
Federal Highway Administration
1200 New Jersey Avenue, SE
Washington, DC 20590
202-366-4000
Federal Highway Administration Research and Technology
Coordinating, Developing, and Delivering Highway Transportation Innovations
 |
| This report is an archived publication and may contain dated technical, contact, and link information |
|
Publication Number: FHWA-HRT-08-056 Date: November 2008 |
This appendix contains a catalog of problems commonly encountered by LTPP operators when collecting and reviewing profile data. Knowledge of these problems will help operators to collect more accurate and valid profile data for the LTPP program. These commonly encountered problems can be grouped into the following four categories:
A brief description of each of these problems is presented in this appendix along with plots illustrating such conditions. To detect most of these problems, the profile data in question must be compared to those collected during the previous site visit (see section 2.2.8). This requires that profile data from the previous site visit be available. Furthermore, in order to perform an accurate and valid comparison, profile data from the previous site visit must be error free. Descriptions and references made later in this appendix to the profile data comparisons assume that data from the previous site visit are error free.
Spikes can be introduced in the profile data as a result of equipment problems. These spikes can be identified by comparing multiple profile runs at a section. Accordingly, once a set of profile runs has been collected, the operator should compare the data from the repeat runs using the multi run plot option in ProQual (see reference 6). This comparison should be performed separately for the left, right, and center path profile data. Figure 94 illustrates the presence of a spike in the profile data. This figure shows five profile runs collected on the left wheel path. The profile data for run 4 indicates a spike that is not present in the other four runs. Profile data for run 4 has been offset in figure for clarity; in the ProQual multi run plot option, these repeat profile runs are color-coded (i.e., different color for each run). Since the spike only occurs in one run of the data set, it is possible that this spike may not have been caused by a pavement feature. When such a condition is encountered, the operator should determine if the spike is due to an equipment problem or if it is a pavement feature.
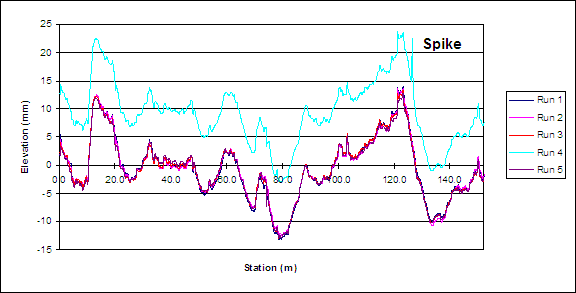
Figure 94. Graph. Spike in profile data (profile data for run 4 has been offset for clarity).
A miscalibrated DMI cannot be detected by comparing the five repeat profile runs obtained during a site visit. However, when those runs are compared with the profile runs collected during the previous site visit, the profile (elevation versus distance) plot for the more recently collected data will appear squeezed or stretched in the x (distance) direction if the vehicle has a miscalibrated DMI. The comparison of the current and the previous profile data should be carried out using the multi visit plot option in ProQual (see reference 6). An example of profile data associated with a miscalibrated DMI is shown in figure 95 ; data for May 2, 1990, was collected using a miscalibrated DMI.
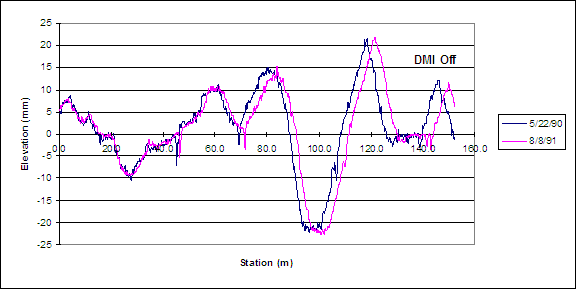
Figure 95. Graph. Data collected with a correctly calibrated and a miscalibrated DMI.
When this problem is encountered, the operator should check tire pressure of vehicle to ensure it is at the values at which the DMI was calibrated. If the current tire pressure is different, the operator should adjust tire pressure so it matches tire pressure when the DMI was calibrated, and obtain a new set of measurements at the section. If the difference in the distance between the current data and previous data at the end of the section is less than or equal to 0.5 m for a GPS section, the current data set is considered to be acceptable. If the difference in the distance between the current data and the previous data is greater than 0.5 m, the operator should determine if the difference is occurring because the DMI is incorrect during the current visit or if it was incorrect during the previous visit. The following procedures can be used by the operator to make this determination:
For SPS sites differences between runs can occur because of wheel path wander. This effect will usually be more pronounced in the sections that are located towards the end of the SPS section. When comparing profile data between two site visits at SPS sections, close attention should be paid to the first two sections in the SPS site. If the profile for the current data and the previous site visit data satisfies the criteria that were described previously at the first two sites, it can be concluded that the DMI is functioning correctly for the current visit. In such a case, a difference in distance of up to 1 m can be considered to be acceptable for the other sections in the SPS project.
An early profile start can occur when the photocell triggers a reference reset prior to the start of the test section. It is possible for all repeat profile runs during a site visit to have the same starting location, with all runs having an early start. This problem can occur if there is a mark on the pavement that triggers data collection to start at the same location, but this location is before the beginning of the test section. When the current profile data are compared with those collected during the previous site visit, the early start problem can be easily identified by a clear shift in the two profile data sets. This profile comparison should be carried out using the multi visit plot option of ProQual (see reference 6). The early start problem is illustrated in figure 96 , which shows the profile plot for a single run along the left wheel path conducted on three different dates—April 8, 1990; October 18, 1990; and August 10, 1994. The profile plot for the last two dates have similar start locations, but that for the earlier date (April 8, 1990) is shifted to the left because of an early start. If the early start problem is caused by a mark on the pavement that is located prior to the pavement section, the operator can use the horizontal photocell to initiate data collection.
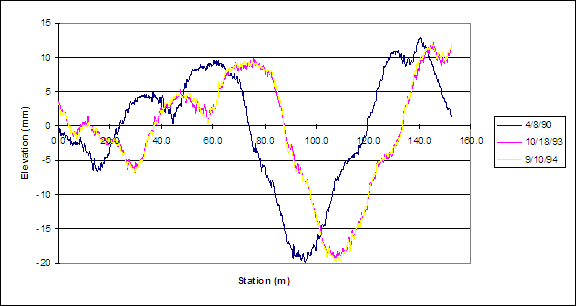
Figure 96. Graph. Example of early profile start.
The early start problem can also occur in one or more runs within a profile data set collected during a single site visit. This problem can be easily identified by comparing the repeat profiler runs using the multi run plot option in ProQual; one or more of runs will be shifted to left of the others if there is an early start. Although a plot illustrating the early start problem within a set of repeat runs is not included in this appendix, that plot will be very similar to that shown in figure 96. If an early start is detected in one or more profile runs, the operator should perform additional profile runs until a set of error free data (meeting the criteria described in section 2.2.8) is obtained. If the early start problem is caused by a mark on the pavement that is located prior to the pavement section, the operator can use the horizontal photocell to initiate data collection.
The term "different profiles" is used to describe the occurrence of the following conditions:
(a) when the operator compares repeat profile runs collected during a single site visit, no problems are observed in the data (i.e., error free) and (b) when the operator compares current data with that from previous site visit (also error free), the two sets of profiles appear to be different.
Such condition can be caused by rehabilitation or maintenance activities to the section between profiler site visits. It can also occur when the location of test section is incorrectly selected during one of the site visits.
Figure 97 illustrates the case where rehabilitation has been performed on a test section between site visits. This figure shows a plot of the left wheel path profile obtained on two separate site visits—September 10, 1991 and October 4, 1994. The two profiles shown in this plot are completely different. In this particular example, the profile differences were caused by an overlay that was placed on the section some time between the two site visits. When the location of the test section has been incorrectly selected during one of the site visits, differences in profile similar to those shown in figure 97 will be seen.
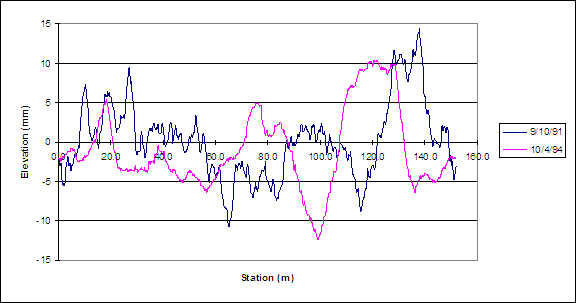
Figure 97. Graph. Differences in profile due to rehabilitation of section.
If a case such as that shown in figure 97 is encountered, the operator should first verify that the test section location is correct. If such a condition is encountered at a SPS section or at a GPS section that was profiled in conjunction with a SPS section, the operator should verify that the stationing used for subsectioning is correct. If evidence of rehabilitation is noted at the section, it should be entered as an Operator Comment and also noted in the form Status of Regions Test Sections.
An example where maintenance has occurred at a test section between site visits is illustrated in figure 98 . This figure shows a plot of the left wheel path profile obtained on two separate site visits—August 8, 1991, and August 5, 1992. This plot shows the profile at the beginning of the test section for the two site visits are different, indicating possible maintenance at the test section.
If a case such as that shown in figure 98 is encountered, the operator should look to see if there is evidence of maintenance activities, such as patching is present within the test section. If evidence of maintenance is found, the operator should indicate that maintenance has been performed on the test section in the Operator Comment Field (e.g., POSSIBLE MAINTENANCE IN SECTION) and also note it in the Status of Regions Test Sections form.
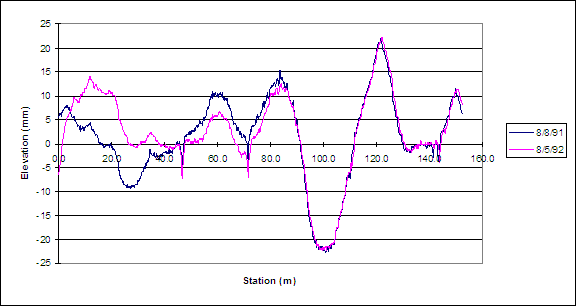
Figure 98. Graph. Differences in profile due to maintenance within section.
| << Previous | Contents | Next >> |