U.S. Department of Transportation
Federal Highway Administration
1200 New Jersey Avenue, SE
Washington, DC 20590
202-366-4000
Federal Highway Administration Research and Technology
Coordinating, Developing, and Delivering Highway Transportation Innovations
 |
| This report is an archived publication and may contain dated technical, contact, and link information |
|
Publication Number: FHWA-HRT-08-057 Date: November 2008 |
Using the E-FROST research analysis tool, all previously processed sections with ER data were reprocessed using the enhanced analysis methodology presented in chapter 4, and new frost depths and layer estimates were determined. In addition to the reinterpretation of the previously processed data, all SMP II sections with ER data that had not been previously analyzed were analyzed using E-FROST, and new frost depths and layer estimates were prepared for the LTPP database upload. The analysis results, as well as the LTPP computed parameters developed under this project, were reviewed thoroughly.
Frost penetration analysis was conducted for 41 LTPP sites from the SMP I and II experiments. The schematic location of LTPP sites used in the frost penetration analysis study is shown in figure 21. Data from 21,953 dates were analyzed, and frost penetration depths were estimated. There were between 2 and 11 years of data analyzed for the different LTPP sites. Detailed frost penetration results were reported in two LTPP computed parameters tables discussed later in this chapter.
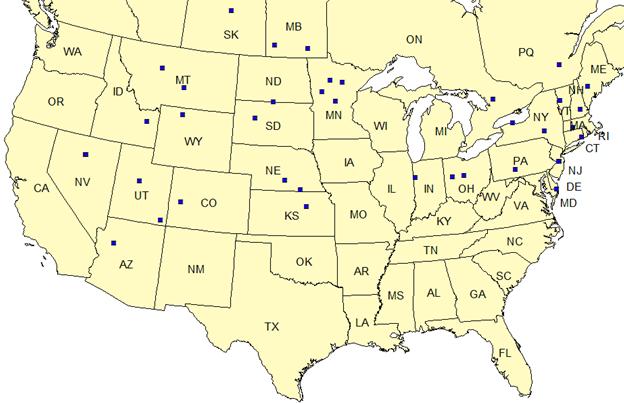
Figure 20. Picture. Locations of LTPP SMP sites analyzed in this study.
Observations discovered during the project are described in this section.
Using the results of the frost penetration analysis, average and maximum frost depths were determined, along with the first and the last cold month with freeze conditions for each LTPP site with in-situ measurement data. This information could be used to assess the severity of frost penetration at different LTPP sites.
Maximum freeze depth corresponds to the maximum frost depth for the year with the deepest frost penetration detected during the analysis. Maximum frost depth is used in the design to account for the worst case scenario.
Average maximum freeze depth corresponds to the average of maximum frost depths based on all years used in the analysis and represents average or typical frost penetration conditions.
The first and the last months with freeze conditions are based on the worst case scenario. These months were determined by reviewing frost data for all available years and selecting the earliest month at the beginning of the freeze period and the latest months at the end of the freeze period. A summary of frost determinations is provided in table 6.
Frost penetration profiles generated for all Minnesota, Manitoba, and Saskatchewan sites and site 4018 in New York indicate that frost penetration goes beyond the last interpretation depth. For Arizona site 1024 and Nevada site 0101, the first interpretation depth was lower than the expected frost penetration depth. These cases are noted by starred comments in table 6.
| STATE CODE | SHRP ID | Number of years analyzed | Average max freeze depth, m | Maximum freeze depth, m | First freeze month | Last freeze month |
| 4 (AZ) | 1024 | 4 | * | * | -- | -- |
| 8 (CO) | 1053 | 5 | 0.336 | 0.374 | DEC | FEB |
| 9 (CT) | 1803 | 5 | 0.544 | 0.794 | JAN | MAR |
| 16 (ID) | 1010 | 5 | 0.763 | 0.864 | NOV | FEB |
| 18 (IN) | 3002 | 4 | 1.036 | 1.213 | DEC | FEB |
| 20 (KS) | 4054 | 4 | 1.056 | 1.056 | JAN | FEB |
| 23 (ME) | 1026 | 5 | 1.107 | 1.819 | NOV | APR |
| 24 (MD) | 1634 | 4 | 0.436 | 0.436 | FEB | FEB |
| 25 (MA) | 1002 | 2 | 1.017 | 1.017 | JAN | MAR |
| 27 (MN) | 1018 | 5 | 1.791 | 2.181*** | NOV | APR |
| 27 (MN) | 1028 | 5 | 2.275 | 2.386*** | NOV | APR |
| 27 (MN) | 4040 | 5 | 1.900 | 2.317*** | NOV | MAY |
| 27 (MN) | 6251 | 10 | 2.126 | 2.308*** | NOV | APR |
| 30 (MT) | 0114 | 5 | 1.165 | 1.256 | NOV | MAR |
| 30 (MT) | 8129 | 6 | 0.793 | 1.082 | NOV | MAR |
| 31 (NE) | 0114 | 7 | 0.844 | 1.173 | DEC | MAR |
| 31 (NE) | 3018 | 9 | 1.289 | 1.679 | DEC | MAR |
| 32 (NV) | 0101 | 6 | ** | ** | — | — |
| 32 (NV) | 0204 | 2 | 0.612 | 0.612 | DEC | JAN |
| 33 (NH) | 1001 | 5 | 0.954 | 1.394 | DEC | MAR |
| 34 (NJ) | 0504 | 3 | 0.406 | 0.406 | JAN | FEB |
| 34 (NJ) | 0505 | 3 | 0.458 | 0.458 | JAN | FEB |
| 34 (NJ) | 0506 | 3 | 0.608 | 0.608 | JAN | FEB |
| 34 (NJ) | 0507 | 3 | 0.455 | 0.455 | JAN | JAN |
| 34 (NJ) | 0902 | 3 | 0.643 | 0.668 | JAN | FEB |
| 36 (NY) | 0801 | 10 | 0.627 | 0.988 | DEC | MAR |
| 36 (NY) | 4018 | 5 | 1.090 | 2.102*** | DEC | APR |
| 39 (OH) | 0204 | 2 | 0.705 | 0.705 | JAN | JAN |
| 39 (OH) | 0901 | 6 | 0.704 | 0.776 | DEC | FEB |
| 42 (PA) | 1606 | 8 | 0.568 | 0.771 | DEC | MAR |
| 46 (SD) | 0804 | 9 | 1.445 | 1.998 | NOV | APR |
| 46 (SD) | 9187 | 4 | 1.243 | 1.827 | NOV | APR |
| 49 (UT) | 1001 | 5 | 1.557 | 2.019 | DEC | DEC |
| 49 (UT) | 3011 | 5 | 0.553 | 0.692 | DEC | FEB |
| 50 (VT) | 1002 | 10 | 1.020 | 1.498 | NOV | APR |
| 56 (WY) | 1007 | 5 | 0.741 | 0.999 | NOV | MAR |
| 83 (MB) | 1801 | 11 | 2.033 | 2.13*** | OCT | MAY |
| 83 (MB) | 3802 | 6 | 1.798 | 2.424*** | NOV | MAY |
| 87 (ON) | 1622 | 5 | 1.194 | 1.743 | NOV | APR |
| 89 (QC) | 3015 | 9 | 1.316 | 1.587 | NOV | MAY |
| 90 (SK) | 6405 | 6 | 1.999 | 2.058*** | OCT | MAY |
1 m = 3.28 ft
— No data available.
* First interpreted depth at 0.38 m.
** First interpreted depth at 0.51 m.
*** Possibility of frost beyond the last interpreted depth.
Using frost estimates computed based on in-situ data, frost penetration profiles were analyzed for each of the 41 LTPP sites for all available years of data. The changes in frost profiles over the cold seasons (fall, winter, and spring) were examined for each available year. The review indicated that even for similar frost depths, the observed profiles varied from site to site and year to year. Hence, knowledge of the maximum frost depth without an understanding of seasonal changes in frost penetration profile would not be enough for accurate characterization of seasonal changes in pavement structural characteristics.
Some of the commonly observed frost penetration profile characteristics were multiple freeze thaw cycles, shallow fall freeze with thaw followed by solid deep freeze with a spring thaw, and solid freeze with spring thaw and refreeze. Figure 21 through figure 23 show examples of each of these commonly observed frost penetration profiles.
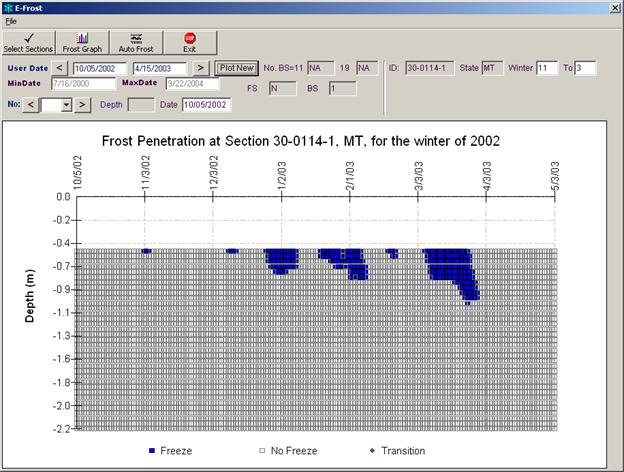
Figure 21. Chart. Frost penetration profile showing multiple freeze-thaw cycles.
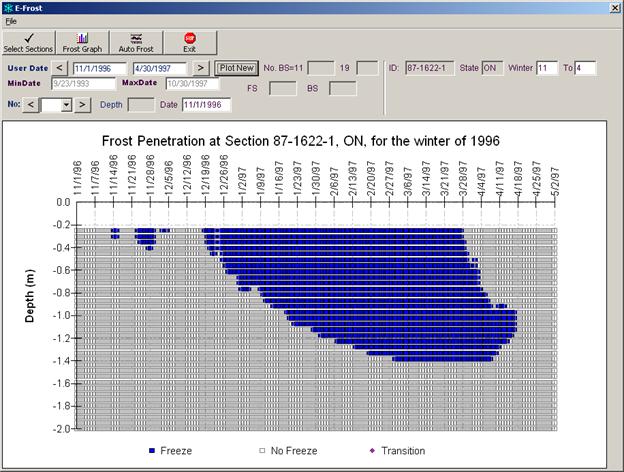
Figure 22. Chart. Frost penetration profile showing shallow freeze cycles in the fall followed by solid deep freeze with spring thaw.
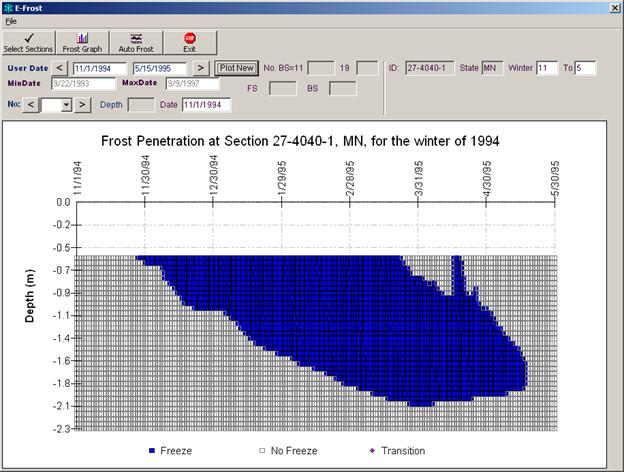
Figure 23. Chart. Frost penetration profile showing solid freeze with partial spring thaw and refreeze.
Table 7 summarizes typical frost penetration characteristics observed for each SMP site. To describe frost penetration profile characteristics, frost depth was characterized as shallow, medium, or deep. A shallow frost depth was defined between 0 m and 0.6 m (0 ft and 1.97 ft); a medium frost depth was defined between 0.6 m and 0.9 m (1.97 ft and 2.95 ft); and a deep frost depth was defined for frost that penetrated 0.9 m (2.95 ft) or more. Since these definitions are subjective, the seasonal maximum frost depth is also reported in the table for each site. Furthermore, the depth of the top of the first unbound layer was different for each SMP site, which occasionally limited frost determination at shallow and medium depths where the first unbound layer was placed below the expected freeze depth. The information in table 7 could be used to infer the typical frost penetration characteristics for LTPP SMP sites.
| State or province | State code | SHRP ID | #of years w/ data | Frost profile description | ||
| Fall (Sept 21–Dec 21) | Winter (Dec 22–Mar 20) | Spring (Mar 21–June 21) | ||||
| Arizona | 4 | 1024 | 3 | No Freeze* | No Freeze* | No Freeze* |
| Colorado | 8 | 1053 | 3 | No Freeze | Multiple Shallow Freeze-Thaw Cycles (up to 0.37 m) | No Freeze |
| Connecticut | 9 | 1803 | 4 | No Freeze | Shallow or Medium freeze-thaw (up to 0.79 m) | No Freeze |
| Idaho | 16 | 1010 | 3 | Possible Medium Freeze-Thaw Re-freeze (up to 0.66 m) | Multiple Shallow or Medium Freeze-Thaw Cycles (up to 0.86 m) | No Freeze |
| Indiana | 18 | 3002 | 2 | Medium Freeze-Thaw | Multiple Medium to Deep Freeze-Thaw Cycles (up to 1.21 m) | No Freeze |
| Kansas | 20 | 4054 | 3 | No Freeze | Multiple Medium to Deep Freeze-Thaw Cycles (up to 1.06 m) | No Freeze |
| Maine | 23 | 1026 | 4 | Shallow freeze-thaw re-freeze (up to 0.55 m) | Continuous Deep Freeze (up to 1.82 m) | Prolonged Deep Thaw (up to 1.77 m) |
| Manitoba | 83 | 1801 | 9 | Deep Freeze, possibly preceded by Shallow Freeze w/ Thaw (up to 1.72 m) | Continuous Deep Freeze (up to 2.13 m)*** | Deep Freeze, Shallow Thaw followed by Re-freeze, Prolonged Deep Thaw (up to 2.13 m)*** |
| Manitoba | 83 | 3802 | 4 | Deep Freeze (up to 1.31m) | Continuous Deep Freeze (up to 2.42 m)*** | Deep Freeze, Shallow Thaw followed by Re-freeze, Prolonged Deep Thaw (up to 2.42 m)*** |
| Maryland | 24 | 1634 | 4 | No Freeze | Shallow freeze-thaw (up to 0.44 m) | No Freeze |
| Massachusetts | 25 | 1002 | 2 | No Freeze | Deep Freeze w/ Thaw, followed by Medium Freeze w/ Thaw (up to 1.02 m) | No Freeze |
| Minnesota | 27 | 1018 | 4 | Medium to Deep Freeze (up to 1.83 m) | Deep Freeze, Shallow Thaw followed by Re-freeze (up to 2.18 m) | Prolonged Deep Thaw (up to 2.13 m) |
| Minnesota | 27 | 1028 | 3 | Deep Freeze, possibly proceeded by Medium Freeze w/ Thaw. (up to 1.83 m) | Continuous Deep Freeze (up to 2.39 m)*** | Deep Freeze, Possible Shallow Thaw followed by Re-freeze, Prolonged Deep Thaw (up to 2.39 m)*** |
| Minnesota | 27 | 4040 | 3 | Deep Freeze (up to 1.20 m) | Deep Freeze, Possible Shallow Thaw followed by Re-freeze (up to 2.32 m)*** | Prolonged Deep Thaw (up to 2.3 2m)*** |
| State or province | State code | SHRP ID | #of years w/ data | Frost profile description | ||
| Fall (Sept 21–Dec 21) | Winter (Dec 22–Mar 20) | Spring (Mar 21–June 21) | ||||
| Minnesota | 27 | 6251 | 8 | Deep Freeze (up to 1.85 m) | Deep Freeze, Possible Shallow Thaw followed by Re-freeze (up to 2.31 m)*** | Prolonged Deep Thaw (up to 2.31 m)*** |
| Montana | 30 | 0114 | 4 | Multiple Shallow/Medium Freeze-Thaw Cycles or Deep Freeze | Multiple Medium/Deep Freeze-Thaw Cycles or Deep Freeze with Shallow Thaw and Re-freeze (up to 1.26 m) | Possible Deep Freeze and Thaw (up to 0.95 m) |
| Montana | 30 | 8129 | 3 | Medium Freeze (up to 0.83 m) | Multiple Medium/Deep Freeze-Thaw Cycles (up to 1.08 m) | No Freeze |
| Nebraska | 31 | 0114 | 6 | Medium Freeze w/ Thaw (up to 0.67 m) | Multiple Medium/Deep Freeze-Thaw Cycles (up to 1.17 m) | No Freeze |
| Nebraska | 31 | 3018 | 8 | Possible Deep Freeze (up to 1.2 2m) | Deep Freeze (up to 1.68 m) | No Freeze |
| Nevada | 32 | 0101 | 5 | No Freeze** | No Freeze** | No Freeze** |
| Nevada | 32 | 0204 | 1 | No Freeze | Multiple Shallow Freeze-Thaw Cycles (up to 0.61 m) | No Freeze |
| New Hampshire | 33 | 1001 | 4 | Possible Shallow Freeze w/ Thaw (up to 0.33 m) | Multiple Medium/Deep Freeze-Thaw Cycles or Single Deep Freeze (up to 1.39 m) | Possible Thaw (up to 1.19 m) |
| New Jersey | 34 | 0504 | 3 | No Freeze | Multiple Shallow Freeze-Thaw Cycles (up to 0.41 m) | No Freeze |
| New Jersey | 34 | 0505 | 3 | No Freeze | Multiple Shallow Freeze-Thaw Cycles (up to 0.46 m) | No Freeze |
| New Jersey | 34 | 0506 | 2 | No Freeze | Medium Freeze-Thaw (up to 0.61m) | No Freeze |
| New Jersey | 34 | 0507 | 3 | No Freeze | Shallow Freeze-Thaw (up to 0.46 m) | No Freeze |
| New Jersey | 34 | 0902 | 3 | No Freeze | Multiple Shallow/Medium Freeze-Thaw Cycles (up to 0.67 m) | No Freeze |
| New York | 36 | 0801 | 7 | Multiple Shallow Freeze-Thaw Cycles (up to 0.48 m) | Multiple Shallow to Deep Freeze-Thaw Cycles or Single Deep Freeze (up to 0.99 m) | Possible Multiple Shallow Freeze-Thaw Cycles (up to 0.28 m) |
| New York | 36 | 4018 | 4 | No Freeze | Multiple Shallow to Deep Freeze-Thaw Cycles or Single Deep Freeze (up to 2.10 m)*** | Possible Shallow Freeze-thaw or Prolonged Deep Thaw (up to 2.10 m)*** |
| State or province | State code | SHRP ID | #of years w/ data | Frost profile description | ||
| Fall (Sept 21–Dec 21) | Winter (Dec 22–Mar 20) | Spring (Mar 21–June 21) | ||||
| Ohio | 39 | 0204 | 2 | No Freeze | Medium Freeze-Thaw (up to 0.71 m) | No Freeze |
| Ohio | 39 | 0901 | 6 | Possible Medium Freeze (up to 0.57 m) | Multiple (B) Shallow to Medium Freeze-Thaw Cycles (up to 0.78 m) | No Freeze |
| Ontario | 87 | 1622 | 4 | Multiple Shallow Freeze-Thaw Cycles (up to 0.42 m) | Single Deep Freeze or Multiple Deep Freeze-Thaw Cycles (up to 1.74 m) | Possible Shallow Freeze-Thaw, Prolonged Deep Thaw (up to 1.69 m) |
| Pennsylvania | 42 | 1606 | 8 | Multiple Shallow Freeze-Thaw Cycles (up to 0.42 m) | Multiple Shallow to Medium Freeze-Thaw Cycles (up to 0.77 m) | No Freeze |
| Quebec | 89 | 3015 | 6 | Shallow to Medium Freeze-Thaw followed by Deep Freeze (up to 1.03 m) | Deep Freeze, Shallow Thaw followed by Re-freeze (up to 1.54 m) | Prolonged Deep Thaw, Possible Deep Freeze (up to 1.59 m) |
| Saskatchewan | 90 | 6405 | 3 | Shallow Freeze-Thaw, followed by Deep Freeze (up to 1.80 m) | Continuous Deep Freeze (up to 2.06m)*** | Deep Freeze, Multiple Shallow Thaw & deep Re-freeze periods, Prolonged Deep Thaw (up to 2.06 m)*** |
| South Dakota | 46 | 0804 | 7 | Medium Freeze-Thaw, followed by Medium to Deep Freeze (up to 1.24 m) | Deep Freeze, Possible Shallow Thaw followed by Re-freeze (up to 2.00 m) | Deep Freeze, Possible Shallow Thaw followed by Re-freeze, Prolonged Deep Thaw (up to 1.95 m) |
| South Dakota | 46 | 9187 | 2 | Multiple shallow Freeze-Thaw Cycles followed by Medium to Deep Freeze (up to 1.02 m) | Deep Freeze, Multiple Shallow Thaw followed by Re-freeze Cycles up to 1.83 m) | Medium to Deep Freeze, Shallow Thaw & Re-freeze periods, Prolonged Thaw (up to 1.63 m) |
| Utah | 49 | 1001 | 3 | Mid Depth to Deep Freeze (up to 2.02 m) | No Freeze | No Freeze |
| Utah | 49 | 3011 | 3 | No Freeze Period | Multiple Shallow to Medium Freeze-Thaw Cycles (up to 0.69 m) | No Freeze |
| Vermont | 50 | 1002 | 8 | Multiple Shallow to Medium Freeze-Thaw Cycles (up to 0.64 m) | Multiple Shallow to Deep freeze-thaw cycles, Possible Continuous Deep Freeze (up to 1.50 m) | Possible Deep Thaw (up to 1.40 m) |
| Wyoming | 56 | 1007 | 3 | Multiple Shallow Freeze-Thaw Cycles (up to 0.49 m) | Multiple Shallow to Deep Freeze-Thaw Cycles (up to 1.00 m) | No Freeze |
1 m = 3.28 ft
* First interpreted depth at 0.38 m.
** First interpreted depth at 0.51 m.
*** Possibility of frost beyond the last interpreted depth.
The computed maximum frost penetration depths were compared to the historical frost penetration values, as published in the climatic maps developed by NOAA(1) and Environment Canada.(2) Data from the historical maps were interpolated to the LTPP site locations. The results of the comparison are shown in figure 24.
1 m = 3.28 ft
Figure 24. Graph. Comparison of frost penetration depths.
The graph in figure 24 shows a good overall agreement between LTPP and historical maximum frost depth predictions. Some of the differences can be attributed to the fact that, while comparisons are provided for the same region, the historical values are not site-specific and that local variations are possible due to factors such as soil type, moisture content, altitude, and land development. In addition, for Canadian sites, some inaccuracies could result from estimation of frost depth from the freezing index data provided on the climatic map. For the three Canadian sites shown in the upper-right corner on the graph, LTPP frost penetration profiles indicate the possibility of frost beyond the last interpreted depth; however, the full frost depth cannot be established as no LTPP measurements are available at these lower depths.
The extreme frost predictions for U.S. sites provided on the NOAA map are based on longer monitoring period than the LTPP frost predictions; hence, covering more seasons where extreme conditions could occur. Table 8 contains data used in the analysis.
| STATE_CODE | SHRP_ID | Number of years analyzed | LTPP maximum freeze depth, m | Historic maximum freeze depth, m |
| 4 (AZ) | 1024 | 4 | * | 0.250 |
| 8 (CO) | 1053 | 5 | 0.374 | 0.875 |
| 9 (CT) | 1803 | 5 | 0.794 | 1.167 |
| 16 (ID) | 1010 | 5 | 0.864 | 1.125 |
| 18 (IN) | 3002 | 4 | 1.213 | 0.875 |
| 20 (KS) | 4054 | 4 | 1.056 | 0.750 |
| 23 (ME) | 1026 | 5 | 1.819 | 1.792 |
| 24 (MD) | 1634 | 4 | 0.436 | 0.390 |
| 25 (MA) | 1002 | 2 | 1.017 | 1.240 |
| 27 (MN) | 1018 | 5 | 2.181*** | 1.917 |
| 27 (MN) | 1028 | 5 | 2.386*** | 2.042 |
| 27 (MN) | 4040 | 5 | 2.317*** | 2.245 |
| 27 (MN) | 6251 | 10 | 2.308*** | 2.250 |
| 30 (MT) | 0114 | 5 | 1.256 | 1.500 |
| 30 (MT) | 8129 | 6 | 1.082 | 1.500 |
| 31 (NE) | 0114 | 7 | 1.173 | 1.000 |
| 31 (NE) | 3018 | 9 | 1.679 | 1.031 |
| 32 (NV) | 0101 | 6 | ** | 0.600 |
| 32 (NV) | 0204 | 2 | 0.612 | 0.500 |
| 33 (NH) | 1001 | 5 | 1.394 | 1.531 |
| 34 (NJ) | 0504 | 3 | 0.406 | 0.750 |
| 34 (NJ) | 0505 | 3 | 0.458 | 0.750 |
| 34 (NJ) | 0506 | 3 | 0.608 | 0.750 |
| 34 (NJ) | 0507 | 3 | 0.455 | 0.750 |
| 34 (NJ) | 0902 | 3 | 0.668 | 0.750 |
| 36 (NY) | 0801 | 10 | 0.988 | 1.208 |
| 36 (NY) | 4018 | 5 | 2.102*** | 1.208 |
| 39 (OH) | 0204 | 2 | 0.705 | 0.875 |
| 39 (OH) | 0901 | 6 | 0.776 | 0.875 |
| 42 (PA) | 1606 | 8 | 0.771 | 0.938 |
| 46 (SD) | 0804 | 9 | 1.998 | 1.667 |
| 46 (SD) | 9187 | 4 | 1.827 | 1.688 |
| 49 (UT) | 1001 | 5 | 2.019 | 0.625 |
| 49 (UT) | 3011 | 5 | 0.692 | 0.833 |
| 50 (VT) | 1002 | 10 | 1.498 | 1.625 |
| 56 (WY) | 1007 | 5 | 0.999 | 1.475 |
| 83 (MB) | 1801 | 11 | 2.13*** | 2.670 |
| 83 (MB) | 3802 | 6 | 2.424*** | 2.670 |
| 87 (ON) | 1622 | 5 | 1.743 | 1.710 |
| 89 (QC) | 3015 | 9 | 1.587 | 2.130 |
| 90 (SK) | 6405 | 6 | 2.058*** | 2.790 |
1 m = 3.28 ft
* First interpreted depth at 0.38 m.
** First interpreted depth at 0.51 m.
*** Possibility of frost beyond the last interpreted depth.
When comparing the results of the current frost penetration data analysis to the previous results, the following improvements can be noted:
As a result of this data analysis effort, two tables were created for inclusion in the LTPP database. The proposed computed parameter tables (CPT) are based on the existing LTPP frost CPT tables with changes and additions made as a result of the current frost penetration analysis study.
These tables have the same names as in the previous LTPP database releases and are defined as follows:
These new tables contain freeze state interpretations for all the available temperature and ER data collected during the SMP I and II experiments. As such, the intent of these tables is to replace the existing SMP_FREEZE_STATE and SMP_FROST_PENETRATION tables.
Summaries of the information included in the CPT frost tables are provided in table 9 and table 10.
| Data element or parameter | DESCRIPTION |
| STATE code | State code |
| SHRP ID | SHRP identification code |
| SMP date | Date corresponding to SMP data collection |
| Interpretation depth number | Depth number where freeze state is interpreted, increasing from top downward. |
| Interpretation depth | Middepth between electrodes used in the freeze state interpretation, measured for pavement surface; two consecutive electrodes are used in voltage and contact resistance measurements and four in resistivity. |
| Interpreted freeze state | Interpreted freeze state at the interpret depth: F-Freeze, N-No-freeze, T-Transitional (or partial freeze). |
| Interpretation basis | Code indicating the basis for freeze state interpretation: 1. Freeze state based on temperature data using 0 oC freezing isotherm, not forced. 2. Freeze state determined by the analyst after reviewing the temperature, electrical resistivity, and moisture data trends. 3. Temperature data is not available. Freeze state determined by the analyst from ER and moisture. |
| Normalized resistivity | Electrical resistivity of the soil at the measurement depth, relative to the extreme values measured at that depth. |
| Normalized resistance | Electrical resistance of the soil at the measurement depth, relative to the extreme values measured at that depth. |
| Normalized voltage | Voltage drop of the soil at the measurement depth, relative to the extreme values measured at that depth. |
| Soil temperature | Average soil temperature of the day, calculated at the interpretation depth. This could either be based on interpolation of measured values, or derived using EICM. |
| Temperature source | Source of the temperature data used in freeze state interpretation: (1) based on measured, (2) derived using EICM. |
| Filed name | DESCRIPTION |
| STATE code | State code |
| SHRP ID | SHRP identification code |
| SMP date | Date corresponding to SMP data collection |
| Frozen layer | Code for interpreted frozen layer number. A value of zero indicates no frozen layers. |
| Top depth number | Serial number for the starting depth (top) of a frozen layer, increasing from pavement surface downward. |
| Bottom depth number | Serial number for the ending depth (bottom) of a frozen layer, increasing from pavement surface downward. |
| Freeze from | Starting (top) depth (meter) of a frozen layer, measured from the pavement surface. |
| Freeze to | Ending (bottom) depth (meter) of a frozen layer, measured from the pavement surface. |
| << Previous | Contents | Next >> |

