U.S. Department of Transportation
Federal Highway Administration
1200 New Jersey Avenue, SE
Washington, DC 20590
202-366-4000
Federal Highway Administration Research and Technology
Coordinating, Developing, and Delivering Highway Transportation Innovations
| SUMMARY REPORT |
| This summary report is an archived publication and may contain dated technical, contact, and link information |
| Publication Number: FHWA-HRT-16-073 Date: March 2017 |
Publication Number: FHWA-HRT-16-073 Date: March 2017 |
PDF Version (1.34 MB)
HTML Version of Errata for FHWA-HRT-16-073
PDF files can be viewed with the Acrobat® Reader®
As of September 2017, this online document was modified in the following way:
The following changes were made to the document after publication on the Federal Highway Administration website:
| Location | Corrected Values | URL |
| Page 1, top of page | Researchers: Changwei Xu and David Cebon, Department of Engineering, University of Cambridge | /publications/research/infrastructure/pavements/ltpp/16073/index.cfm#errata01 |
| Page 24, “Researchers” section | * “Changewei Xu” has been changed to “Changwei Xu.” | /publications/research/infrastructure/pavements/ltpp/16073/index.cfm#errata02 |
| FHWA Publication No.: FHWA-HRT-16-073 FHWA Contact: Deborah Walker, HRDI-30, 202-493-3068, deborah.walker@dot.gov |
Researchers: Changwei Xu and David Cebon, Department of Engineering, University of Cambridge
This paper investigates the trends of longitudinal and transverse cracking in jointed concrete pavements based on Long-Term Pavement Performance (LTPP) Program Strategic Study of Structural Factors for Rigid Pavements (SPS-2) data. The impacts of slab properties, base type, traffic volume, and environmental factors on the occurrence and extent of longitudinal and transverse cracking were identified from a simple analysis of the raw cracking data. SPS-2 sites in Arizona and Arkansas were chosen to investigate cracking mechanisms in detail. A new hypothesis for the prevalence of premature cracking on these sites was proposed and tested by numerical simulations.
The analysis showed that longitudinal and transverse cracking were more sensitive to slab thickness and base type than other construction variables. Surface cracking was worse in dry climatic zones than wet zones. Most transverse cracks initiated from the slab edge close to the shoulder, and two forms of longitudinal cracks can initiate from transverse edges of slabs: a single long crack or multiple short cracks along the whole section. In addition to inadequate compaction of the base layers during construction and rehabilitation, the major contribution to premature longitudinal cracking appeared to be voiding beneath the outer edge of the pavement. This is caused by localized plastic deformation of “depressurized” soil, which occurs principally due to slab curl.
Premature cracking can severely degrade concrete pavement structures. Many studies have suggested that premature longitudinal cracking is primarily caused by improper construction or rehabilitation practices combined with heavy load repetitions.(1–3) In this report, an alternative mechanism is hypothesized for premature cracking in jointed concrete pavements.
The LTPP SPS-2 project was designed to investigate the effects of design features and site conditions and their interactions on the long-term performance of jointed concrete pavements.(4) All SPS-2 sections were built between 1992 and 1999. The availability and completeness of data for the SPS-2 experiments were studied in 2005.(5) Early trends of some distresses, such as transverse cracking and roughness, were analyzed statistically in several studies.(6–9) However, because the majority of the test sections were quite new at that time, the extent and occurrence of many distresses were low and even reached zero. By 2014, most SPS-2 sections had more than 20 years of service life, and significant cracking was apparent. Many of the sites had extensive environmental and traffic data available. These data were an outstanding source for an investigation of cracking mechanisms in jointed plain concrete pavements.
The aims of the study reported here were to understand the key factors affecting cracking of the SPS-2 sections (including the effects of foundation and slab design over-layers) and investigate the causes of premature cracking in these sections. The general statistics of cracking in all SPS-2 sections were investigated, and then a detailed case study was conducted on sites in Arkansas and Arizona covering wet and dry zones. The initiation, growth, and patterns of cracking were investigated. A new hypothesis for the mechanism of premature longitudinal cracking was proposed, and a finite element model was presented.
The length of longitudinal and transverse cracking is recorded in the LTPP database, and each crack is assigned one of three severity levels.(10) In this study, the sum of crack lengths at all three severity levels (the total length of cracking) was used to assess performance. The mean length of cracking per pavement section (denoted as “mean length of cracking”) was also introduced as a performance metric (i.e., the total length of cracking divided by the number of pavement sections involved).
Figure 1 and figure 2 show the mean length of longitudinal and transverse cracking in all SPS-2 sections as a function of the year post construction for two climatic zones, respectively. Sections in the dry zone cracked sooner and more extensively than those in the wet zone for both longitudinal and transverse cracks. Significant cracks appeared in the dry zones in year 3. Pavements in the wet zones cracked more gradually, with minor transverse cracking from year 4. However, major longitudinal and transverse cracks were only present from about year 8 onward. Maintenance work was performed at various times but particularly in years 10 and 12, when a significant reduction in crack lengths was apparent.
. The green bars and the striped orange bars indicate the mean length of longitudinal cracking (as measured in meters) in all Strategic Study of Structural Factors for Rigid Pavements sections as a function of the year post construction for dry and wet climatic zones respectively.")
Figure 1. Chart. Mean crack length of longitudinal cracking per section for two climatic zones.
Figure 3 and figure 4 show the effects of pavement base type on longitudinal and transverse cracking performance throughout the life of the SPS-2 sections. The SPS-2 sections were constructed with three types of base: dense-graded aggregate base (DGAB), lean concrete base (LCB), and permeable asphalt-treated base (PATB).(4,5) As shown in figure 3 and figure 4, the PATB bases provided pavements with the best cracking resistance. DGAB provides pavements with moderate cracking resistance, while LCB provided pavements with the worst cracking resistance. This conclusion concerning the influence of base type for transverse cracking was also drawn in some earlier studies.(6,5)
. The red bars and the striped blue bars indicate the mean length of transverse cracking (as measured in meters) in all Strategic Study of Structural Factors for Rigid Pavements sections as a function of the year post construction for dry and wet climatic zones respectively.")
Figure 2. Chart. Mean crack length of transverse cracking per section for two climatic zones.
 on longitudinal and transverse cracking performance, throughout the life of the Strategic Study of Structural Factors for Rigid Pavements (SPS-2) sections. In each chart, the horizontal axis shows the year post construction. The vertical axis of the charts on the left side shows the mean length of longitudinal cracking per pavement section (as measured in meters) and the vertical axis of the charts on the right side show the mean length of transverse cracking per pavement section (as measured in meters). The charts in the top row indicate the variations of the cracking for pavements of different base types; the charts in the second row indicate the variations of the cracking for pavements with different slab thickness; the charts in the third row indicate the variations of the cracking for pavements with different slab width; the charts in the bottom row indicate the variations of the cracking for pavements with different slab strength.")
Figure 3. Chart. Mean longitudinal crack length per section over time for three different pavement base types.
In the SPS-2 experiment, two thicknesses of portland cement concrete (PCC) slabs were used: 203-mm (“thin”) slabs and 279-mm (“thick”) slabs.(5) In some sections, large differences may exist between the design and construction values.(5) Figure 5 and figure 6 demonstrate that thicker PCC slabs have better cracking resistance—they develop fewer cracks later in life than the thinner ones.

Figure 4. Chart. Mean transverse crack length per section over time for three different pavement base types.

Figure 5. Chart. Mean longitudinal crack length per section over time for thin PCC slabs and thick PCC slabs.
The SPS-2 pavement sections were constructed with two different slab widths: “standard” slabs of 3.66m and “wide” slabs of 4.27m.(5) Figure 7 and figure 8 show that, on average, the sections with widened PCC slabs developed more extensive longitudinal cracking. Conversely, standard slabs appeared to start cracking transversely earlier in life. Overall, the long-term levels of transverse cracking were approximately the same for both slab widths.
 The black lines with three different marks show the total length of longitudinal cracking in three sections (0213, 0217, 0218) over years from construction. The red line with five different marks show the total length of transverse cracking in five sections (0213, 0214, 0217, 0218, 0221) over years from construction.")
Figure 6. Chart. Mean transverse crack length per section over time for thin PCC slabs and thick PCC slabs.
 The black lines with four different marks show the total length of longitudinal cracking in four sections (0213, 0217, 0218, 0221) over years from construction. The red line with five different marks show the total length of transverse cracking in five sections (0213, 0214, 0217, 0218, 0221) over years from construction.")
Figure 7. Charts. Mean longitudinal crack length per section over time for wide PCC slabs and standard PCC slabs.
The SPS-2 experiment specification included two levels of concrete strength (at 14 d): 3.8and 6.2 MPa. Figure 9 and figure 10 show that some sections with high slab strength display earlier longitudinal and transverse cracking. Between 6 and 12 years after construction, the weaker concrete showed more cracking, but, in the long term, there was little to distinguish between them.
 in Arizona. The three graphs on the right denote the cracking process in the three sections (0213, 0217, and 0218) Arkansas. Each chart in the figure shows the percentage cracking along with recorded snapshots of the patterns of longitudinal and transverse cracks.")
Figure 8. Charts. Mean transverse crack length per section over time for wide PCC slabs and standard PCC slabs.
. They share almost continuous single cracks relatively near the shoulder. These cracks occur only in the sections with dense graded aggregate base (section 0213) and lean concrete base (sections 0217, 0218 and 0206). This pattern of cracking was only found in these 10 sections in the Long-Term Pavement Performance Program Strategic Study of Structural Factors for Rigid Pavements (according to monitoring results updated in 2013).")
Figure 9. Chart. Mean longitudinal crack length per section over time for low-strength slabs and high-strength slabs.

Figure 10. Chart. Mean transverse crack length per section over time for low-strength slabs and high-strength slabs.
The SPS-2 experiment consisted of 168 core sections in 14 States. Although the data in the database for each section were generally of very high quality, there was considerable variation in the levels of completeness. An extensive review of the availability of data in the database was conducted to choose sites and sections with data suitable for detailed simulation.
The usefulness of the information about a particular test site for validating the vehicle-pavement interaction model depends on the following five main factors:
Table 1 shows a summary of the availability of data in the database for 2 of the 14 SPS-2 sites: Arkansas (wet zone) and Arizona (dry zone). These sites were used for the case studies in this report. The structural and material factors for each of the 12 core sections in each site are listed in table 2. Equivalent data were collected for all of the SPS-2 sites.(13) Note that the section numbers, (e.g., 0213) in table 1 and table 2 indicate the nominal design. Pavement section 0213 in Arkansas has the same nominal design (i.e., slab width, thickness, concrete strength, base type, etc.) as the section numbered 0213 in other States (e.g., Arizona).
Table 1. Summary of information available in the LTPP database for the SPS-2 sites in Arizona and Arkansas.
| State | Section | Distress Type | Date Assigned to LTPP | Survey Period | Maintenance | Traffic Data | ||||||||||||||
|---|---|---|---|---|---|---|---|---|---|---|---|---|---|---|---|---|---|---|---|---|
| Transverse Cracks | Longitudinal Cracks | Map Cracking | D Cracking | Corner Breaks | Longitudinal Spalling | Transverse Spalling | Pumping | Blow-ups | Polished Aggregate | Faulting | Scaling | Date | Survey Number | Number | Reason ID | Date (Year) | ||||
| 04 Arizona | 0213 | P | Y | T | SF | LB | S | D | G | 01/01/1993 | 02/28/95–02/23/12 | 12 | 1 | 6, 54 | 2009 | 84.6 percent (2012-07) | ||||
| 0214 | R | Y | T | SF | D | G | 02/27/95–02/23/12 | 0 | — | — | ||||||||||
| 0215 | P | Y | T | SF | S | D | 02/27/95–02/22/12 02/27/95–02/22/12 | 26 | 0 | — | — | |||||||||
| 0216 | Y | T | D | 12 | 0 | — | — | |||||||||||||
| 0217 | R | P | Y | T | SF | S | D | G | 02/28/95–02/22/12 | 1 | 6, 54 | 2009 | ||||||||
| 0218 | R | P | Y | B | T | SF | D | 02/27/95–02/23/12 | 1 | 54 | 2007 | |||||||||
| 0219 | R | P | Y | T | SF | S | D | 02/28/95–02/22/12 | 0 | — | — | |||||||||
| 0220 | R | P | Y | T | D | 02/27/95–02/23/12 | 0 | — | — | |||||||||||
| 0221 | P | Y | T | SF | S | D | G | 02/28/95–02/23/12 | 2 | 6, 54; 54 | 2007 and 2009 | |||||||||
| 0222 | R | P | Y | T | SF | D | 02/27/95–02/23/12 | 0 | — | — | ||||||||||
| 0223 | Y | T | SF | S | D | 02/28/95–02/23/12 | 0 | — | — | |||||||||||
| 0224 | P | Y | T | SF | D | 02/27/95–02/2412 | 0 | — | — | |||||||||||
| 0262 | P | Y | T | SF | S | D | 03/01/95–02/28/12 | 10 | 1 | 6 | 2009 | |||||||||
| 0263 | R | P | Y | T | SF | S | D | G | 02/03/95–02/28/12 | 0 | — | — | ||||||||
| 0264 | Y | T | SF | S | D | G | 03/01/95–02/28/12 | 0 | — | — | ||||||||||
| 0265 | Y | T | SF | S | D | G | 03/01/95–02/29/12 | 0 | — | — | ||||||||||
| 0266 | P | Y | T | SF | S | D | 03/01/95–02/29/12 | 0 | — | — | ||||||||||
| 0267 | Y | T | SF | S | D | G | 03/01/95–02/29/12 | 9 | 1 | 12 | 2008 | |||||||||
| 0268 | P | Y | T | SF | D | G | 03/01/95–03/01/12 | 0 | ||||||||||||
| 05 Arkansas | 0213 | R | P | B | T | SF | LB | S | D | 01/09/1993 | 11/19/96–05/24/07 | 7 | 4 | 3; 1; 6; 6 | 1997, 2002, 2003, and 2006 | 96.9 percent (07-12) | ||||
| 0214 | R | T | SF | LB | S | D | 11/08/96–04/18/12 | 10 | 1 | 3 | 1997 | |||||||||
| 0215 | T | SF | LB | S | D | 11/06/96–04/18/12 | 1 | 3 | 1997 | |||||||||||
| 0216 | T | SF | LB | S | D | 11/19/96–04/19/12 | 2 | 3; 2, 3 | 1997 and 02 | |||||||||||
| 0217 | R | P | B | T | SF | LB | S | D | G | 11/14/96–04/19/12 | 3 | 3; 1, 54; 54 | 1997, 2002, and 2006 | |||||||
| 0218 | R | P | B | T | SF | LB | D | 11/14/96–04/19/12 | 3 | 3; 1, 2; 54 | 1997, 2002, and 2006 | |||||||||
| 0219 | P | B | T | SF | LB | S | D | 11/12/96–04/18/12 | 1 | 3 | 1997 | |||||||||
| 0220 | B | T | SF | LB | D | 11/15/96–04/19/12 | 2 | 3; 2 | 1997 and 2002 | |||||||||||
| 0221 | R | B | T | SF | LB | S | D | 11/20/96–04/19/12 | 2 | 3; 2, 3 | 1997 and 2002 | |||||||||
| 0222 | T | SF | LB | S | D | 11/08/96–04/18/12 | 1 | 3 | 1997 | |||||||||||
| 0223 | T | SF | S | D | 11/06/96–04/18/12 | 1 | 3 | 1997 | ||||||||||||
| 0224 | B | T | SF | S | D | 11/18/96–04/19/12 | 4 | 3; 54; 3; 2 | 1996, 1997, 2001, and 2002 | |||||||||||
| Note: Commas separate different maintenance activities on the same date, and semicolons separate different maintenance activities on different dates. R = Transverse cracks occurred. P = Longitudinal cracks occurred. Y = Map cracking occurred. B = Corner breaks occurred. T = Longitudinal spalling occurred. SF = Transverse spalling occurred. LB = Pumping occurred. S = Polished aggregate occurred. D = Faulting occurred. G = Scaling occurred. Blank cell = No distress. — = No maintenance. |
||||||||||||||||||||
Table 2. The constructed layer information for Arkansas (05) and Arizona (04).
| State | Section | PCC Slab | Base Layer | Dowels (mm) | Subgrade | Climatic Condition | |||||||
|---|---|---|---|---|---|---|---|---|---|---|---|---|---|
| Design Type1 | Thickness (mm) | Type | Thickness (mm) | ||||||||||
| Measure | Design | Measure | Design | ||||||||||
| Arkansas(05) | 0213 | PCC3 | 188 | 203 | DGAB | 152 | 152 | 32 | Fine-grained | Wet, no-freeze | |||
| 2014 | PCC2 | 211 | 254 | ||||||||||
| 0215 | PCC1 | 284 | 279 | 152 | 38 | ||||||||
| 0216 | PCC4 | 277 | 152 | ||||||||||
| 0217 | PCC3 | 191 | 203 | LCB + DGAB | 160 | 102 | 152 | 102 | 32 | ||||
| 0218 | PCC2 | 188 | 163 | 102 | |||||||||
| 0219 | PCC1 | 282 | 279 | 160 | 102 | 38 | |||||||
| 0220 | PCC4 | 272 | 178 | 152 | |||||||||
| 0221 | PCC3 | 208 | 203 | PATB + DGAB | 84 | 104 | 102 | 102 | 32 | ||||
| 0222 | PCC2 | 213 | 59 | 279 | |||||||||
| 0223 | PCC1 | 277 | 279 | 99 | 203 | 38 | |||||||
| 0224 | PCC4 | 277 | 64 | 221 | |||||||||
| Arizona (04) | 0213 | PCC3 | 201 | 203 | DGAB | 147 | 152 | 32 | Coarse-grained | Dry, no-freeze | |||
| 2014 | PCC2 | 211 | 155 | ||||||||||
| 0215 | PCC1 | 287 | 279 | 160 | 38 | ||||||||
| 0216 | PCC4 | 284 | 160 | ||||||||||
| 0217 | PCC3 | 206 | 203 | LCB | 155 | 152 | 32 | ||||||
| 0218 | PCC2 | 211 | 155 | ||||||||||
| 0219 | PCC1 | 274 | 279 | 158 | 38 | ||||||||
| 0220 | PCC4 | 287 | 158 | ||||||||||
| 0221 | PCC3 | 208 | 203 | PATB + DGAB | 107 | 107 | 102 | 102 | 32 | ||||
| 0222 | PCC2 | 218 | 99 | 109 | |||||||||
| 0223 | PCC1 | 282 | 279 | 104 | 89 | 38 | |||||||
| 0224 | PCC4 | 272 | 112 | 97 | |||||||||
| 1Slab widths and concrete strengths: PCC1: 3.66m and 3.8 MPa, PCC2: 3.66 m and 6.2 MPa, PCC3: 4.27 m and 3.8 MPa, and PCC4: 4.27m and 6.2 MPa. | |||||||||||||
Figure 11 shows the annual average daily truck traffic over time for the two test sites. The dashed lines are periods when data were not available. The two sites had similar levels of truck traffic, although Arkansas had a slightly higher volume than Arizona.
Figure 12 shows the annual average precipitation in the two sites. According to the average precipitation level, Arkansas is defined as a wet site, and Arizona is defined as a dry site. The rainfall level was implicated in some failures of concrete pavements such as pumping.
 was applied to the surface of the half slab (with a width of 2m and a height of 0.2m). The half slab was supported by soil foundation (with a width of 3m and a height of 1m). The weight of the shoulder (with a width of 1m) was applied to the soil foundation next to the half slab. The slab was clamped along its longitudinal centerline and the foundation was clamped along its edges.")
Figure 11. Annual average daily truck traffic at the SPS sites in Arizona and Arkansas.

Figure 12. Annual average precipitation at the SPS sites in Arizona and Arkansas.
Figure 13 shows the total length of longitudinal cracking and transverse cracking over time on the Arkansas SPS-2 site. The following can be seen:
, for the four load cases. The horizontal axis is the distance from slab center and the vertical axis is the transverse stress at the top of slab (as measured in MPa). The red line dotted with circles show the result of case II: the transverse stress value gradually increases to above 0.6 MPa and then decreases until reaching zero; the green line dotted with triangles show the result of case IV: the transverse stress value monotonically decreases until reaching zero; the black line dotted with squares and the blue line dotted with triangles show the result of case I and case III respectively and the two lines almost overlap, showing monotonic decreases as the distance from slab center increases. The two geometric illustrations accompanying the chart display the location of the voiding and longitudinal cracks.")
Figure 13. The total length of cracking over time in the Arkansas SPS-2 sites. (Transverse cracking is plotted below the axis for convenience.)
Figure 14 shows the total length of longitudinal cracking and transverse cracking over time in Arizona. The following can be seen:
Figure 15 through figure 20 display details of the cracking process in three sections (0213, 0217, and 0218) for Arizona and Arkansas, respectively. Each figure shows the percentage cracking along with recorded snapshots of the patterns of longitudinal and transverse cracks.
The percentage of longitudinal cracks is defined as the total length of longitudinal cracks in a section normalized by the length of the section; 100 percent corresponds to a single crack along the entire length of the section. The percentage of transverse cracks is defined as the total length of transverse cracks normalized by the sum of the widths of all slabs in the section; 100 percent corresponds to a single transverse crack across every slab in the section. Both of these metrics can exceed 100 percent.
The crack patterns revealed that most longitudinal cracks initiated at slab transverse edges, and the rest initiated from transverse cracks. Most transverse cracks initiated at the concrete slab edge close to the shoulder, and the rest initiated either at the slab edge in the middle of the lane (i.e., with the longitudinal joints) or from longitudinal cracks.
The following two patterns of longitudinal cracks were apparent at 20 years of service:
Analysis of the pumping data for these sites showed that Arizona sections did not display significant edge pumping, whereas edge pumping occurred in the Arkansas sections a year and a half later than the appearance of cracking. It appears that pumping failure occurred because of cracking in these sections rather than cracking occurring due to water ingress.
")
Figure 14. Charts. The total length of cracking over time in the Arizona SPS-2 sites. (Transverse cracking is plotted below the axis for convenience.)

Figure 15. Chart. The development of cracking in Arizona-0213 section.

Figure 16. Chart. The development of cracking in Arizona-0217 section.

Figure 17. Chart. The development of cracking in Arizona-0218 section.

Figure 18. Chart. The development of cracking in Arkansas-0213 section.

Figure 19. Chart. The development of cracking in Arkansas-0217 section.

Figure 20. Chart. The development of cracking in Arkansas-0218 section.
The snapshots featured in figure 21 through figure 30 were selected from 10 different sections in 7 sites (States). They share almost continuous single cracks relatively near the shoulder. These cracks occurred only in the sections with DGAB (section 0213) and LCB (sections 0217, 0218, and 0206). This pattern of cracking was only found in the 10 sections in LTPP SPS-2 (according to monitoring results updated in 2013).
.")
Figure 21. Photo. Longitudinal cracking near the shoulder in Arizona-0213 section (February 16, 2011).
.")
Figure 22. Photo. Longitudinal cracking near the shoulder in Arizona-0262 section (February 16, 2011).
.")
Figure 23. Photo. Longitudinal cracking near the shoulder in Arkansas-0213 section (May 24, 2007).
.")
Figure 24. Photo. Longitudinal cracking near the shoulder in Arkansas-0217 section (December 4, 2012).
.")
Figure 25. Photo. Longitudinal cracking near the shoulder in Colorado-0217 section (September 20, 2011).
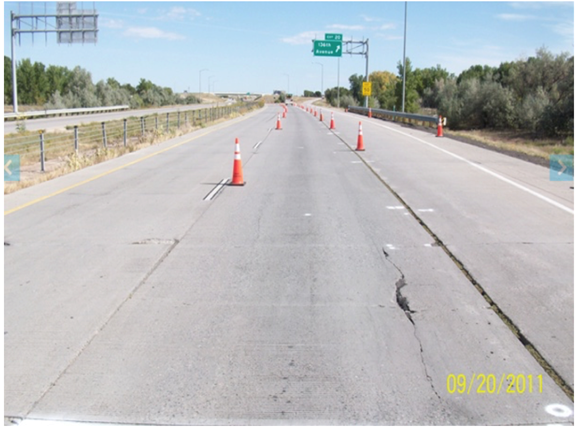
Figure 26. Photo. Longitudinal cracking near the shoulder in Colorado-0218 section (September 20, 2011).
.")
Figure 27. Photo. Longitudinal cracking near the shoulder in North Dakota-0217 section (August 21, 2012).
.")
Figure 28. Photo. Longitudinal cracking near the shoulder in Iowa-0217 section (March 30, 2011).
.")
Figure 29. Photo. Longitudinal cracking near the shoulder in Ohio-0206 section (September 12, 2006).
.")
Figure 30. Photo. Longitudinal cracking near the shoulder in Washington-0206 section (May 23, 2013).
Details of the structural factors and climatic conditions of these sections are presented in table 3. The table shows that the pattern of longitudinal cracking was only exhibited in thinner pavements (design depth: 203 mm). By contrast, other sections with thick slabs (design depth: 279 mm) did not exhibit such longitudinal cracking. The table also shows that this pattern of longitudinal cracking occurred mainly in sections constructed with wide slabs (with the exception of section 08-0218). This longitudinal cracking pattern (single cracking near the shoulder) occurred for soil types, shoulder types, and climatic conditions.
Table 3. The structural factors and climate conditions of the 10 sections shown in figure 6.
| Section Number | PCC Slab | Base | Soil Type | Shoulder | Climatic Conditions | |
|---|---|---|---|---|---|---|
| Design Depth (mm) | Design Width (m) | Type | ||||
| 04-0213 | 203 | 4.27 | DGAB | Coarse-grained | PCC | Dry and non-freeze |
| 04-0262 | 203 | 4.27 | DGAB | Coarse-grained | PCC | Dry and non-freeze |
| 05-0213 | 203 | 4.27 | DGAB | Fine-grained | AC | Wet and non-freeze |
| 05-0217 | 203 | 4.27 | LCB | Fine-grained | AC | Wet and non-freeze |
| 08-0217 | 203 | 4.27 | LCB | Coarse-grained | PCC | Dry and freeze |
| 08-0218 | 203 | 3.66 | LCB | Coarse-grained | PCC | Dry and freeze |
| 38-0217 | 203 | 4.27 | LCB | Fine-grained | AC | Dry and freeze |
| 19-0217 | 203 | 4.27 | LCB | Fine-grained | PCC | Wet and freeze |
| 39-0206 | 203 | 4.27 | LCB | Fine-grained | PCC | Wet and freeze |
| 53-0206 | 203 | 4.27 | LCB | Coarse-grained | AC | Dry and freeze |
| AC = Asphalt concrete. | ||||||
The shear strength of granular materials is dependent on the effective mean stress or hydrostatic confining pressure.(14,15) The material becomes weaker as the confining pressure decreases. It is hypothesized that premature longitudinal cracking of pavement slabs could be caused by slab curl interacting with wheel loading as described as follows and shown in figure 31 (the mechanism for premature transverse cracking is thought to be similar):

Figure 31. Illustration. Hypothesized mechanism of void and crack formation due to interaction between slab curl and axle loading.
A two-dimensional plane strain finite element model of a transverse section through the pavement was created using ABAQUS 6.12 to examine the void creation hypothesis described in the Hypothesis section. The system was assumed to be symmetrical at the centerline of the slab, so the model consisted of one-half of the elastic concrete slab resting upon the subgrade soil (see figure 32). The foundation soil was modeled using a linear elastic–perfectly plastic Mohr-Coulomb (M-C) constitutive model, which captured its pressure-sensitive yield behavior as shown in figure 33.

Figure 32. Illustration. Plane strain model of the slab and foundation subjected to vehicle axle loading.
![]()
Figure 33. Equation. M-C constitutive model.
Where:
τ = The shear strength of the soil.
σ = The normal (hydrostatic) stress.
Ø = The angle of internal friction, assumed to be 30 degrees.
C = The cohesion stress.
The soil was assumed to have a typical elastic modulus of 40 MPa and a dilation angle of 0.1 degree. Contact between the slab and soil foundation was assumed to have a coefficient of tangential friction of 0.5.
Vertical pressure was applied to the surface of the foundation under the shoulder to account for the weight of the shoulder material above. The slab was assumed to be clamped along its longitudinal centerline, and the foundation was clamped along its edges as shown in figure 32. The slab could optionally be curved as a result of temperature and moisture gradients, and it was loaded by a vertical wheel load. Four cases were simulated, as shown in table 4. Two different subgrade soils were used. Cases I and III had high cohesive stress (C = 8 kPa), nominally representing soils in wet regions. Cases II and IV had soils with low cohesive stress, nominally representing sandy soils in dry regions. Slab curl was switched on and off by optionally applying an upward deflection of 0.5 mm along the shoulder edge of the slab. Cycles of axle loading and unloading were applied, with the permanent soil deformation the result of each load cycle being multiplied by 100 to accumulate the void growth due to 100 axle load passes. This was repeated 100 times to simulate the soil deformation due to 10,000 axle passes.
Figure 34 shows the transverse stress at the top surface of the slab after 10,000 load cycles for the four load cases. The peaks of transverse stress in cases I, III, and IV are all located at x = 0, the centerline of the full slab, about 2 m from the shoulder. Only small edge voids were generated underneath the shoulder edge of the slab. In these three cases, any longitudinal cracking would be expected to occur along the centerline of the slab between the wheels. In case II, the peak of transverse stress is significantly higher and is located at about x = 0.7 m (i.e., 1.3 m from the shoulder), with significant voids generated underneath the slab. This position is consistent with the measurements of crack locations on the test pavements (see figure 20).
Therefore, it appears that the prerequisites for this mechanism of premature cracking to occur are soils with low cohesive strengths (e.g., in dry regions) and slabs with some curl (which is more prevalent in thinner slabs). If the soils have low cohesive strengths but the slabs do not curl (case IV), then longitudinal cracking is more likely to occur in the middle of the slab, as predicted by conventional elastic analysis of a slab on an elastic foundation. The model provides convincing evidence that the main cause of premature longitudinal cracking is not inadequate compaction but depressurization of the foundation due to slab curl.
Table 4. Simulation load cases.
| Load Case | Slab Curl | Cohesive Stress (C) |
|---|---|---|
| I | Yes | 8 kPa |
| II | Yes | 0.5 kPa |
| III | No | 8 kPa |
| IV | No | 0.5 kPa |

Figure 34. Illustration. Transverse stress at top surface of the slab for four cases.
LTPP SPS-2 is an excellent resource for studying long-term performance of jointed concrete pavements because of the availability of data for pavement performance, material properties, environmental data, and traffic data. The investigation points to a mechanism that explains the patterns of premature cracking of plain jointed concrete pavements involving interaction of slab curl, vehicle loading, and foundation soils with low cohesive strengths.
The major findings in this study are as follows:
Researchers— This study was performed by Distribution—This TechBrief is being distributed according to a standard distribution. Direct distribution is being made to the FHWA Divisions and Resource Center. Availability—The report may be obtained from the FHWA Product Distribution Center by e-mail to report.center@fhwa.dot.gov, by fax to 301-577-1421, or by phone to 301-577-0818. Key Words—Concrete pavement, longitudinal cracking, transverse cracking, foundation voiding, slab curling, pavement distress. Notice—This document is disseminated under the sponsorship of the U.S. Department of Transportation in the interest of information exchange. The U.S. Government assumes no liability for the use of the information contained in this document. The U.S. Government does not endorse products or manufacturers. Trademarks or manufacturers’ names appear in this report only because they are considered essential to the objective of the document. Quality Assurance Statement—The Federal Highway Administration (FHWA) provides high-quality information to serve Government, industry, and the public in a manner that promotes public understanding. Standards and policies are used to ensure and maximize the quality, objectivity, utility, and integrity of its information. FHWA periodically reviews quality issues and adjusts its programs and processes to ensure continuous quality improvement. |

