U.S. Department of Transportation
Federal Highway Administration
1200 New Jersey Avenue, SE
Washington, DC 20590
202-366-4000
Federal Highway Administration Research and Technology
Coordinating, Developing, and Delivering Highway Transportation Innovations
 |
| This report is an archived publication and may contain dated technical, contact, and link information |
|
Publication Number: FHWA-HRT-06-103
Date: August 2006 |
|||||||||||||||||||||||||||||||||||||||||||||||||||||||||||||||||||||||||||||||||||||||||||||||||||||||||||||||||||||||||||||||||||||||||||||||||||||||||||||||||||||||||||||||||||||||||||||||||||||||||||||||||||||||||||||||||||||||||||||||||||||||||||||||||||||||||||||||||||||||||||||||||||||||||||||||||||||||||||||||||||||||||||||||||||||||||||||||||||||||||||||||||||||||||||||||||||||||||||||||||||||||||||||||||||||||||||||||||||||||||||||||||||||||||||||||||||||||||||||||||||||||||||||||||||||||||||||||||||||||||||||||||||||||||||||||||||||||||||||||||||||||||||||||||||||||||||||||||||||||||||||||||||||||||||||||||||||||||||||||||||||||||||||||||||||||||||||||||||||||||||||||||||||||||||||||||||||||||||||||||||||||||||||||||||||||||||||||||||||||||||||||||||||||||||||||||||||||||||||||||||||||||||||||||||||||||||||||||||||||||||||||||||||||||||||||||||||||||||||||||||||||||||||||||||||||||||||||||||||||||||||||||||||||||||||||||||||||||||||||||||||||||||||||||||||||||||||||||||||||
Material Property Characterization of Ultra-High Performance ConcreteCHAPTER 3. UHPC MATERIAL CHARACTERIZATION3.1 RESEARCH PLANThe stated goal of the UHPC material characterization study is to determine the basic behaviors of UHPC with the intent of using UHPC in highway bridges. Many material behaviors are critical to the successful use of concrete in a highway bridge. These behaviors include strength, durability, and long-term stability. Each of these behaviors will be discussed in depth in this chapter. The curing treatment applied to concrete—which is always important—is even more important in the case of UHPC. The UHPC studied in this research program is normally steam treated onceit has reached sufficient strength to undergo the process. However, steam treatment of UHPC in a controlled environment may not always be feasible or even desirable. For this reason, the focus of the research, which is discussed in this chapter, is on characterizing UHPC that had been treated to one of four curing conditions. The four curing conditions were the standard steam treatment, a delayed version, a lower temperature version of the same steam treatment, and an untreated regime wherein no steaming was conducted. These curing regimes will be described in more detail later in this chapter. This chapter describes the results of the material characterization study. The chapter begins by introducing specimen nomenclature and test matrix information. Next, the batching, casting, and curing procedures and results are presented. Results from individual tests that focused on specific aspects of UHPC behavior are discussed in the remainder of this chapter. 3.1.1 Batch and Specimen NomenclatureThe material characterization study detailed in this chapter included well over 1,000 individual UHPC specimens. A naming scheme was created to allow for easy, unique identification of each specimen. The large majority of specimens cast for this study were part of the standardized set of batches designed to investigate the behavior of UHPC cured under various curing conditions. The other specimens were cast in extraneous batches that focused on specific behaviors of UHPC, primarily as related to compression testing. For clarity, the nomenclature discussed here will not be mentioned throughout most of this chapter. In most instances, the presentation and discussion of results can be completed without naming individual specimens. However, in some instances, the naming system has to be used because of the large amount of similar specimens and testing procedures. The nomenclature used to describe the specimens in the standardized batches is based on a five digit alphanumeric identifier. A letter that identifies the premix delivery fills the first digit in the identifier. This letter is L, M, or N for the first, second, or third delivery, respectively. The second digit in the identifier is filled by an integer that identifies the curing treatment applied to the specimen. This number ranges from one to four for the steam-treated, untreated, tempered steam-treated, and delayed steam-treated regimes, respectively. The third digit in the identifier is reserved for a letter that identifies the tests performed on that batch of specimens. These letters and the associated tests will be discussed further in the following section. A two-digit number indicating the particular specimen within the batch occupies the fourth and fifth digits. In the few cases in which a batch was repeated, the second batch was named identically to the first batch, except that the letter A was placed at the end of the identifier for each specimen. An example of this alphanumeric identification scheme is as follows. The first three digits in the name M1F01 indicate that this specimen was from the second premix delivery that was first steam-treated and then subjected to testing within the general durability batches. The "01" in the fourth and fifth digits indicates that this specimen was a prism subjected to freeze-thaw testing. A simpler naming scheme was used for the extraneous batches. These batches were named sequentially based on the premix delivery. For example, the 10th batch cast from the L delivery focused on the effect of varying the load rate on compression test results. Thus, the specimens from this batch are identified as L10-xx, with the xx being an integer identifier for each of the cylinders cast. In general, 30 or more cylinders populated these batches, and the associated testing was designed to indicate the effect of some external action on compressive behavior. The primary exception to this rule is batch N06, which focused on the early age shrinkage behavior of UHPC. 3.1.2 Test MatrixThe test matrix devised for the material characterization study was intended to cover a wide range of the basic behaviors of UHPC. The types of tests performed can generally be grouped into three classes. First, strength tests focused on the compressive and tensile behaviors of UHPC at various ages and under various curing conditions. Second, durability tests focused on the durability of UHPC under conditions with standardized aggressors. Finally, stability tests focused on the long-term ability of UHPC to maintain dimensional stability under various loading and environmental conditions. Table 4 lists the standardized batches that were used throughout this study. The batch letter listed in the first column is the same letter that would reside in the third digit of the alphanumeric identifier in a specimen’s name. A simplified description of the batch along with the associated testing is included in the next column. The specimens cast for each particular batch are included in the third column. Finally, the last two columns include the volume of material that was in an individual batch as well as the curing regimes for which each batch was cast. A batch of the size indicated was cast for each curing regime listed. Note that this large table continues across three pages. Table 5 provides similar information for the extraneous batches that were cast. The only difference between this table and table 4 is that the batches were not cast for each curing regime listed. Because the first column lists individual batches of concrete, the curing regimes listed were applied to some of the specimens in each batch.
† Cylinders listed as diameter x height. Prisms listed as depth x width x length in tested configuration.
† Cylinders listed as diameter x height. Prisms listed as depth x width x length. 3.2 BATCHING, CASTING, AND CURING OF UHPCThe first phase of the material characterization study described in this chapter is to determine the properties of fresh UHPC. To achieve consistent results throughout the entire study, a series of specific, standardized procedures were implemented for the creation of the specimens described in the previous section. The casting of these specimens allowed for the mixing, associated testing, and observation of over 50 batches of UHPC. The UHPC used in this study can be divided into three parts—premix, fibers, and liquids. The premix consists of all of the cementitious, aggregate, and filler materials (described in chapter 2). The premix was batched and blended by the manufacturer and delivered in bulk to the researchers. All of the UHPC testing described in this chapter consists of specimens created from one of the three premix deliveries made to the researchers over the course of 18 months. As described in the previous section, these deliveries were designated as the L, M, and N premixes. For the purpose of this study, all of the premixes are assumed to be identical; however, it is realized that manufacturing processes can vary with time, and the final premix product could show slight variations. The liquids that were mixed with the UHPC included water, accelerator, and a high-range water reducing admixture (HRWA). The accelerator used in this study was Rheocrete CNI. The HRWA was Glenium 3000NS. The fibers included in the UHPC were always nondeformed cylindrical steel fibers that were 12.7 mm (0.5 inch) long and had a 0.2-mm (0.008-inch) diameter. These fibers were included in the mix at a concentration of 2 percent by volume. The mix proportions used throughout this study included:
These mix proportions were followed for all except three batches. Those three batches followed a slightly different mix design as required by the material property being investigated. In two batches, M1K and M1N, the accelerator was replaced by an additional 28.8 kg/m3 (1.80 lb/ft3) of water. In the remaining batch, L12, the fibers were not included in the mix so that compression test behavior in nonreinforced UHPC could be studied. A 0.057-m3 (2.0-ft3) capacity pan mixer was used for nearly all of the UHPC mixing. This 1934 vintage mixer was somewhat underpowered for this application, resulting in extended mix times as compared to mixing UHPC in modern mixers. Regardless, this mixer was able to impart enough energy into the mix to obtain sufficient rheology for the casting of laboratory specimens. A 0.0085-m3 (0.3-ft3) mixer was used for the two batches that required only a small volume of material. Key points in the mixing procedure are shown in figure 2. The mixing procedure for UHPC included the following steps:
As soon as mixing was completed, the casting of specimens and the measurement of the rheological properties of the UHPC commenced. The rheology of the UHPC was measured via a flow table test similar to that described in ASTM C1437.(16) In the test that was implemented in this study, the mini slump cone is filled, then removed to allow the concrete to flow outward. Once the concrete reaches a steady state, the average diameter is determined by measuring the concrete at three locations. Next, the flow table is dropped 20 times in approximately 20 seconds. Again, the concrete is allowed to settle, and then its average diameter is recorded. The casting of all UHPC specimens used in this material characterization study was completed within 20 minutes after the completion of mixing. All specimens were cast on a vibrating table and were allowed to remain on the table for approximately 30 seconds after filling. The filling of molds was completed via scoops used to move the UHPC from the mixing pan into the mold. In prisms specimens for flexure tests, the UHPC was always placed in one end of the mold and allowed to flow to the other end to complete the filling. As was discussed in section 2.4.1, the tensile properties of UHPC depend on fiber reinforcement orientation, which is a direct result of casting procedure. After filling, specimens were removed from the vibrating table and were screeded. Although screeding is not normally recommended for UHPC and is very difficult to complete on a largescale cast, it was implemented here to make the later preparation of cured specimens easier. After screeding, each specimen had its exposed surface covered in plastic to prevent moisture loss. The specimens then sat undisturbed until final set had occurred. The demolding of the specimens occurred approximately 24 hours after casting. As will be discussed later in this chapter, this timetable sometimes resulted in the demolding of specimens that were marginally ready and had only very recently achieved set. Demolding of larger specimens that would have needed sufficient strength to support their greater self-weight would not have been possible in all cases on this timetable. As previously mentioned, four curing regimes were implemented to study UHPC characteristics under different curing conditions. The standard, manufacturer-recommended curing treatment included steaming the UHPC at 90 °C (194 °F) and 95 percent relative humidity (RH) for 48 hours. Figure 2. Photos. Mixing of UHPC. (a) Water addition. (b) HRWA addition. (c) Prepaste consistency. (d) Fiber addition. (e) Finished mix. 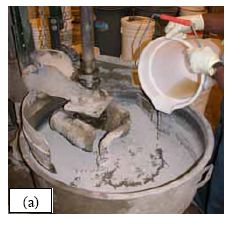 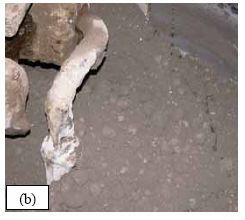 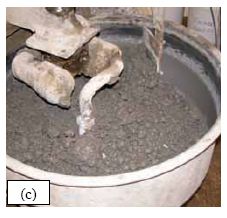 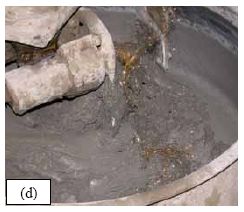 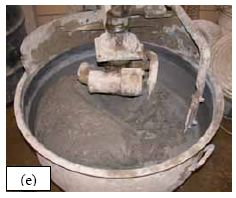 In practice, this procedure included 2 hours of increasing steam and 2 hours of decreasing steam, leaving 44 total hours of constant steaming at 90 °C (194 °F) and 95 percent RH. This treatment was initiated within 4 hours after demolding. This curing condition will henceforth be referred to as steam treatment. The remaining three regimes include untreated, tempered steam treatment, and delayed steam treatment. The untreated regime allowed the specimens to remain in a standard laboratory environment from demolding until testing. The tempered steam treatment is very similar to the steam treatment, except that the temperature inside the steam chamber was limited to 60 °C (140 °F). Finally, the delayed steam treatment is a curing regime wherein the steam treatment described above is followed, but it is not initiated until the 15th day after casting. Until the 15th day, delayed steam specimens are equivalent to untreated specimens. Note that this report also uses the term steam-based treatment, which refers to the collection of specimens that underwent either steam treatment, tempered steam treatment, or delayed steam treatment. Tables 6 and 7 provide information relating to the casting and curing of each of the batches included in this material characterization study. Table 6 focuses on the primary sets of specimens that were implemented across most curing regimes. These batches were all cast with premix from the M or N deliveries. Table 7 provides the results from other batches cast and primarily focuses on material cast from the L premix delivery. The tables include a listing of the age of the UHPC premix at the time of casting along with the total mixing time for each batch. Observation of the mixing and casting procedure throughout all the mixes completed in this study indicated that the behavior of the mix changed as the premix aged. This qualitative observation is confirmed by the results as shown in figure 3. The total mixing time for each mix in the M and N premixes is plotted against the premix age at casting. This figure shows a clear trend in which younger premixes could mix within 15 minutes while older mixes could take twice as long. Although not verified, it is likely that these increased times result from the agglomeration of fine particles within the premix as it ages. These mix times are relative and are specifically applicable only to the pan mixer used in this study. The rheology measures are also listed in tables 6 and 7. The final values ranged from 165 to 210 mm (6.5 to 8.25 inches). This wide range is indicative of large differences in rheology. The UHPC exhibiting the stiffer results was much more difficult to cast and would definitely have been problematic outside of a laboratory setting. Alternatively, a flow measure that was near or above 200 mm (8 inches) was consistent with UHPC that was easy to place. Figure 4 shows the final rheology values for the M and N premixes. The first castings of the M premix were completed during a time period when the laboratory conditions included very low humidity. For this reason, the results are shown in two series that indicate whether the humidity was low or normal during casting. Very stiff rheology results were obtained for a few mixes just before the rectification of the humidity situation. It is expected that the large diameter of the pan in the pan mixer combined with the low air moisture content worked to sap a small amount of moisture from the UHPC. This moisture loss was sufficient to adversely affect the rheological properties.
† Batch mix design did not contain any accelerator.
† Batch mix design did not contain any accelerator. Figure 3. Graph. Mix time as affected by premix age.  Figure 4. Graph. Final flow diameter as affected by premix age.  1 mm = 0.039 inch 3.3 COMPRESSION TESTINGA significant portion of this study focused on the behaviors of molded UHPC cylinders under compressive loading. The compressive tests discussed in this section were all completed nominally according to the ASTM C39 standard test method for cylinders and the ASTM C109 standard test method for cubes.(17,18) Throughout the entire material characterization study, nearly 1,000 compression specimens were tested. Although the load configuration and basic test setup remained constant, various properties were investigated through the use of different data collection techniques and different specimen geometries. The basic compression test on UHPC was the ASTM C39 test on a 76-mm (3-inch) diameter cylinder. This test was used as a control test throughout the material characterization study to ensure that consistent batching, mixing, and curing of the UHPC had occurred. The 76-mm (3-inch) cylinders were cast on a vibrating table in 152-mm (6-inch)-tall plastic molds. The concrete was scooped into the molds and was not rodded due to the presence of the fibers. Once full, the molds were held on the vibrating table for a few extra seconds before being removed and having their top surfaces screeded. After the molds were set, curing treatments were applied according to each of the four curing regimes. The preparation of the cylinders for testing was somewhat more involved than that normally used for cylinder testing. The largest difference is that the end planeness of the cylinders was ensured through the use of an end grinder. Figure 5 shows a picture of the end grinding procedure. All cylinders that were projected to have strengths above 83 MPa (12 ksi) were subjected to grinding. UHPC cylinders with strengths under this level were sulfur-capped, as grinding tends to pull out the fibers and create a nonuniform end surface at these lower strengths. After grinding, the cylinders were measured to verify end planeness and to determine length, diameter, and density. The end planeness was verified through the use of a flat steel plate and a dial gage as shown in figure 5. Sliding the cylinder under the dial gage allowed for determination of the longest and shortest lengths of the cylinder to an accuracy of 0.025 mm (0.001 inch). The out-of-planeness of the cylinder ends could be determined from this information. Each cylinder had to exhibit under 1 degree of out-of-planeness or the ends were reground. Next, the length was measured at four points around the circumference of the cylinder, and the average was calculated. The diameter was then measured at six locations—at the top, middle, and bottom of the cylinder on two perpendicular diameters. The average value was then used to calculate the area of the cylinder. Finally, the mass of the cylinder was determined, and the density was calculated. The entire grinding and measuring procedure was completed after any steam-based treatment was applied to the cylinder or at least 2 weeks after casting for the untreated specimens, unless the testing timetable required otherwise. In this case, a cylinder was prepared for testing within 1 day of performing the test. The testing of all cylinders was completed in a Forney 4,450-kilonewton (kN) (1,000-kilopound (kip)) capacity compression testing machine. The operator of this hydraulically operated machine uses a needle valve to set and control the loading rate. Aside from some preliminary testing that will be discussed later, the load rate for all cylinder and cube compression tests was set at 1.0 MPa/s (150 pounds per square inch per second (psi/s)). This load rate is higher than the load rates recommended in ASTM C39 and C109. The increased load rate was necessary, as the high strengths of UHPC would mean that a UHPC cylinder tested at the ASTM C39 load rate might take 15 to 20 minutes to reach failure. A small study, completed to determine if the higher load rate would have any adverse effect on results, indicated that the higher load rate was acceptable. A further discussion of this set of tests is presented subsequently in this chapter. Figure 5. Photos. (a) Grinding and (b) measuring of 76-mm (3-inch) diameter cylinders. 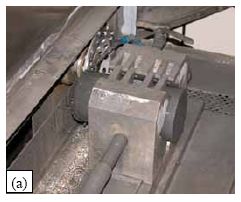 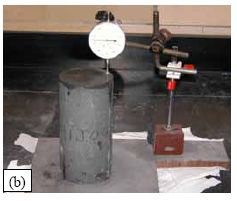
A 165-mm (6.5-inch) diameter spherical bearing was used as the upper loading platen for all cylinder and cube tests. Although this bearing would normally only be used for 102-mm (4-inch) diameter cylinders, it was used for all of the tests because of the high stress levels placed on the bearing by this high-strength concrete. The lower test platen was always either the machine’s lower platen or a machined steel plate resting on the machine’s platen. Figure 6 shows a cylinder that is prepared for testing. All specimens were loaded via the hydraulically controlled constant load rate from approximately 22 kN (5 kips) through failure. The cylinders and cubes exhibited very little decrease in stiffness throughout testing, thus the load rate remained relatively constant. Figure 6 also shows a picture of a cylinder after testing. Notice that the cylinder remains intact. This is due to the presence of the fibers as will be discussed more fully later in this chapter. 3.3.1 StrengthThe compressive strength results from 44 batches of UHPC are presented in table 8. These results are from the control cylinders cast with each batch from the M and N deliveries of UHPC premix. Control cylinder results from the L delivery are shown in table 9. All tests were performed on the corresponding day that is listed in the table. In general, six cylinders were tested for each batch, and the results were averaged to obtain the result shown in the table. Figure 6. Photos. 76-mm (3-inch) diameter cylinders (a) before and (b) after compression testing. 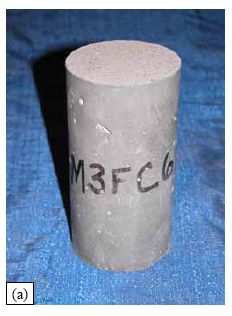 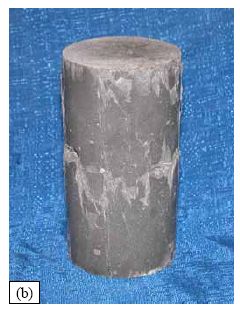
Based on these tests, the average 28-day compressive strength of UHPC has been determined. Steam-treated UHPC was found to have a compressive strength of 193 MPa (28.0 ksi) with a 95 percent confidence interval of 191 to 195 MPa (27.7 to 28.3 ksi). Untreated UHPC has a compressive strength of 126 MPa (18.3 ksi) with a 95 percent confidence interval of 123 to 129 MPa (17.9 to 18.7 ksi). Tempered steam-treated UHPC has a compressive strength of 171 MPa (24.8 ksi) with a 95 percent confidence interval of 168 to 174 MPa (24.3 to 25.3 ksi). Finally, delayed steam-treated UHPC has a compressive strength of 171 MPa (24.8 ksi) with a 95 percent confidence interval of 168 to 174 MPa (24.3 to 25.3 ksi). These results, although quite high for concrete, are likely lower than would normally be observed with this UHPC. Two factors that have been found to clearly influence the compressive strengthare the environment that UHPC is kept in before any steam-based treatment and the steaming environmental conditions. In this study, the UHPC was demolded as soon as it had sufficient strength to maintain its geometric integrity. At this age, the UHPC is still rather permeable and is susceptible to moisture loss and resulting lower strength values. This factor will be discussed in more depth later in this chapter. Second, the UHPC manufacturer recommends 48 hours of steam treatment, whereas in this study the UHPC actually received only 44 hours at the steam treatment level with 2 hours of ramping up and down from room temperature.
1 MPa = 145 psi
1 MPa = 145 psi The results from the individual compression tests listed in table 8 are shown in figures 7 and 8 relative to density and cylinder end planeness, respectively. The density results show that this concrete ranges from 2,400 to 2,500 kg/m3 (150 to 156 lb/ft3). An estimate of 2,480 kg/m3 (155 lb/ft3) is reasonable regardless of the type of curing treatment applied. Also, within each curing regime there seems to be a slight increase in compressive strength as the density increases. The cylinder end planeness results show that the out-of-planeness of the cylinders had little impact on the compressive strength. The spherical bearing used in these tests clearly was able to accommodate for these differences in planeness. Figure 7. Graph. Compressive strength and density of control cylinders.  1 MPa = 145 psi Figure 8. Graph. Compressive strength and cylinder end planeness of control cylinders.  1 MPa = 145 psi 3.3.2 Strength, Modulus of Elasticity, and Strain Capacity With TimeThe age-dependent compressive behavior of UHPC was investigated through a series of compression tests completed from 1 day to 8 weeks after casting. This testing provided results related to strength, modulus of elasticity, and compressive strain capacity both before and after the application of any curing treatment. These tests were also completed in the 4,450-kN (1,000-kip) Forney test machine following the same procedures discussed previously. However, in these tests, a deformation measuring device as attached to each cylinder to capture the axial movement. These tests were completed nominally in accordance with ASTM C469 with one exception: A number of the allowances made by this test method for the collection of data via simplified systems were bypassed in favor of more robust methodologies.(19) The test setup included the specially designed axial deformation measuring device shown in figure 9. The two parallel rings are both rigidly attached to the cylinder with a 51-mm (2-inch) gage length between attachment points. The upper ring holds three linear variable displacement transducers (LVDTs) whose ends bear on the lower ring. Thus, the axial deformation of the cylinder can be measured accurately from initiation of loading through failure. The load and the output from the three LVDTs were digitally recorded at approximately 4 hertz (Hz) throughout the test. The testing of each cylinder was completed in a single constant load application from start to failure. This procedure runs counter to the standard procedure presented in ASTM C469 but is consistent with both ASTM C39 and the alternate loading procedure presented in ASTM C469. It is expected that the normal ASTM C469 procedure was designed to allow for assurance of seating by repeatedly loading and unloading the cylinder and to allow for removal of the deformation measuring apparatus by stopping the test well before reaching failure. In this test program, proper seating of the cylinder could be assured by monitoring the load-deformation response during the test. Removal of the deformation measuring device was not necessary, as a loose-fitting plastic sleeve was sufficient to stop any UHPC chips from damaging the LVDTs during cylinder failure. As previously mentioned, the preparation of specimens for tests at early ages was completed within 1 day prior to the test. Also, cylinders with projected strengths below 83 MPa (12 ksi) were sulfur capped instead of ground. Figure 9. Photos. Modulus ring attachment (a) before and (b) during testing. 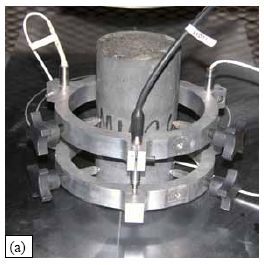 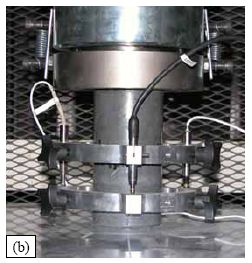 Selected results from these tests are compiled in figures 10 through 14. These figures show one stress-strain curve for each of the ages at which compression responses were collected. Note that a replicate (N1AxxA) was completed for the steam-treated portion of the testing as the compressive strength results from the initial set (N1A) were somewhat below the anticipated value. Unfortunately, the replicate compressive strength results were also somewhat lower than anticipated. The stress-strain responses obtained from these tests will be the focus of the remainder of this section as well as the next section. In a qualitative sense, note the change in the overall shape of the curves in figures 10 through 14. At 1, 2, or even 3 days after casting if no steam-based curing is applied, the UHPC exhibits a ductile stress-strain response. The rounded curve and the steady decrease after peak stress illustrate that the UHPC can sustain some load-carrying capacity through large deformations without brittle failure. The overall behavior changed dramatically after the steam-based treatment. In this case, the UHPC exhibits more of a brittle response wherein the attainment of the peak compressive load results in a rapid, uncontrolled decrease in load-carrying capacity. As the curing progresses or as the steam-based treatment becomes more acute, the brittle nature of the compressive failure response also becomes more acute. Figure 10. Graph. Selected stress-strain responses for steam-treated UHPC (N1A).  1 MPa = 145 psi Figure 11. Graph. Selected stress-strain responses for steam-treated UHPC (N1AxxA).  1 MPa = 145 psi Figure 12. Graph. Selected stress-strain responses for untreated UHPC.  1 MPa = 145 psi Figure 13. Graph. Selected stress-strain responses for tempered steam-treated UHPC.  1 MPa = 145 psi Figure 14. Graph. Selected stress-strain responses for delayed steam-treated UHPC.  1 MPa = 145 psi Figure 15 shows the strength results for five sets of specimens. The results presented in the figure are also shown in table 10 along with standard deviation values and the numbers of cylinders tested. In a similar fashion, figure 16 shows the modulus of elasticity results for the five sets of specimens. The modulus of elasticity was calculated based on the average LVDT based deformation measurements and the load reading. A best-fit linear approximation of the stress-strain results from 10 to 30 percent of the compressive strength of each individual cylinder was used. Again, table 10 presents further information relating to these results. Additional modulus of elasticity tests were also completed on spare cylinders from various batches of UHPC cast for this research program. These tests were completed following the same procedures discussed above and were all completed at 1 month of age. In general, between 20 and 30 cylinders were tested at this age for each curing regime. The overall modulus of elasticity results include a stiffness of 52.8 GPa (7,650 ksi) for steam-treated, 42.8 GPa (6,200 ksi) for untreated, 51.0 GPa (7,400 ksi) for tempered steam-treated, and 50.3 GPa (7,300 ksi) for delayed steam-treated UHPC. Finally, the axial strain carried by each cylinder at peak compressive loading was also determined based on the load-deformation results from each cylinder. This strain value was calculated as the average deformation exhibited by the cylinder over the 51-mm (2-inch) gage length of the deformation measuring system. These results are presented in figure 17 and table 10. The additional modulus of elasticity tests discussed above also provided extra information related to strain at peak stress. The overall strain at peak stress results include 0.0041 for steam treated, 0.0035 for untreated, 0.0035 for tempered steam-treated, and 0.0039 for delayed steamtreated UHPC. The results presented thus far in this section illustrate three primary findings. First, after steam or delayed steam treatment, the UHPC is stabilized. In terms of strength, stiffness, and strain peak load, the UHPC shows very little change after a steam-based treatment has been applied. Second, untreated UHPC continues to gain strength for at least 8 weeks after casting, but its increase in stiffness and decrease in strain at peak load seem to be curtailed at 1 month. Finally, UHPC gains strength and stiffness very quickly at early ages, while also becoming much less ductile with a large decrease in strain at peak load. Specifically, the compressive strength and stiffness after 24 hours are around 10 MPa and 10.3 GPa (1.5 ksi and 1,500 ksi), respectively. After 3 days, however, these values have increased to over 69 MPa and 34.5 GPa (10 ksi and 5,000 ksi), respectively, without any curing treatment. Figure 15. Graph. Compressive strength gain from casting up to 8 weeks of age.  1 MPa = 145 psi Figure 16. Graph. Modulus of elasticity gain from casting up to 8 weeks of age.  1 GPa = 145,000 psi Figure 17. Graph. Strain at peak compressive stress from casting up to 8 weeks of age. 
1 MPa = 145 psi 3.3.3 Linearity of UHPC Compressive ResponseIt is normally assumed that concrete begins to develop internal microcracking and exhibit an associated reduction in stiffness at high stresses. The stress level varies depending on the composition of the concrete. The linearity of the compressive stress-strain response of UHPC was investigated through the elastic modulus testing results that were described in the previous section. Two methods are used to describe the linearity of the compressive stress-strain response of concrete. The first is the secant modulus. The secant modulus, E0, is defined as the compressive strength of the concrete divided by the strain at the peak strength. The second method involves determining the proportion of the strength at which the observed stress is some percentage below the elastic modulus predicted stress. Figure 18 shows an example of both of these linearity descriptors in conjunction with an untreated UHPC cylinder tested at 57 days after casting. Both of these linearity descriptors relate to the elastic modulus, also known as the tangent modulus, which was defined previously as being the linear best-fit approximation of the stress-strain response between 10 and 30 percent of the compressive strength. Figure 18. Graph. Sample untreated stress-strain curve with linearity descriptors.  1 MPa = 145 psi The linearity to peak strength results, as defined by the secant modulus, are presented in table 11 and figures 19 and 20. The secant modulus shows very similar qualitative behaviors compared with the elastic modulus behaviors described in the previous section. More importantly, the ratio of the tangent to secant modulus values illustrates how the UHPC behavior changes as curing progresses. At 1 day after casting this ratio ranges from 5 to 7, but by 3 days it is under 2 even without any supplemental curing. The ratio tends to stabilize around 1.1 for the steam-based specimens and around 1.2 for the untreated specimens. For reference, this value is normally approximately 4 for normal weight 7 MPa (1,000 psi) compressive strength concrete and approximately 1.3 for 70 MPa (10 ksi) compressive strength concrete.(20) The linearity results—in terms of the stress at which the stress will have dropped some percentage from the linear elastic expected value—are presented in table 11 and figures 21 and 22. The research program focused on stress drops of 1, 3, and 5 percent. The results from the 1 percent drop are highly dependent on the predefined range for calculation of the elastic modulus and as such are of less interest. The results from the 5 percent drop clearly show that UHPC exhibits nearly linear behavior up to high stress levels. Figure 22 shows that the cylinders that underwent steam-based treatment reach between 80 and 90 percent of their compressive strength before diverging 5 percent from linear elastic behavior. The untreated cylinders seem to be asymptotically approaching the same type of response by 8 weeks after casting, having reached 70 percent of their compressive strength before diverging 5 percent from the linear elastic behavior.
1 MPa = 145 psi Figure 19. Graph. Secant modulus from casting up to 8 weeks of age.  1 MPa = 145 psi Figure 20. Graph. Ratio of elastic to secant modulus from casting up to 8 weeks of age.  1 MPa = 145 psi Figure 21. Graph. Compressive stress to strength ratio at 1 percent stress drop from linear elastic.  Figure 22. Graph. Compressive stress to strength ratio at 5 percent stress drop from linear elastic.  3.3.4 Compression Specimen GeometryIn the United States, the cylinder is the standard concrete compression test specimen. Conversely, the cube is the standard specimen in parts of Europe. It is generally accepted that with normal strength concrete the cube will result in a higher compressive strength due to its shorter aspect ratio and the proportionally larger lateral confinement provided by the machine platens. A series of tests were completed to determine the effect of various specimen geometries on the compressive strength of UHPC. Compression tests were completed according to ASTM C39 on 51-, 76-, and 102-mm (2-, 3-, and 4-inch) diameter cylinders with cast lengths of twice their diameters. ASTM C39 compression tests were also performed on overlength 76-mm (3-inch) diameter cylinders that had a cast length of 165 mm (6.5 inches). Cube compression tests were completed according to ASTM C109 on 51- and 100-mm (2- and 4-inch) cubes. Figure 23 shows the range of sizes and geometries of the specimens tested. Figure 24 shows the cylinder and cube specimens in the compression testing machine. All specimens were tested in a hydraulically actuated 4,450 kN (1,000 kip) Forney test machine with a load rate equivalent to 1.0 MPa/s (150 psi/s). The test program described above was repeated three times. Each time, the set of cylinder and cube specimens was cast from a single batch. Two of the batches were steam treated while the third batch was untreated. Table 12 provides the results from the compression tests. The 76-mm (3-inch) diameter cylinder—used as the control specimen throughout the entire study—was also the control specimen for this series of tests. Figure 23. Photo. Compression cubes and cylinders including (clockwise from upper left) 102-mm (4-inch), 76-mm (3-inch) overlength, 76-mm (3-inch), and 51-mm (2-inch) diameter cylinders and 51-mm (2-inch) and 100-mm (4-inch) cubes. 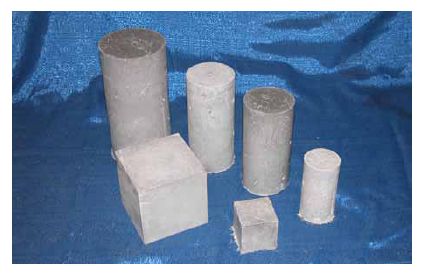 Figure 24. Photos. (a) Cylinder and (b) cube compression testing. 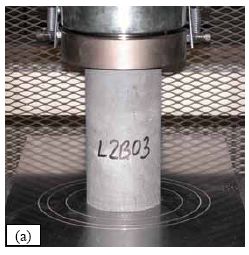 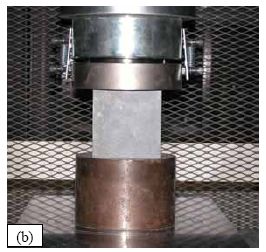 The combined results from the three sets of tests indicate that the compressive strength of UHPC can be measured, relatively accurately, through various sizes of cubes and cylinders. Results were never more than 8 percent removed from the control cylinder result. The cubes tended to exhibit slightly higher strengths on the order of 5 percent. In addition, the 51-mm (2-inch) diameter cylinders tended to exhibit slightly lower strengths. The smaller cubes and cylinders tended to exhibit larger standard deviations. Conversely, the large specimens tended to exhibit smaller standard deviations. These results were expected because heterogeneities in the concrete would likely remain in a uniform size range but would be proportionally larger in smaller specimens.
|
|||||||||||||||||||||||||||||||||||||||||||||||||||||||||||||||||||||||||||||||||||||||||||||||||||||||||||||||||||||||||||||||||||||||||||||||||||||||||||||||||||||||||||||||||||||||||||||||||||||||||||||||||||||||||||||||||||||||||||||||||||||||||||||||||||||||||||||||||||||||||||||||||||||||||||||||||||||||||||||||||||||||||||||||||||||||||||||||||||||||||||||||||||||||||||||||||||||||||||||||||||||||||||||||||||||||||||||||||||||||||||||||||||||||||||||||||||||||||||||||||||||||||||||||||||||||||||||||||||||||||||||||||||||||||||||||||||||||||||||||||||||||||||||||||||||||||||||||||||||||||||||||||||||||||||||||||||||||||||||||||||||||||||||||||||||||||||||||||||||||||||||||||||||||||||||||||||||||||||||||||||||||||||||||||||||||||||||||||||||||||||||||||||||||||||||||||||||||||||||||||||||||||||||||||||||||||||||||||||||||||||||||||||||||||||||||||||||||||||||||||||||||||||||||||||||||||||||||||||||||||||||||||||||||||||||||||||||||||||||||||||||||||||||||||||||||||||||||||||||||

