U.S. Department of Transportation
Federal Highway Administration
1200 New Jersey Avenue, SE
Washington, DC 20590
202-366-4000
Federal Highway Administration Research and Technology
Coordinating, Developing, and Delivering Highway Transportation Innovations
| SUMMARY REPORT |
| This summary report is an archived publication and may contain dated technical, contact, and link information |
| Publication Number: FHWA-HRT-14-026 Date: January 2014 |
Publication Number: FHWA-HRT-14-026 Date: January 2014 |
PDF files can be viewed with the Acrobat® Reader®
FHWA Publication No.: HRT-14-026 FHWA Contacts: Paul Y. Virmani, HRDI-60, (202) 493-3052, paul.virmani@dot.gov and Justin Ocel, HRDI-40, (202) 493-3080, justin.ocel@dot.gov. |
This document presents the result of a laboratory study of methodology for extraction and analysis of soluble salts from steel substrates.
Coatings applied on surfaces contaminated with excessive amounts of adverse soluble salts do not provide expected service life. Steel meant to be used without protective coating, such as weathering steel and stainless steel, can also suffer from corrosion damage caused by high concentration of soluble salts under corrosive conditions. Soluble salts often contain chloride, nitrate, and sulfate as adverse anions. Although most of the salts are soluble in water, they cannot be easily removed from steel surface by washing or abrasive blasting. Salts may also exist in pits and crevices on corroded surfaces within or under rust.
Atmospheric contaminants are one major source of soluble salts on steel bridges while deicing salts are another significant source of salt deposition on bridges. Even abrasives for cleaning steel surfaces sometimes contain detrimental amount of soluble salts, which can provide additional salts to the substrate during blast cleaning instead of removing in-situ residual salt.
There are number of field and laboratory methods to determine the amount of soluble salts on steel surfaces. SSPC Guide 15 describes the most commonly used field methods for the extraction and analysis of soluble salts.(1) It also includes laboratory reference methods for extraction and ion concentration analysis. The guide not only provides sampling and testing procedures but also discusses advantages and limitations of each method.
In SSPC Guide 15, the field methods are categorized into two major groups: methods either measuring total conductivity or determining concentration of specific ions.(1) Conductivity methods are further divided into two subgroups: fully automated single-step methods or multistep conductivity measurement techniques. Ion-specific methods are all multistep methods since there is no automated method available.
A fully automated method integrates extraction and analysis procedures. A device is attached to a metal surface, and a certain amount of extraction water is dispensed to dissolve or extract soluble salts from the surface. The device then measures the conductivity of the solution. A multistep method has separate steps for extraction and analysis. Extraction of soluble salts can be done with swab, latex sleeve or patch cell, or special filter paper. The extraction solution is collected for measuring conductivity or concentration of specific ions.
Field methods measuring chloride ions generally use paper strip, test tube, or drop titration. For sulfate ions, a colorimetric method or optical comparative method can be used to measure the turbidity of the solution. There is nitrate test strip available for determining nitrate concentration. Paper strips are also used for ferrous ion test.
The laboratory reference method for extracting soluble salts is the boiling method, which uses reagent water to extract salts. Sonic enhancement can also be applied for salt extraction. Commonly used laboratory reference methods for detection of specific ions are titration, ion chromatography, and ion-selective electrode. Ion chromatography can simultaneously test multiple ions with great accuracy.
The extraction methods using swabbing, latex patch cell and sleeve have been evaluated in FHWA studies in the past.(2,3) The extraction efficiency could be increased by using acidic fluid instead of deionized water; however, it affects the conductivity when estimating the amount of salts in the sample. Suitable equations were provided so that the actual chloride concentration on the substrate could be calculated based on the conductivity reading.(2) Guidelines and recommendations to improve extraction efficiency and analysis accuracy were provided in those FHWA studies.
Extraction and analysis of chloride ion have been studied in the past. (See references 4–9.)
De-ionized water was used in those studies to extract soluble chlorides, sometimes at elevated temperature. Titration or photometry methods were applied to determine chloride concentration. Flores found that on average the patch method overestimated chloride concentration by 50 percent, while the swabbing method underestimated sulfate concentration by 20 percent.(7) Considerable decrease in the extraction efficiency on rusted steel surfaces was due to the difficulty of extracting contaminants at the steel/rust interface. Methods using indicator test strips for determining soluble chloride were fairly accurate with non-rusted steel but provided low values for rusted steel. Rust hinders chloride extraction because the steel/rust interface is the preferential location for chloride ions to accumulate. Removal of rust on steel surface breaks down the barrier, improving chloride extraction from the steel surface.
A study compared chloride recovery rates among different curing conditions and extraction methods.(2) Chloride was put on steel panels and then retrieved with different extraction methods. For specimens with 30 μg/cm2 chloride concentration on the surface, the chloride recovery rate by the swabbing method was 95 percent for freshly doped steel surface (no aging). The recovery rate decreased for the doped specimens that have aged for 4 h: 80.7 percent recovery rate at 98.6 °F (37 °C) and 57 percent relative humidity, and 43.6 percent recovery rate at 98.6 °F (37 °C) and 78 percent relative humidity. The chloride recovery rate of the patch and sleeve methods were also evaluated. Acidic solutions were used as extraction liquid in a patch cell or sleeve. The chloride recovery rates from freshly doped steel surfaces (no aging) with 30 μg/cm2 were 101 percent for the patch test method and 107 percent for the sleeve test method. When the specimens were aged for 4 h at 98.6 °F (37 °C) and 57 percent relative humidity the chloride recovery rates were 97.7 percent for the patch test method and 99.3 percent for the sleeve test method. The chloride recovery rates further decreased to 79.9 percent for the patch test method and 60.4 percent for the sleeve test method when the doped specimens were aged at 98.6 °F (37 °C) and 78 percent relative humidity for 4 h. This study also demonstrated that analytical methods had detection limits for chloride. The detection limit (threshold) for swab/ion detection strip was 3 μg/cm2; it was about 1 μg/cm2 for patch/titration, and about 5 μg/cm2 for sleeve/chloride ion detection tube.
Appleman classified chloride levels on blast cleaned steel.(9) Chloride levels above 50 μg/cm2 were considered highly contaminated, levels below 30 μg/cm2 were classified as low chloride, and levels between 30 and 50 μg/cm2 were considered marginal. These numbers were recommended for coating system selection. In addition, a different classification was introduced for protective coatings on corroded areas. If the level of chloride concentration was 50 μg/cm2 or greater, the surface has to be re-cleaned; if the chloride concentration was less than 10 μg/cm2, the surface was considered clean. Chloride levels between 10 and 50 μg/cm2 indicated the surface cleanliness was marginal.
The objective of this study is to evaluate extraction and analysis methods for determining the amount of soluble salts on steel substrates.
Three extraction methods were used in this study. The first one was a paint test cell. A glass tube was clamped on to a steel plate, and an O-ring kept the steel plate/glass tube watertight. The second one was the latex sleeve method, which is part of a field test kit. The third extraction method was the boiling method, boiling steel plate in deionized water.
Extraction solutions were analyzed by ion chromatography. Unless specifically noted, all the ionic concentration measurements were carried out with ion chromatography method. Anion concentration was used to represent the amount of salts in a sample. The three anions that commonly exist on steel bridge surfaces are chloride, sulfate, and nitrate. Ion chromatography can determine the concentrations of all three anions simultaneously with accuracy below 1 ppm.
Ion chromatography is based on the principle of separating ionic species when a liquid mobile phase moves past a stationary phase.(10) The liquid phase carries the sample to be tested, and the stationary phase is made of permeable polymer. The stationary phase is composed of ion-exchange polymer particles packed in a column. Anions or cations are separated by differences in the rate at which they pass through the column. A reversible exchange of ions between a liquid phase and a stationary phase takes place in the column. The time a specific ion spent in the column, or retention time, is based on the attraction between the ion and charged sites on the stationary phase. An anion exchange column contains positively charged groups on the stationary phase, attracting anions in the mobile phase. Different anions can be separated because they have different affinities towards the stationary phase. To separate two ions, one of the ions must be preferably adsorbed by the stationary phase so that there is a significant difference in the retention time between the two ions.
Ions are detected by electrical conductivity after they are separated by the ion-exchange column. The concentration of the ions to be tested is relatively low, and the high concentration of the eluent can obscure accurate detection of the ions. In suppressed ion chromatography, the background conductivity of the eluent is reduced prior to conductivity measurement. For anion analysis using KOH as eluent, the solution passes through a cation-exchange membrane suppressor, and cations K+ are replaced by hydrogen ions H+. The cations K+ diffuse out of the membrane. OH- and H+ react to form H2O, which has low conductivity. With a low conductivity solvent as background, anions in the solution can be detected accurately.
Two types of steel plates were used in the study, A588 and A710. The A588 steel was ¼ inch (6.35 mm) thick, virgin steel fresh out of the mill. The A710 steel was previously stored outdoors under natural exposure, and its surface was rusted and pitted. It was ⅜ inch (9.525 mm) thick.
Rectangular steel test panels, 4 by 6 by ½ inch (101.6 by 152.4 by 12.7 mm) each, were prepared in the lab. The panels were cut to size with a band saw, and then blast cleaned with glass/aluminum oxide abrasive to near-white cleanliness.(11)
Glass panels of 4-by-6-inch (101.6-by-152.4-cm) dimension were used as reference surfaces. The glass panels were cleaned and dried after each test cycle. The test panels, curing condition, and doping levels are presented in table 1.
Scanning electron microscope (SEM) images of the steel surface were taken after blast cleaning to examine surface features and cleanliness. Figures 1, 3, and 5 are images of virgin A588 steel at low, intermediate, and high magnification, respectively. Figures 2, 4, and 6 are images of A710 steel at low, intermediate, and high magnification, respectively.
Table 1. Test panels and extraction samples.
Methods |
Chloride Concentration |
Cl-, SO42-, and NO3- (Concentration of each individual ion, in µg/cm2)* |
Total Number of Panels |
|||||||
1 |
3 |
5 |
10 |
30 |
1 |
5 |
30 |
|||
No Aging |
Glass Panels |
3 |
3 |
3 |
3 |
3 |
3 |
3 |
3 |
24 |
Virgin A588 Steel Panels |
3 |
3 |
3 |
3 |
3 |
3 |
3 |
3 |
24 |
|
Rusted and Pitted A710 Steel Panels |
3 |
3 |
3 |
3 |
3 |
3 |
3 |
3 |
24 |
|
Aging at |
Glass Panels |
3 |
3 |
3 |
3 |
3 |
3 |
3 |
3 |
24 |
Virgin A588 Steel Panels |
3 |
3 |
3 |
3 |
3 |
3 |
3 |
3 |
24 |
|
Rusted and Pitted A710 Steel Panels |
3 |
3 |
3 |
3 |
3 |
3 |
3 |
3 |
24 |
|
Subtotal |
18 |
18 |
18 |
18 |
18 |
18 |
18 |
18 |
Total: 144 |
|
* For example, there is 5 µg/cm2
of Cl-, 5 µg/cm2 of SO42-, and 5 µg/cm2
of NO3- on steel surface at 5 µg/cm2
concentration level. |

Figure 1. Photo. Low resolution SEM image of virgin A588 steel surface after blast cleaning.

Figure 2. Photo. Low resolution SEM image of A710 steel surface after blast cleaning.

Figure 3. Photo. Intermediate resolution SEM image of virgin A588 steel surface after blast cleaning.

Figure 4. Photo. Intermediate resolution SEM image of A710 steel surface after blast cleaning.

Figure 5. Photo. High resolution SEM image of virgin A588 steel surface after blast cleaning.

Figure 6. Photo. High resolution SEM image of A710 steel surface after blast cleaning.
Doping solutions contained either chloride as anion, or a combination of chloride, nitrate, and sulfate as anions. The latter was denoted as a 3-anion solution in this study. The concentration of these three anions was equal in the solution. For example, a 1 ppm, 3-anion solution had chloride, nitrate, and sulfate concentration all at 1ppm.
Steel panels and glass panels were doped with chloride solution or a solution containing chloride, nitrate, and sulfate. The purpose of using glass panels is primarily for evaluating the accuracy of extraction methods. A small amount of solution was sprayed on the surface within a 1.38-inch (3.5-cm)-diameter circle. A fine graduated syringe was used to regulate the volume to be dropped on the surface. The panels were doped with salt solutions to achieve surface concentrations of 1, 3, 5, 10 and 30 µg/cm2. For each concentration level, three doped specimens were prepared. An example of calculating ion concentration on the surface is given below.
The salt concentration on steel surface is controlled by the dosage of the doping solution and the surface covered by the doping solution. Let:
Then the concentration of salt on the surface is:

Figure 7. Equation. C equals the product of D times V times rho divided by A.
To calculate the volume of solution needed for a certain surface concentration, we rearrange the equation to the following:

Figure 8. Equation. V equals the product of C times A divided by the product of D times rho.
For example, to create a 5 µg/cm2 chloride concentration in a 14.6 cm2 area using a 100 ppm chloride solution, the volume needed for doping is:

|
1.0 µg/cm2 = 2.3×10⁻⁷ oz/inch2. Figure 9. Equation. V equals the product of 5 µg/cm2 times 14.6 cm2 divided by the product of 100×10-6 times 106 µg/mL. |
As shown in the example in figure 9, 0.73 mL of the solution is needed.
Following the doping process, the plates were maintained for 4 h in two different conditions. This process was named as "aging." One condition was laboratory exposure at room temperature and humidity, and the other condition was in an environmental chamber at 100.4 ºF (38 ºC) and 78 percent relative humidity.
Soluble salts were extracted from the doped panel with a paint test cell, as shown in figure 10. The device included a glass tube, an O-ring seal, a nonstick base, and a stainless steel clamp. The panel was clamped between the glass tube and the nonstick base; the O-ring seal kept the apparatus watertight. 1.69 fl oz (50 mL) of deionized water was poured into the glass tube. A glass rod was used to stir the liquid in the glass tube. After 2 min of stirring, the liquid was poured into a beaker.
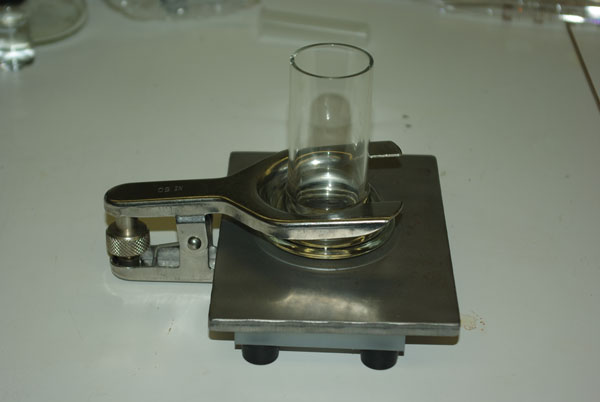
Figure 10. Photo. Extraction setup using a paint test cell.
The latex sleeve was also used for extraction in this study. The CHLOR*RID International field test kit has a latex sleeve and specialty extraction solution for analyzing the steel specimens. The proprietary extraction solution is claimed to "enhance retrieval rates."(12) The latex sleeve had a self-adhesive pad with 1.55 inch2 (10 cm2) opening, therefore the extraction area was 1.55 inch2 (10 cm2).
The boiling extraction method was also used to determine the amount of salts on steel panels after blast cleaning. The steel panel was immersed in deionized water and boiled for 1 h. The surfaces of the plate were thoroughly rinsed and the liquid collected for testing concentration of salts. This method was not used to recover salts on doped panels.
The extracted solution was filtered using a syringe filter with a pore size of 0.2 µm. The syringe, filter, and sample vial were washed with deionized water before the filtration process. The final liquid sample was clean and transparent.
Figure 11 shows a virgin A588 steel surface, and figure 12 shows an A710 steel surface, before the doping and extraction processes. Figure 13 and figure 14 show the surfaces afterward. With abrasive blast cleaning, the virgin A588 steel had a smooth and clean surface, while the pitted and rusted A710 steel surface was relatively rough. Blast cleaning has removed all rust from the steel surface. After the doping and extraction process, the A710 steel surface had significantly more rust stains than the virgin A588 steel.
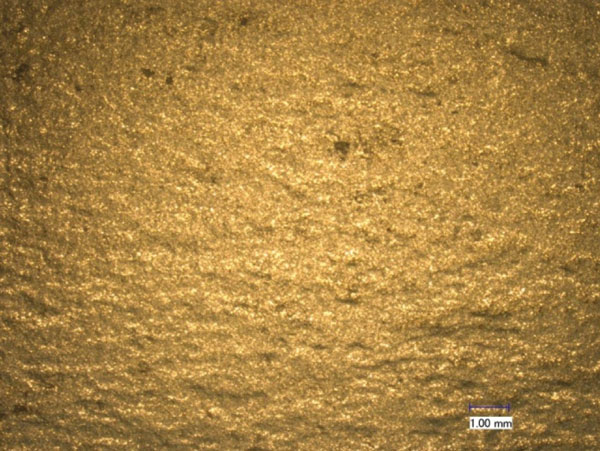
Figure 11. Photo. Microscopic image of virgin A588 steel surface before doping/extraction process.
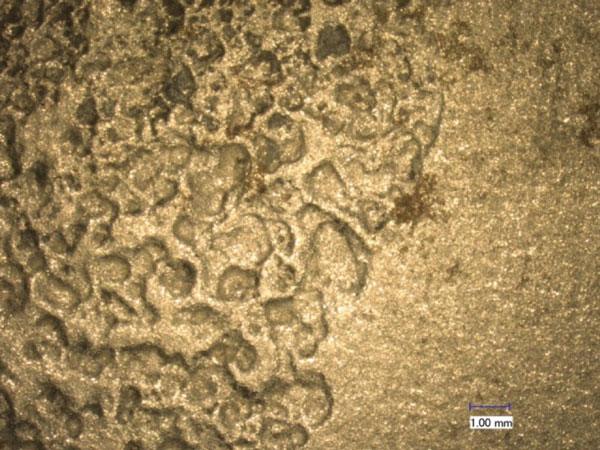
Figure 12. Photo. Microscopic image of A710 steel surface before doping/extraction process.
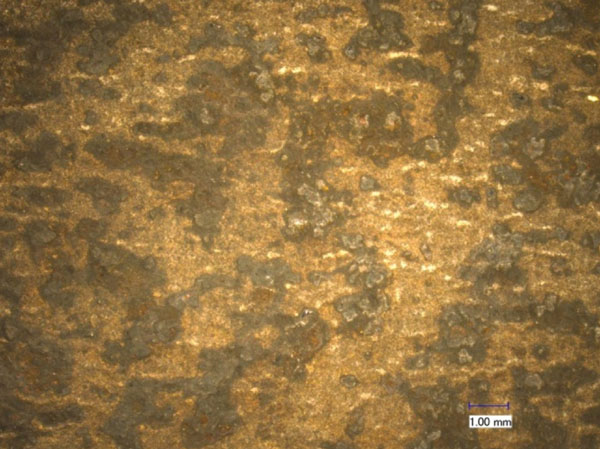
Figure 13. Photo. Microscopic images of virgin A588 steel surface after doping/extraction process.
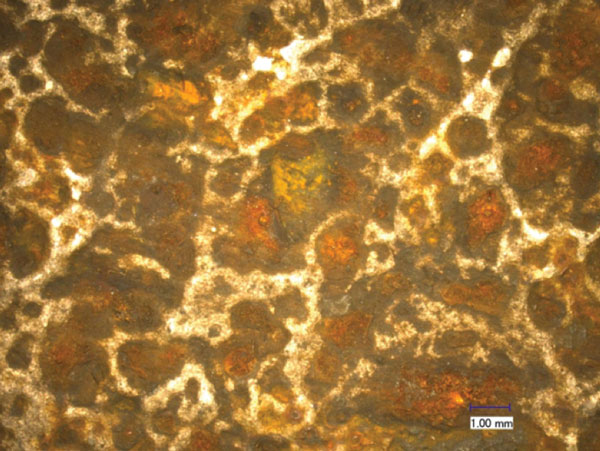
Figure 14. Photo. Microscopic image of A710 steel surface after doping/extraction process.
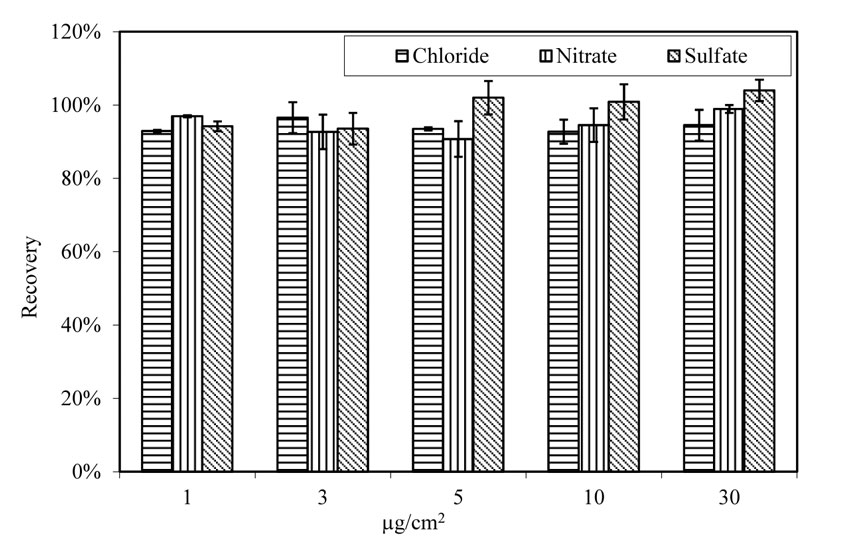
Glass panels were doped with salt solutions to serve as a reference for examining extraction and analysis methods. As shown in figure 15, the extraction rate for all three anions is consistent among the tested specimens with salt concentrations ranging from 1 to 30 µg/cm2.
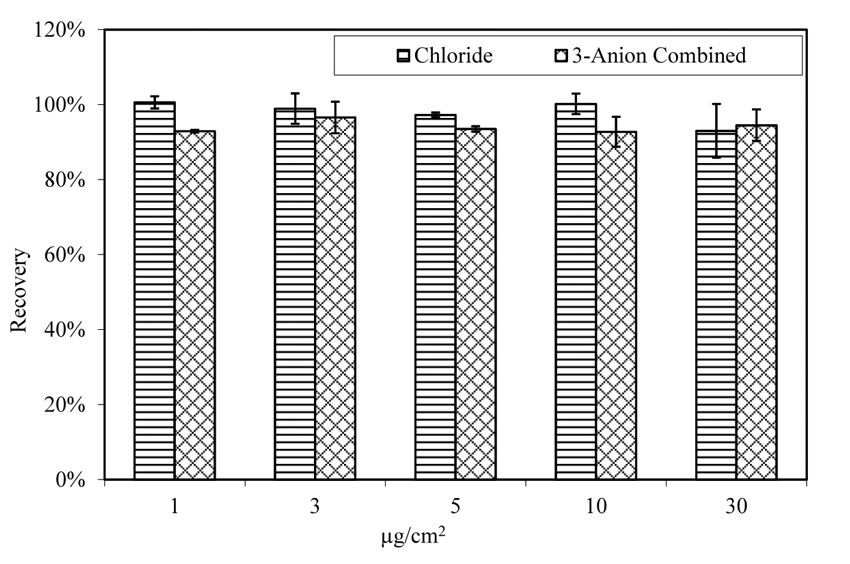
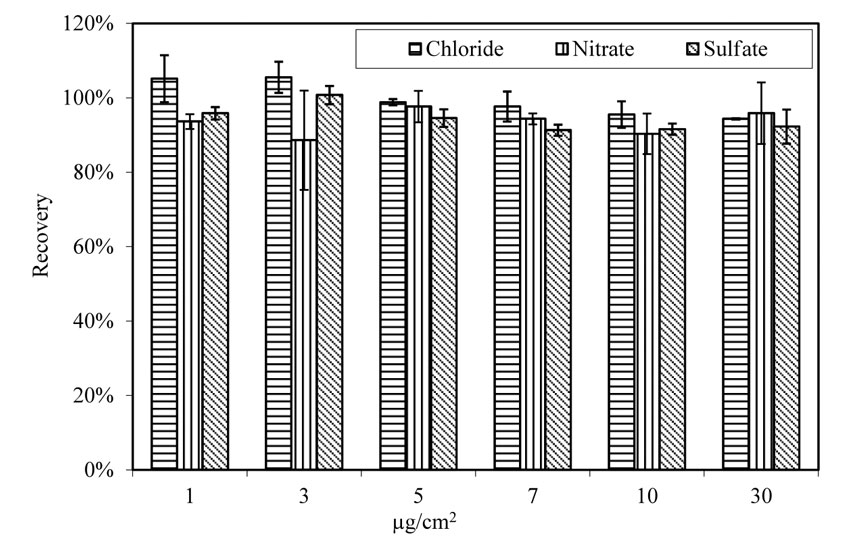
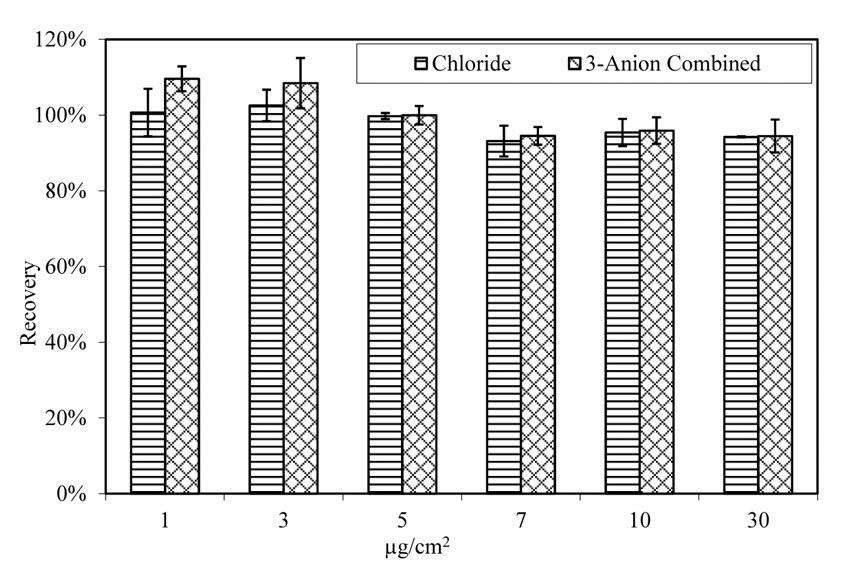
As shown in figure 16, the extraction rate for chloride, either doped with single anion solution (contains only chloride as anion) or with 3-anion solution (contains chloride, sulfate, and nitrate as anions,) is consistent. Therefore, the extraction and analysis method are effective. Temperature and relative humidity did not affect the extraction rate, as shown in figure 17 and figure 18.
| 1.0 µg/cm2 = 2.3×10⁻⁷ oz/inch2. |
Figure 15. Chart. Extraction from glass panels doped with solutions containing 3 anions. Aging at room temperature.
| 1.0 µg/cm2 = 2.3×10⁻⁷ oz/inch2. |
Figure 16. Chart. Extraction of chloride from doped glass panels. Aging at room temperature.
| 1.0 µg/cm2 = 2.3×10⁻⁷ oz/inch2. |
Figure 17. Chart. Extraction from doped glass panels. Aging at 100.4 ºF (38 ºC) and 78 percent relative humidity.
| 1.0 µg/cm2 = 2.3×10⁻⁷ oz/inch2. |
Figure 18. Chart. Extraction of chloride from doped glass panels. Aging at 100.4 ºF (38 ºC) and 78 percent relative humidity.
There is no method available that can extract all salt contaminants from steel surfaces, especially for rusted steel substrate with pits. The effectiveness of each extraction method varies. For this study, three extraction methods were used to determine the background salt contaminants on steel panels, and the results are presented below.
Background soluble salts on virgin A588 steel panels are presented in table 2. The results are based on measurements of 12 panels. On average, chloride concentration was found to be 0.15 µg/cm2, nitrate 0.03 µg/cm2, and sulfate 0.20 µg/cm2. Concentrations of the three anions vary substantially among the tested specimens, as indicated by the standard deviation of the ion concentration measurements. The amount of chloride ranges from none to 0.33 µg/cm2, nitrate from none to 0.20 µg/cm2, and sulfate from none to 0.65 µg/cm2. Chloride and sulfate were found on most of the specimens. However, nitrate was not detected on the surface of most specimens. Among the 12 specimens tested, nitrate was detected only on 2.
Table 2. Background soluble sales on virgin A588 steel with paint test cell extraction method.
|
Contaminant Concentration (µg/cm2) |
||
Contaminant |
Chloride |
Nitrate |
Sulfate |
Mean |
0.15 |
0.03 |
0.20 |
Standard Deviation |
0.11 |
0.08 |
0.17 |
Max |
0.33 |
0.20 |
0.65 |
Min |
0.00 |
0.00 |
0.00 |
| 1.0 µg/cm2 = 2.3×10⁻⁷ oz/inch2. |
The amount of soluble salts on pitted A710 steel panels varies significantly, as shown in table 3. A total of 21 panels were tested. Concentrations of the three anions vary substantially among the tested specimens. The amount of chloride ranges from 0.29 to 4.28 µg/cm2. On average chloride is 1.36 µg/cm2, but the standard deviation is 1.01µg/cm2. For nitrate, the average is 0.23 µg/cm2, yet with a standard deviation of 0.27 µg/cm2. Sulfate concentration is 2.09 µg/cm2, and the standard deviation is 1.56 µg/cm2.
Table 3. Background soluble salts on pitted A710 steel with paint test cell extraction method.
|
Contaminant Concentration (µg/cm2) |
||
Contaminant |
Chloride |
Nitrate |
Sulfate |
Mean |
1.36 |
0.23 |
2.09 |
Standard Deviation |
1.01 |
0.27 |
1.56 |
Max |
4.28 |
0.83 |
7.79 |
Min |
0.29 |
0.00 |
0.62 |
| 1.0 µg/cm2 = 2.3×10⁻⁷ oz/inch2. |
The latex sleeve extraction method uses a 10 mL proprietary extraction liquid. The background concentration of virgin A588 steel is based on measurements from five panels, and the results are shown in table 4. Chloride concentration on the virgin A588 steel surface varies from 1.75 to 2.48 µg/cm2 with an average value of 2.05 µg/cm2 and the standard deviation is 0.30 µg/cm2. The average nitrate concentration is 1.45 µg/cm2, and varies from 0.96 to 2.13 µg/cm2 with a standard deviation 0.48µg/cm2. For sulfate, the average concentration is 5.40 µg/cm2, and varies from 5.04 to 5.98 µg/cm2 with a standard deviation0.34 µg/cm2.
Table 4. Extraction from virgin A588 steel panels with latex sleeve method.
|
Contaminant Concentration (µg/cm2) |
||
Contaminant |
Chloride |
Nitrate |
Sulfate |
Mean |
2.05 |
1.45 |
5.40 |
Standard Deviation |
0.30 |
0.48 |
0.34 |
Max |
2.48 |
2.13 |
5.97 |
Min |
1.75 |
0.96 |
5.04 |
| 1.0 µg/cm2 = 2.3×10⁻⁷ oz/inch2. |
The background concentration of rusted and pitted A710 steel panels is shown in table 5. The results are based on measurements of five panels. Chloride concentration on the rusted and pitted A710 steel surface varies from 2.02 to 2.38 µg/cm2, with an average value of 2.22 µg/cm2 and a standard deviation of 0.15µg/cm2. The average nitrate concentration is 1.52 µg/cm2, and varies from 1.35 to 2.03 µg/cm2 with a standard deviation 0.29 µg/cm2. For sulfate, the average concentration is 5.24 µg/cm2, and varies from 4.72 to 5.94 µg/cm2 with a standard deviation 0.47 µg/cm2.
Table 5. Extraction from pitted A710 steel with latex sleeve extraction method.
|
Contaminant Concentration (µg/cm2) |
||
Contaminant |
Chloride |
Nitrate |
Sulfate |
Mean |
2.22 |
1.52 |
5.24 |
Standard Deviation |
0.15 |
0.29 |
0.47 |
Max |
2.38 |
2.03 |
5.94 |
Min |
2.02 |
1.35 |
4.72 |
| 1.0 µg/cm2 = 2.3×10⁻⁷ oz/inch2. |
Steel panels were boiled in deionized water for 1 h to extract soluble salts on the surface. The background concentration of virgin A588 steel is based on measurements of three panels, and the results are shown in table 6. Chloride concentration varies from 0.41 to 0.78 µg/cm2, with an average value of 0.61 µg/cm2 and a standard deviation of 0.15 µg/cm2. Nitrate was not detected in the extraction solution. For sulfate the average concentration is 0.57 µg/cm2, and varies from 0.52 to 0.64 µg/cm2 with a standard deviation of 0.05 µg/cm2.
Table 6. Extraction from virgin A588 steel panels using boiling method.
|
Contaminant Concentration (µg/cm2) |
||
Contaminant |
Chloride |
Nitrate |
Sulfate |
Mean |
0.61 |
0.00 |
0.57 |
Standard Deviation |
0.15 |
0.00 |
0.05 |
Max |
0.78 |
0.00 |
0.64 |
Min |
0.41 |
0.00 |
0.52 |
| 1.0 µg/cm2 = 2.3×10⁻⁷ oz/inch2. |
The background concentration of rusted and pitted A710 steel panels is shown in table 7. The results are based on measurements of three panels. Chloride concentration on the rusted and pitted A710 steel surface varies from 3.36 to 3.99 µg/cm2, with an average value of 3.62 µg/cm2 and a standard deviation of 0.24 µg/cm2. Nitrate was not detected in the extraction solution. For sulfate, the average concentration is 6.45 µg/cm2, and varies from 5.30 to 7.06 µg/cm2 with a standard deviation of 0.85 µg/cm2.
Table 7. Extraction from rusted and pitted A710 steel panels using boiling method.
|
Contaminant Concentration (µg/cm2) |
||
Contaminant |
Chloride |
Nitrate |
Sulfate |
Mean |
3.62 |
0.00 |
6.45 |
Standard Deviation |
0.24 |
0.00 |
0.85 |
Max |
3.99 |
0.00 |
7.06 |
Min |
3.36 |
0.00 |
5.30 |
| 1.0 µg/cm2 = 2.3×10⁻⁷ oz/inch2. |
The effectiveness of each extraction method varies significantly. Table 8 shows the measured average concentration of contaminants from the three extraction methods. All steel panels are virgin A588 steel. Using a latex sleeve and the specialty extraction solution, all three contaminants are extracted from the steel surface with higher concentration than the other two methods. For example, the average chloride concentration is 2.05 µg/cm2 based on the latex sleeve method, while the boiling method measures chloride concentration as 0.61 µg/cm2, and the paint test cell detects 0.15 µg/cm2. For sulfate, the average chloride concentration is 5.40 µg/cm2 from the latex sleeve method, 0.61 µg/cm2 from the boiling method, and 0.15 µg/cm2 from the paint test cell method. The boiling method does not detect any nitrate, while the paint test cell method measures the nitrate concentration as 0.03 µg/cm2. The latex sleeve method finds 1.45 µg/cm2 of nitrate on the steel surface.
Table 8. Extraction from virgin A588 steel panels using different methods.
|
Mean Contaminant Concentration (µg/cm2) |
||
Contaminant |
Chloride |
Nitrate |
Sulfate |
Paint Test Cell |
0.15 |
0.03 |
0.20 |
Latex Sleeve |
2.05 |
1.45 |
5.40 |
Boiling |
0.61 |
0.00 |
0.57 |
| 1.0 µg/cm2 = 2.3×10⁻⁷ oz/inch2. |
The extraction of the specialty solution used in the latex sleeve method is still effective, but diminished nonetheless when it is used on the rusted and pitted A710 steel panels, as shown in table 9. The boiling method extracts chloride and sulfate more efficiently than the other methods. However, it is completely inadequate to extract nitrate. The latex sleeve method extracts 1.52 µg/cm2 nitrate from the steel surface, while the paint test cell method gets 0.23 µg/cm2. The chloride concentration measured with the boiling method is 3.62 µg/cm2, 2.22 µg/cm2 from the latex sleeve method, and 1.36 µg/cm2 from the paint test cell method. The sulfate concentration measured with the boiling method is 6.45 µg/cm2, 5.24 µg/cm2 from the latex sleeve method, and 2.09 µg/cm2 from the paint test cell method.
Table 9. Extraction from rusted and pitted A710 steel panels using different methods.
|
Mean Contaminant Concentration (µg/cm2) |
||
Contaminant |
Chloride |
Nitrate |
Sulfate |
Paint Test Cell |
1.36 |
0.23 |
2.09 |
Latex Sleeve |
2.22 |
1.52 |
5.24 |
Boiling |
3.62 |
0.00 |
6.45 |
| 1.0 µg/cm2 = 2.3×10⁻⁷ oz/inch2. |
The difference in extraction rates among the test methods is not fully understood. For the paint test cell method, extraction takes place at room temperature rather than elevated temperature. The extraction media is water, which may not dissolve as much salt as the specialty solution. On the other hand, the specialty extraction solution seems to be less effective for extracting salts from rust. As a field deployable method, the latex sleeve with a specialty extraction solution appears to be a good choice, especially for testing freshly cleaned steel without pits. The boiling method is considered a reliable method in the laboratory, and it can effectively extract chloride and sulfate from rusted and pitted steel. However, special attention has to be paid when it is used to determine nitrate contamination on steel.
Virgin A588 steel plates were doped with salt solutions to achieve surface concentration of ions ranging from 1 to 30 µg/cm2. The background contamination was subtracted when the recovery rate was calculated. The paint test cell method was used to extract salts from the steel surface. Since background contamination varies among extraction methods, for this purpose the background concentration obtained with the paint test cell was applied. This was considered appropriate, as we were interested in water-soluble salts on the steel surface.
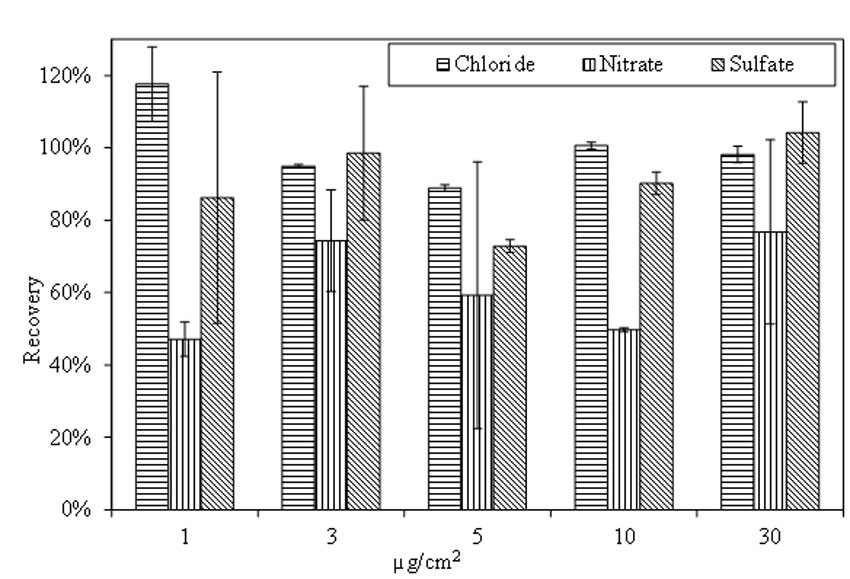
Figure 19 shows the recovery rate of doped specimens that were aged for 4 h at room temperature. The recovery rate for chloride ranges from 89 percent to 118 percent among the 5 doping levels, with average recovery rate at 100 percent. The standard deviation is larger among low doping concentration specimens. The recovery rate for nitrate is between 47 percent and 77 percent. For sulfate, the recovery rate varies from 73 percent to 104 percent. Standard deviation of the recovery rate for nitrate and sulfate varies widely among the tested samples.
| 1.0 µg/cm2 = 2.3×10⁻⁷ oz/inch2. |
Figure 19. Chart. Recovery of salts from doped A588 steel panels. Aging for 4 h at room temperature.
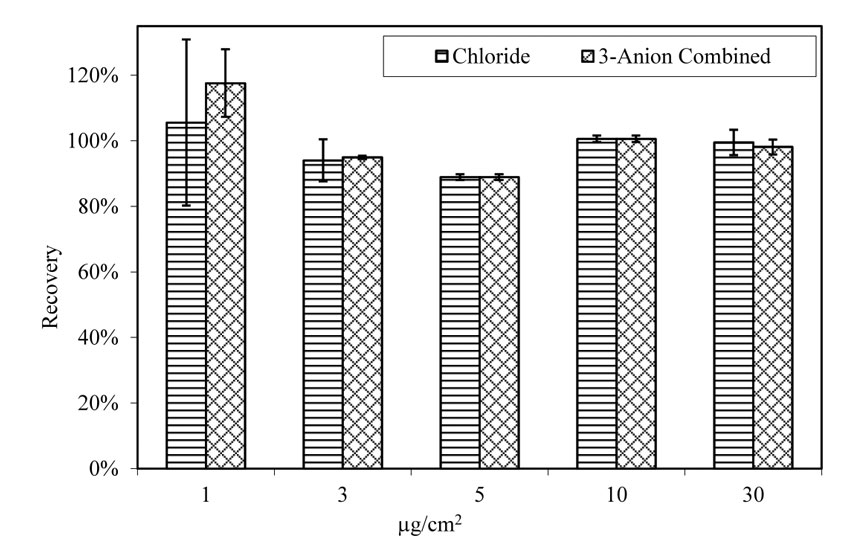
Chloride ions were retrieved from chloride doped specimens as efficiently as from specimens doped with 3-anion combined solutions, as shown in figure 20. Chloride was extracted from the steel surface in all cases, irrespective of whether the steel plate was doped with chloride only, or 3-anion combination solutions. The average recovery rate for chloride-doped specimens is 100 percent, and 98 percent for 3-anion doped specimens. The standard deviation is also very low.
| 1.0 µg/cm2 = 2.3×10⁻⁷ oz/inch2. |
Figure 20. Chart. Chloride recovery rate from doped virgin A588 steel panels. Aging for 4 h at room temperature.
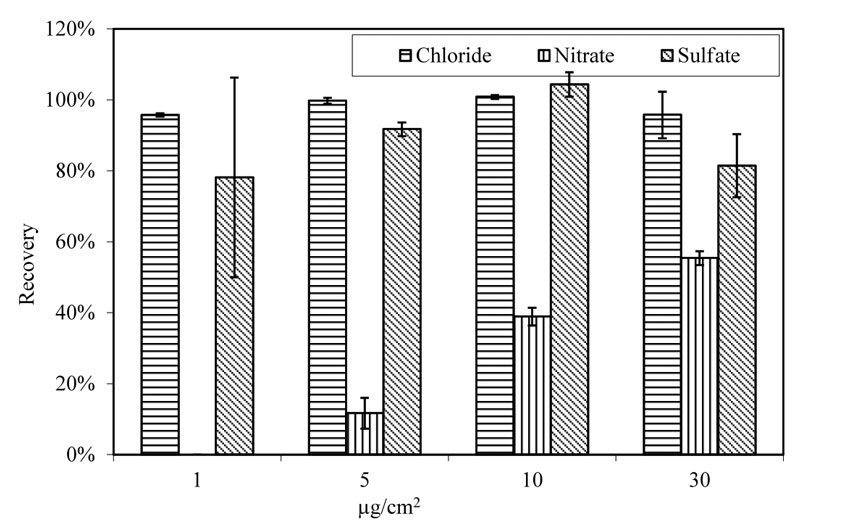
When aging conditions changed from room temperature and humidity to 100.4 ºF (38 ºC) and 78 percent relative humidity, the recovery rate for nitrate and sulfate changed significantly. Figure 21 presents the recovery rate of anions from virgin A588 steel panels that were doped with single anion solution. Chloride demonstrates a high recovery rate of 98 percent with very small standard deviation. The recovery rate for nitrate varies from zero to 55 percent. Sulfate has a recovery rate between 78 percent and 104 percent. At doping level 1 µg/cm2, nitrate was not detected in the extraction solution. At 5 µg/cm2, about 10 percent was recovered from the surface. When doping levels increased to 10 and 30 µg/cm2, the nitrate recovery rate was about 40 percent and 55 percent, respectively. The sulfate recovery rate fluctuated among the tested specimens, but on average, about 90 percent sulfate was extracted from the surface.
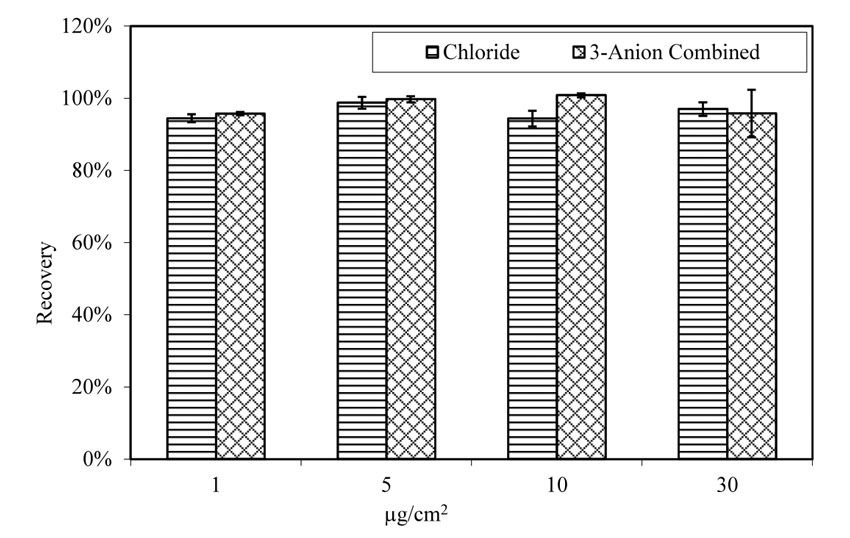
For A588 virgin steel panels doped with 3-anion solutions, chloride maintains a stable recovery rate at all doping levels, as shown in figure 22. Among 3-anion doped specimens, the average recovery rate for chloride is 96 percent. The recovery rates for chloride have small standard deviation.
| 1.0 µg/cm2 = 2.3×10⁻⁷ oz/inch2. |
Figure 21. Chart. Recovery of salts from doped virgin A588 steel panels. Aging for 4 h at 100.4 ºF (38 ºC) and 78 percent relative humidity.
| 1.0 µg/cm2 = 2.3×10⁻⁷ oz/inch2. |
Figure 22. Chart. Recovery rate of chloride from doped virgin A588 steel panels. Aging for 4 h at 100.4 ºF (38 ºC) and 78 percent relative humidity.
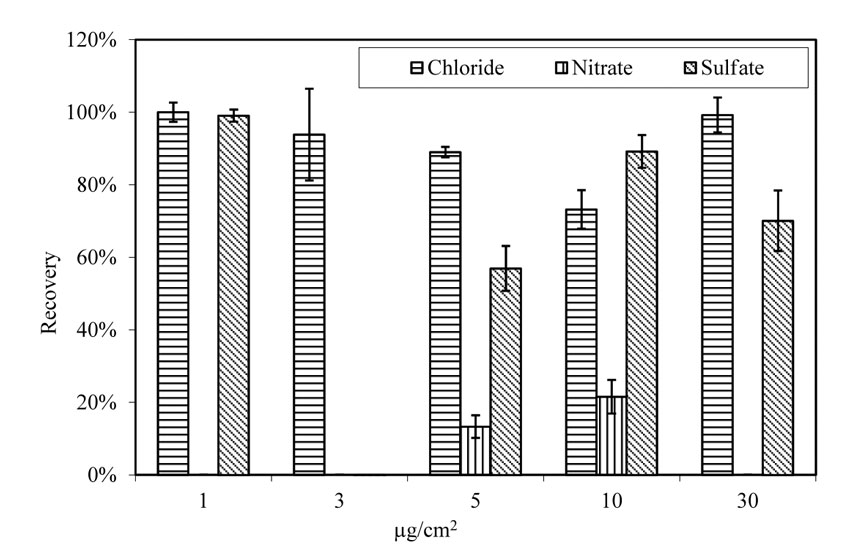
After doping and aging in a laboratory environment, the average recovery rate for chloride from the rusted and pitted A710 steel panels was comparable to that of virgin A588 steel panels, as shown in figure 23. Chloride recovery rate varies between 73 percent and 100 percent, with an average of 91 percent among the 5 doping levels. The recovery rate for sulfate fluctuates between zero and 99 percent, with an average of 60 percent. The recovery rate for nitrate is from zero to 22 percent, with an average of 7 percent. The fluctuation of chloride and sulfate recovery rate may be attributed to the background contamination of individual specimens. Nitrate demonstrated a rather different scenario, involving factors beyond the background difference of specimens. The amount of nitrate in most extraction solutions was not detectable. Of those detectable, it is possible that background nitrate existing on steel prior to doping was released to the extraction solution and contributed to the total amount of nitrate in the solution.
| 1.0 µg/cm2 = 2.3×10⁻⁷ oz/inch2. |
Figure 23. Chart. Recovery of salts from pitted steel panels. Aging for 4 h at room temperature.
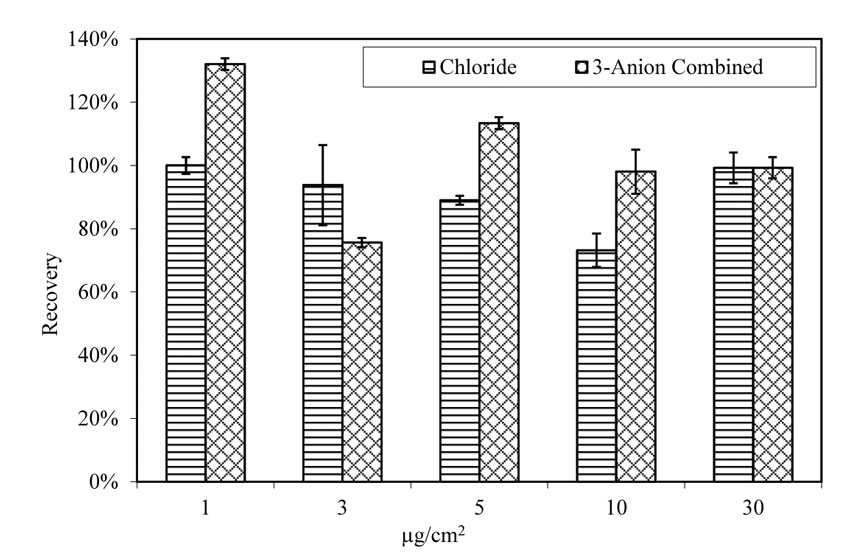
The average chloride recovery rate was not significantly affected by the existence of sulfate and nitrate on doped A710 steel panels, as shown in figure 24. When doped with chloride only, the chloride recovery rate is in the range of 73 percent and 100 percent, with an average of 91 percent. When doped with 3-anion solutions, the recovery rate is between 76 percent and 132 percent, with an average of 104 percent.
| 1.0 µg/cm2 = 2.3×10⁻⁷ oz/inch2. |
Figure 24. Chart. Recovery rate of chloride from pitted A710 steel panels. Aging for 4 h at room temperature.
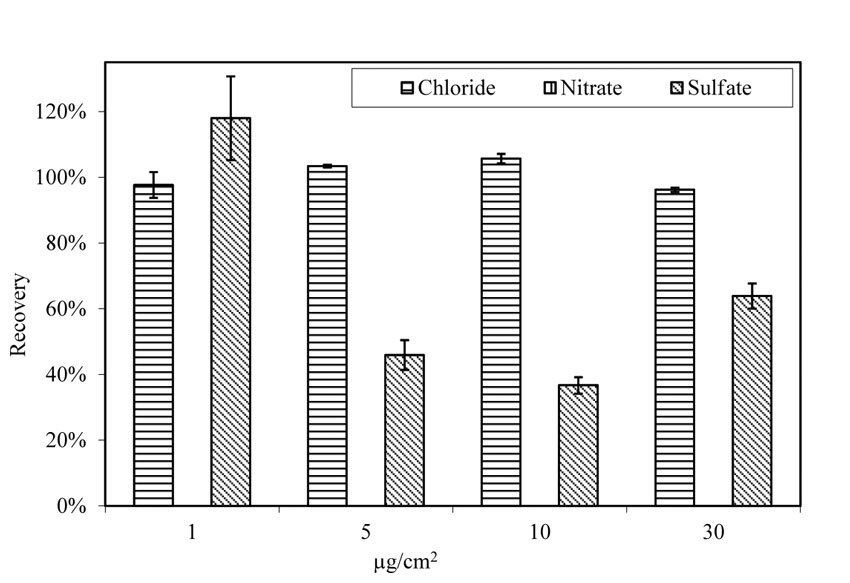
The recovery rates for doped A710 steel panels after being aged at 100.4 ºF (38 ºC) and 78 percent relative humidity for 4 h were also examined. The rusted and pitted A710 steel panels did not release any nitrate into the extraction solution, as shown in figure 25. Recovery rate for sulfate varied from 37 percent to 118 percent, with an average of 66 percent. Only chloride maintained a relatively consistent recovery rate, ranging from 96 percent to 106 percent with an average of 101 percent.
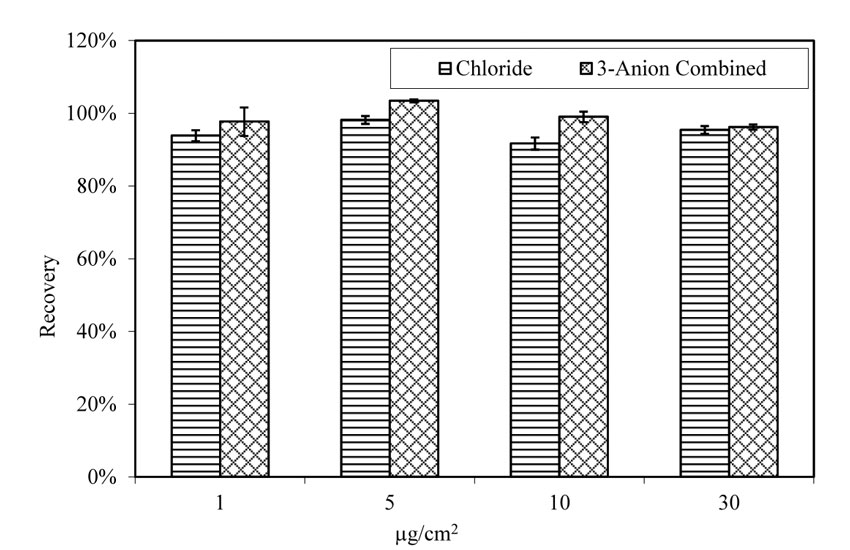
Recovery rate of chloride was not affected by the presence of sulfate and nitrate, as shown in figure 26. Recovery rate for A710 steel panels doped with chloride varies from 92 percent to 98 percent, with an average of 95 percent. The chloride recovery rate for panels doped with 3-anion solution varies between 96 percent and 103 percent, with an average of 99 percent.
| 1.0 µg/cm2 = 2.3×10⁻⁷ oz/inch2. |
Figure 25. Chart. Recovery of salts from pitted A710 steel panels. Aging for 4 h at 100.4 ºF (38 ºC) and 78 percent relative humidity.
| 1.0 µg/cm2 = 2.3×10⁻⁷ oz/inch2. |
Figure 26. Chart. Recovery rate of chloride from pitted A710 steel panels. Aging for 4 h at 100.4 ºF (38 ºC) and 78 percent relative humidity.
|
Researchers—This study was performed by Dr. Rongtang Liu, a senior chemist and corrosion engineer of SES Group and Associates, LLC. For more information about this research, contact Dr. Paul Y. Virmani, HRDI-60, 202-493-3052, paul.virmani@dot.gov or Dr. Justin Ocel, HRDI-40, 202-493-3080. Distribution—This summary report is being distributed according to a standard distribution. Direct distribution is being made to the Divisions and Resource Center. Availability—This summary report may be obtained from the FHWA Product Distribution Center by email to report.center@dot.gov, fax to 814-239-2156, phone to 814-239-1160, or online at https://www.fhwa.dot.gov/research. Key Words—Soluble salts, Corrosion, Protective coating, Extraction, Ion chromatography, Ion, Anion, Chloride, Sulfate, Nitrate. Notice—This document is disseminated under the sponsorship of the U.S. Department of Transportation in the interest of information exchange. The U.S. Government assumes no liability for the use of the information contained in this document. The U.S. Government does not endorse products or manufacturers. Trademarks or manufacturers´ names appear in this summary report only because they are considered essential to the objective of the document. Quality Assurance Statement—The Federal Highway Administration provides high-quality information to serve Government, industry, and the public in a manner that promotes public understanding. Standards and policies are used to ensure and maximize the quality, objectivity, utility, and integrity of its information. FHWA periodically reviews quality issues and adjusts its programs and processes to ensure continuous quality improvement. |