U.S. Department of Transportation
Federal Highway Administration
1200 New Jersey Avenue, SE
Washington, DC 20590
202-366-4000
Federal Highway Administration Research and Technology
Coordinating, Developing, and Delivering Highway Transportation Innovations
| REPORT |
| This report is an archived publication and may contain dated technical, contact, and link information |
|
| Publication Number: FHWA-HRT-16-008 Date: May 2016 |
Publication Number: FHWA-HRT-16-008 Date: May 2016 |
This chapter presents all the results obtained during the execution of the research project. The results are presented in three sections: (1) workability and strength, (2) dimensional stability, and (3) IC. The first section shows that all the grout-type materials selected for this study had similar initial flow along with sufficient early strength, as required for grout-type materials. (As previously mentioned, the grouts were intended to be used in the same type of application: connections between prefabricated concrete elements. Thus, the comparative criterion chosen was to have similar initial workability.) The second section is the main focus of this research and includes results on dimensional stability. While some of these results were collected using tests required by the specification for grouts (i.e., ASTM C1107), other results were obtained from additional standardized tests in order to more fully characterize dimensional stability.(1) The appropriateness of using these different tests is also discussed in this section. Finally, the third section presents the strength and dimensional stability results obtained for the internally cured cement-based grouts.
Note that all test methods used in this study are intended for use with cementitious materials. Therefore, some of the materials are not necessarily suitable for these test methods. This limitation will be further discussed in this chapter. Also, note that the exact formulation or composition of grout-type materials is typically unknown to the end-user because they are proprietary materials. As such, it can be challenging to develop causal relationships between the materials and their performance in terms of workability, reactivity, strength, and volume change.
The initial grouts' consistency (or workability), final set time, air content, and unit weight are summarized in table 4. The flow measurements were taken 7 and 15 min after the solid-water first contact except for G5 and M1, in which cases the flow was taken at 3 and 7 min due to final setting time limitations, and U3, which was only measured at 15 min. In all cases, except for the G5 grout, the material consistency at 7 min was within the plastic consistency range described in ASTM C1107, which is between 100 and 125 percent of the original base diameter of the mold used in the flow table test.(1) The flow of the epoxy grouts could not be measured due to the "sticky" nature of the material, which made it difficult to lift the mold without disturbing the material. The fact that all grouts had similar initial consistency is indicative of the possibility of using these materials in the same type of application (i.e., connections between prefabricated concrete elements). However, the consistency was not within the above mentioned range for some of the grouts at 15 min. The degree of workability loss is normally related to the type of chemical admixtures used in the material. Since the formulation in most of the materials is unknown, it is difficult to make conclusions in this regard. The 7-min flow for the U3 material could not be measured due to mixing time requirements; in any case, it exceeded the upper threshold of 125 percent at 15 min.
| Grout | Number of Drops | Flow at 7 min, Percenta | Flow at 15 min, Percent | Final Time of Set, h(35) | Air Content, Percent(33) | Unit Weight, lb/ft3(34) |
|---|---|---|---|---|---|---|
| G1 - 0.18 | 5 | 117 | 84 | 6.8 | 5.1 | 0.129 |
| G2 - 0.17 | 5 | 110 | 91 | 6.8 | 3.6 | 0.153 |
| G3 - 0.16 | 5 | 112 | 106 | 7.7 | 3.4 | 0.139 |
| G4 - 0.17 | 5 | 111 | 100 | 10.3 | 12.0 | 0.122 |
| G5 - 0.19b | 5 | 80 | 70 | 0.3 | 3.1 | 0.134 |
| E1 - high flow | c | c | c | 1.4 | 4.4 | 0.135 |
| E2 - high flow | c | c | c | 3.5 | 8.5 | 0.130 |
| F1 - 0.08 | 5 | 101 | 109 | 0.7 | 4.6 | 0.146 |
| M1 - 0.08b | 5 | 115 | 75 | 0.4 | 6.9 | 0.135 |
| M2 - 0.18 | 5 | > 125 | d | 0.3 | d | d |
| U3 - 0.18 | 5 | e | >125 | 6.9 | 3.2 | 0.160 |
1 lb/ft3 = 16.02 kg/m3
aFlow slightly changes depending on mixer used.
bFlow was measured at 3 and 7 min due to final setting time limitations.
cMaterial sticks in mold. Test cannot be performed.
dNot measured due to final setting time limitations.
eFlow was measured only at 15 min due to mixing time requirements.
It is interesting to note how the workability of the F1 grout increased from 7 to 15 min when considering the fast-setting behavior that developed. (Final set was achieved at 45 min.) Although not reported by flow values, E2 was slightly more flowable than E1. Both grouts also showed short setting times, similar to G5, F1, M1, and M2 (less than 4 h). All of these grouts were designed to be fast-setting repair materials. The kinetics of the chemical reactions of these (repair) materials may have been different from that of the cement-based grouts. For instance, G5 may have been a calcium sulfoaluminate cement-based grout, F1 appeared to be a high-calcium fly-ash-based material, M1 and M2 were polymer-modified cementitious material (i.e., magnesium phosphate), and E1 and E2 were epoxy-resinous materials. The other grouts showed final set times in the range of 6 to 10 h, as typically observed in fast-setting cement-based materials. Air content ranged from low values (3.1 percent) up to high values (12.0 percent). Unit weight values correlated to the measured air content in that high air content corresponded to low unit weight.
The strength obtained for the grouts included in this research study are presented in table 5. In addition, the compressive strength required by ASTM C1107 is shown in table 6.(1) Despite the fact that the other materials used in this research are not grouts per se (they are either repair materials or UHPC), they were tested according to the abovementioned ASTM specification due to their similar performance. As shown in table 5, all the grouts complied with the minimum strength requirements at all ages, except for the M2 grout that did not achieve the strength required at 28 d. Particular attention is given to U3, depicting strength values that considerably exceeded the minimum requirements. This is normal because this type of material is designed to exhibit exceptional mechanical and durability properties. While G5, E1, E2, F1, M1, and M2 developed strength within the first 8 h (which is consistent with the rapid setting times previously reported), a slower strength development was observed in the other cement-based grouts (G1 through G4), but still it was enough to exceed the minimum strength required at each age.
| Grout | Average Compressive Strength, psi | |||||
|---|---|---|---|---|---|---|
| 4 h | 8 h | 1 d | 3 d | 7 d | 28 d | |
| G1 - 0.18 | a | a | 3,713 (62)b | 5961 (128) | 6,541 (141) | 7,281 (335) |
| G2 - 0.17 | a | a | 5,018 (109) | 7,150 (222) | 8,833 (15) | 9,805 (219) |
| G3 - 0.16 | a | a | 4,424 (120) | 7,092 (321) | 7,600 (170) | 9,805 (290) |
| G4 - 0.17 | a | a | 2,408 (75) | 3,800 (110) | 5,149 (25) | 6,338 (60) |
| G5 - 0.19 | 6,991 (238) | 7,556 (255) | 8,224 (409) | 10,153 (205) | 11,008 (203) | 10,428 (94) |
| E1 - high flow | 696 (71) | 5,424 (215) | 10,283 (67) | 10,051 (157) | 11,095 (231) | 11,168 (486) |
| E2 - high flow | a | 1,224 (20) | 8,137 (210) | 10,660 (46) | 11,197 (55) | 13,547 (474) |
| F1 - 0.08 | 4,496 (30) | 5,018 (197) | 5,062 (152) | 6,382 (128) | 8,006 (149) | 8,137 (55) |
| M1 - 0.08 | 4,641 (297) | 4,525 (59) | 6,237 (307) | 6,512 (277) | 6,411 (180) | 7,817 (341) |
| M2 - 0.18 | 3,960 (86) | 4,322 (126) | 4,670 (197) | 4,946 (97) | 4,485 (43) | 4,767 (207) |
| U3 - 0.18 | 93 (17) | 734 (23) | 13,510 (41) | 18,811 (500) | 19,159 (231) | 24,714 (131) |
1 psi = 0.007 MPa
aMaterial had not set yet or it was still too weak to be tested.
bNumbers in parentheses indicate one standard deviation in psi as determined for three replicate specimens tested at each age.
| Testing Age (d) | Compressive Strength, psi |
|---|---|
| 1 | 1,000 |
| 3 | 2,500 |
| 7 | 3,500 |
| 28 | 5,000 |
1 psi = 0.007 MPa
A detailed material characterization is needed to better understand the workability and strength development results. As previously mentioned, the degree of workability loss is normally related to the type of chemical admixtures used in the material. On the other hand, strength gain, at least for the cement-based grouts and the UHPC (G1, G2, G3, G4, and U3), directly depends on the raw material composition, reactivity, fineness, capillary porosity (i.e., initial water content), and the degree of hydration achieved (0 to 1). The degree of hydration was expected to be close to 1, at least for the cement-based grouts, since the w/b is likely high when considering the binder content of each grout (as already explained in the Mixture Proportioning with IC section in chapter 3). G5 was also a cement-based grout; however, a fast-set cement type (e.g., calcium sulfoaluminate) is suspected to have been included due to the high strength development after a few hours of hydration. Therefore, the strength development in G5 is mainly driven by the reactivity of the material. Similar reasons might be given to explain the early strength achieved in the other type of materials (E1, E2, F1, M1, and M2). The kinetics of the chemical reactions in these materials is different from that of cement-based grouts. E1 and E2 are two-component, epoxy-based materials in which a chemical reaction occurs when the resin (component A) is mixed with the hardener (component B) to form polymers; thus, the reactivity depends on the type of polymerization. M1 and M2 are magnesium phosphate-based materials where magnesia and phosphate react with water to form magnesium phosphate to provide strength. Finally, F1 appears to be a high-calcium fly-ash-based material with some kind of polymerization (i.e., activation), which also depends on the type of polymers that form in the system.
Typically, chemical reactions occurring in grout-type construction materials result in volume changes of the materials. This means that the evaluation of the extent and rate of reaction would be indicative of the amount of volume change occurring in the system. Since most of these reactions are exothermic, this can be done by measuring the heat that is released when the solids react with the mixing water. However, heat being released is only indicative of the reaction occurring in the system. In order to evaluate whether this reaction implies expansion or contraction of the material, it would be necessary to use other (chemical) tests. This was not done in this research. Thus, the reactivity results included in this report only provide important contextual information of the timing of key reactions taking place.
The heat release was measured using an isothermal calorimeter. The results are shown in figure 16 (note different scale in the X-Y axis of both plots). The results were normalized by the initial porosity of the mixes (i.e., ounces (milliliters) of mixing water), which is common practice when comparing different materials with different water contents, as in this case. As observed in figure 16, the cementitious grouts G1, G2, G3, and G4 as well as the U3 depicted calorimetry curves typical from cementitious materials (i.e., with two differentiable peaks, one that is indicative of silicates reaction, and the other one that is indicative of aluminates reaction). The main (first) peak times in these materials ranged from 8 to 12 h. M1 and M2 also showed twodifferentiable peaks, but they occurred much faster than in the cementitious grouts (within the first hour). In addition, the magnitude of these peaks was much larger than that of the cementitious grouts. The fast reaction seemed to be common in magnesium phosphate-based materials, typically used as repair materials. Both E1 and E2 only showed one main peak at about 2 h after mixing. Similarly, the other two repair materials (F1 and M2) only showed one main peak, but this occurred faster and in a larger magnitude compared with that of E1 and E2. The appropriateness of using isothermal calorimetry to measure the heat release in repair materials is questionable due to the very fast reaction as well as the very large heat values observed. A different approach to measure the reactivity of some of the repair materials may be more appropriate.
 (top) and repair materials (high heat) (bottom). This figure shows two scatter plots with smooth lines. The top graph plots seven low heat release grout materials (G1, G2, G3, G4, U3, E1, and E2). The y-axis shows heat flow from 0 to 24 mW/mL liquid, and the x-axis shows time from 0 to 24 h. The bottom graph plots four high heat release grout materials (G5, F1, M1, and M2). The y-axis shows heat flow from 0 to 500 mW/mL liquid, and the x-axis shows time from 0 to 4 h. The plots show the rate of heat release (i.e., heat flow) from the grout materials measured using an isothermal calorimeter. The y-axis shows heat flow from 0 to 24 mW/mL liquid and from 0 to 500 mW/mL liquid in the top plot and the bottom plot, respectively. The x-axis shows time from 0 to 24 h and from 0 to 4 h in the top plot and the bottom plot, respectively. The time and magnitude of the maximum rate of heat release changes from grout to grout, indicating the different reactivity of the materials.")
1 oz = 29.6 mL
Figure 16. Graph. Heat flow during the first hours of reaction: no repair materials (low heat) (top) and repair materials (high heat) (bottom).
ASTM C1107 evaluates the dimensional stability of grouts in terms of the change in height of cylindrical specimens.(1) The specification establishes maximum and minimum height change values that can be measured using two ASTM standard specifications: (1) ASTM C827 for fresh-stage height changes and (2) ASTM C1090 for hardened-stage height changes.(39,40) The height change requirements are shown in table 7.
| Early Age Height Change Maximum Percent at Final Set (ASTM C827)(39) | Hardened Height Change Maximum and Minimum Percent at 1, 3, 14, and 28 d (ASTM C1090)(40) |
|---|---|
| + 4.0 | + 0.3 0.0 |
The height change results obtained at early ages (i.e., fresh stage) are presented in figure 17. The measurements were collected following a modified version of the ASTM C827 specification (figure 12 (left)).(39) The results show that none of the mixtures exceeded the 4 percent maximum expansion allowed by ASTM C827 (indicated by a dashed line). However, some of the grouts exhibited a height reduction. These include two of the cement-based grouts (G3, G5), the UHPC (U3), and the non-cement-based grouts (F1, E1, E2, and M1). M2 could not be tested due to setting time limitations. The reduction in height was less than 1 percent for all cases, except for G3 and E1, which exceeded this value. ASTM C1107 does not specify any height reduction limitation during the fresh stage (table 7).(1) However, if it is assumed that the specification does not allow any reduction in height, then these grouts exhibiting height reduction would not comply with the standard. On the other hand, if ASTM C1107 is read to only limit the height increase, then all of the grouts comply with the standard. In all cases, a relatively rapid increase or decrease in height is observed from the beginning of the test until each of the grouts reaches final set (see table 4 for setting times), after which the curves transition to a plateau.
 diameter by 6-inch (152.4-mm)-tall cylindrical grout specimens as a function of time in accordance with ASTM C827. Only one specimen was tested for each grout. The y-axis shows the height change from -3 to 5 percent, and the x-axis shows time from 0 to 24 h. The results obtained for G1, G3, G5, E2, M1, G2, G4, E1, F1, and U3 grout materials included in the research study are shown. (M2 is not shown.) The scatter results show how three of the grouts tested (G1, G2, and G4) experience a positive height change, whereas the other seven grouts show experience a negative height change.")
Note: Only one specimen was tested for each grout.
Figure 17. Graph. Change in height at early ages according to a modified version of ASTMC827.(39)
This test provides information about volume changes occurring between the time immediately after mixing and that of final set. The volume changes measured include: expansion (e.g., expansive agents and thermal), chemical and autogenous shrinkage (which before set have similar values), surface settlement, plastic shrinkage due to drying of the specimen from the top surface, and some error given by the settlement of the ball on the top surface of the sample.(44) Due to the presence of all these parameters, the measurements are primarily useful for comparative purposes.
Table 8 shows the height change results obtained during the hardened stage, according to ASTMC1090.(40) In a general sense, it is not possible to quantitatively compare the results obtained during the first 24 h with those in figure 17 (fresh stage) since the curing conditions are different. In the C1090 case, the specimens were sealed in a plastic bag throughout the test duration; therefore, the parameters that can be considered in this test are chemical and autogenous shrinkage and surface settlement. In other words, the change in height does not include the effects of drying. As with the early height change test, the results are merely comparative.
| Grout | Average Height Change of Hardened Grout at a Given Age (Percent)a | ||||
|---|---|---|---|---|---|
| 1 d | 3 d | 7 d | 14 d | 28 d | |
| G1 - 0.18 | 0.0 | 0.0 | 0.0 | 0.0 | 0.0 |
| G2 - 0.17 | 0.0 | 0.0 | 0.0 | 0.0 | 0.0 |
| G3 - 0.16 | -1.2 | -1.2 | -1.2 | -1.2 | -1.2 |
| G4 - 0.17 | 0.0 | 0.0 | 0.0 | 0.0 | -0.1 |
| G5 - 0.19 | -0.7 | -0.7 | -0.7 | -0.7 | -0.7 |
| E1 - high flow | -0.2 | -0.2 | -0.2 | -0.2 | -0.2 |
| E2 - high flow | -0.2 | -0.2 | -0.2 | -0.2 | -0.2 |
| F1 - 0.08 | -0.2 | -0.2 | -0.2 | -0.2 | -0.2 |
| M1 - 0.08 | -0.1 | -0.1 | -0.1 | -0.1 | -0.1 |
| M2 - 0.18 | b | b | b | b | b |
| U3 - 0.18 | -0.4 | -0.4 | -0.4 | -0.4 | -0.4 |
aMaximum and minimum expansion allowed by ASTM C1090 is 0.3 and 0.0 percent, respectively.(40)
bM2 could not be tested due to setting time limitations.
The results show that three of the cement-based grouts (G1, G2, and G4) did not exhibit any contraction or expansion throughout the test duration. It is interesting to note that these are the same grouts that exhibited expansion in the ASTM C827 test (see figure 17).(39) One aspect to point out about the ASTM C1090 test procedure is that the glass plate used to cover the top surface of the specimen during the first 24 h prevented the specimen from expanding.(40) The glass plate was held down with a plunger that was attached to a bridge. This is the reason why none of the grouts expanded within the first day, when expansive agents (if present) would act to counteract the possible shrinkage. The rest of the grouts showed a decrease in the specimen height, with the greatest decrease exhibited by G3. These are the same grouts that showed a height reduction in figure 17. M2 could not be tested due to setting time limitations. As already mentioned, the curing conditions of ASTM C827 and ASTM C1090 test methods are different (sealed versus drying); however, the same trends were observed in regards to the height increase or reduction.(39,40) Therefore, due to the fact that ASTM C1090 does not permit any height reduction, all grouts exhibiting a cumulative height reduction (i.e., G3, G5, E1, E2, F1, M1, M2, and U3) are considered to have not met the requirements of ASTM C1107.(1)
As mentioned before, many of the grouts tested do not appear to comply with ASTM C1107 in terms of height reduction.(1) On the other hand, some of the cementitious grouts, including G1, G2, and G4, show either expansion or an absence of both expansion and contraction (depending on the test method used). Hence, a user might infer from the test method that these three materials do not shrink. This is very important because shrinkage may result in shrinkage cracking (causing the degradation of the material) and could, in the type of application studied in this research, also imply loss of bond to the concrete substrate. This section is focused on pure shrinkage deformations in both sealed (i.e., autogenous) and drying conditions, these being cases not considered by the ASTM C1107 standard.(1) These curing conditions are important from the viewpoint of the materials' application because some of the precast connections will be largely enclosed (sealed), while others will be partially exposed to the environment (drying).
The autogenous shrinkage results measured in accordance with ASTM C1698 are presented in figure 18.(3) The results are expressed as a function of time, from the time of final set to 7 d of reaction. Some of the grouts solely exhibited shrinkage (G2, G3, and U3), others showed an initial expansion followed by shrinkage (G1 and G4), and others exhibited a fairly constant expansion at all times (F1 and M1). While E1 and E2 could not be tested due to the difficulty of properly consolidating the material in the corrugated tubes, G5 and M2 were not tested due to setting time limitations. As mentioned before, this test is designed for cementitious materials, typically more fluid and with longer setting times than these non-cementitious and repair materials type. Finally, U3 was prepared without steel fibers due to the difficulty encountered when attempting to insert the fiber reinforced material into the corrugated tubes. If fibers were added, less shrinkage deformation would be expected due to the internal restraint provided by the fibers.
 shrinkage as a function of time via ASTM C1698. This scatter plot with lines shows the measured autogenous (sealed) shrinkage as a function of time via ASTM C1698. Only 7 out of the 11 grouts included in the research study are shown: G1, G2, G3, G4, F1, M1, and U3. The y-axis shows the measured autogenous shrinkage from -400 to 400 microstrain, and the x-axis shows time from 0 to 7 d. Error bars indicate one standard deviation as determined for three replicate specimens. Some of the grouts solely exhibit shrinkage (G2, G3, and U3), others show an initial expansion followed by shrinkage (G1 and G4), and others exhibit a fairly constant expansion at all times (F1 and M1).")
Note: Error bars indicate one standard deviation as determined for three replicate specimens.
Figure 18. Graph. Autogenous (sealed) shrinkage as a function of time via ASTM C1698.(3)
As seen in figure 18, all of the cement-based grouts used in the study, including UHPC, show autogenous shrinkage at some point, which is common in cement-based materials. It is worth mentioning that the cement-based G1 grout also shrinks, despite showing a net positive deformation of about 70 με after 7 d. When evaluating the risk of shrinkage cracking, the net difference between the maximum and minimum deformations achieved during the test should be considered.(45) Typically in cement-based grouts, low w/s decreases particle spacing (and pore sizes), contributing to an increase of the autogenous shrinkage. However, "non-shrink" grout-type materials are usually designed to undergo autogenous expansion during the first hours of the hydration reaction by means of additives such as ettringite and/or gas generation.(6) Therefore, a competition between autogenous shrinkage and autogenous expansion occurs. In this regard, it is interesting to note that some of the curves were basically flat during the first few hours after initial set, as in the cases of the G2 and G3 grouts, which suggests a balance between expansion and contraction, not an absence of both. This is a desirable attribute for these grouts, but as evidenced by the illusory nature of this attribute for these and other grouts, it is clear that maintaining dimensional stability during setting and curing is a challenge. In the case of non-cementitious grouts (F1 and M1), the autogenous deformation was practically constant throughout the test. This might be attributed to the different type of chemical reaction taking place in these systems. Their chemical reaction might not involve any volume reduction (chemical shrinkage) at all. In the case of F1, the expansion observed might be attributed to some thermal effects associated to the reactions.
Special interest is given to the reason why some of the cement-based grouts expanded. As mentioned before, the first expansion and subsequent shrinkage might be due to expansive reactions such as the formation of ettringite (and, in lesser degree, to small thermal effects). Then, when the ettringite is later converted to monosulfate or monocarbonate phases, the stress producing the expansion might be released, and the specimen would shrink back toward its former state. This has been confirmed with SEM images as shown in figure 19. Additional autogenous shrinkage tests were being performed during the preparation of this report where some (inert) limestone particles were added to try to stabilize the ettringite formed at early ages and eliminate some of the later age autogenous shrinkage. Preliminary results show a reduction of the subsequent autogenous shrinkage. It is then conjectured that this shrinkage was due not to self-desiccation but rather to the loss of restraint as ettringite needles dissolved and were converted into monosulfate. While the main scope of the current research is to simply evaluate volume stability in grout-type materials, other research efforts are currently underway to facilitate a better characterization of the grouts so that the shrinkage results can be further explained from a fundamental basis. For instance, quantitative x-ray diffraction over time as well as isothermal calorimetry is being used to give some indication of what is happening chemically.
 phase formation in the matrix at 2 d of hydration (left). The photo shows a scanning electron microscope (SEM) image with a magnification of 15,000x of the main type of crystals observed in the G3 grout after 2 d of hydration. There is a microstructure dominated with needle-shape ettringite crystals.")
Note: conversion involved chemical shrinkage.
Figure 19. Photo. Representative SEM images of the G3 grout: predominant ettringite (needle-shape) phase formation in the matrix at 2 d of hydration.
Long-term autogenous shrinkage (up to 6 mo) has been measured by means of the ASTM C157 test method.(2) The four sides of 1- by 1- by 12-inch (25- by 25- by 305-mm) prismatic specimens were sealed, and the length change was monitored. The results are presented in figure 21. Autogenous shrinkage obtained using the corrugated tubes and the (sealed) ASTM C157 test procedure was compared during the first 7 d, resulting in similar deformations in all cases, as shown in figure 20 for the G3 grout. This was also previously demonstrated by Sant et al.(44) Therefore, sealed specimens can be used with ASTM C157 to determine long-term autogenous shrinkage. All the curves in figure 21 start at 1 d and have been plotted so as to initiate at the corresponding strain values measured with the ASTM C1698 corrugated tubes test at 1 d for each of the grouts.(3) The largest values of sealed shrinkage after 184 d of reaction (about 500 to 700 με) were observed for the cementitious grouts (G2, G3, and G4). The large initial expansion observed in G1 helped in reducing the final shrinkage value to about 200 με . The other two cementitious materials (G5 and U3) showed reduced shrinkage values (in the order of 300 < μ ε), although those were still large values considering that the materials are maintained in sealed conditions. These values are similar to those obtained for the epoxy-based grouts (E1 and E2). On the other hand, M1 showed very low values of shrinkage (about 50 με), and F1 depicted a net expansion (positive deformation) of about 50 με throughout the test duration. M2 could not be tested due to setting time limitations.
 shrinkage as a function of time via ASTM C1698 and ASTM C157, respectively. The y-axis shows the measured autogenous shrinkage from -400 to 400 microstrain, and the x-axis shows time from 0 to 7 d. The results obtained using corrugated tube specimens (ASTM C1698) containing a fresh sample of the G3 grout are compared with those obtained using 1- by 1- by 11.25-inch (25.4- by 25.4- by 285.8-mm) prism specimens (ASTM C157) also containing a fresh sample of the G3 grout. The results show similar shrinkage deformations during the first 7 d of grout hydration.")
Figure 20. Graph. Comparison of autogenous shrinkage results obtained using the ASTMC1698 corrugated tubes and the ASTM C157 sealed specimens.(3,2)
 shrinkage as a function of time. This scatter plot with lines shows the long-term autogenous (sealed) shrinkage as a function of time according to ASTM C157. The results shown belong to 10 of the 11 grout materials selected in this research study (M2 grout results are not shown). The y-axis shows the measured autogenous shrinkage from -1,000 to 200 microstrain, and the x-axis shows time from 0 to 196 d. Error bars indicate one standard deviation as determined for four replicate specimens. The largest values of sealed shrinkage after 184 d of reaction (about -500 to -700 microstrain) are observed for the cementitious grouts (G2, G3, and G4). The large initial expansion observed in G1 helps in reducing the final shrinkage value to about -200 microstrain. The other two cementitious materials (G5 and U3) show reduced shrinkage values (around -300 microstrain). These values are similar to those obtained for the epoxy-based grouts (E1 and E2). On the other hand, M1 shows very low values of shrinkage (about -50 microstrain), and F1 depicts a net expansion (positive deformation) of about 50 microstrain throughout the test duration.")
Note: error bars indicate one standard deviation as determined for four replicate specimens.
Figure 21. Graph. Long-term autogenous (sealed) shrinkage as a function of time.
Other specimens were also maintained in drying conditions at 50 ±5 percent RH to evaluate drying shrinkage (figure 22). Again, the curves start at 1 d and have been plotted so as to initiate at the corresponding strain values measured with the ASTM C1698 corrugated tubes test at 1 d for each of the grouts.(3) It is evident that the drying effect increased shrinkage in the cementitious materials (G1 through G4) by at least 1,000 με. Note that y-axis scale is different from that in figure 21. The increase in shrinkage is also evident in the G5 grout by about 400 με. Similarly, there was an increase in the shrinkage measured for the F1 and M1 materials with respect to sealed conditions. In this case, shrinkage values of about 50 and 300 με were observed, respectively. Finally, it is interesting to note that E1, E2, and U3 showed approximately the same amount of shrinkage as was observed in sealed conditions. M2 could not be tested due to setting time limitations.
. The y-axis shows the measured autogenous shrinkage from 2,500 to 500 microstrain, and the x-axis shows time from 0 to 196 d. Error bars indicate one standard deviation as determined for four replicate specimens. The largest values of drying shrinkage after 184 d of reaction (from -1,500 to -2,500 microstrain) are observed for the cementitious grouts (G1–G4). G5 and U3 show reduced shrinkage values of approximately -750 and -300 microstrain, respectively. E1, E2, F1, and M1 show drying shrinkage values below -300 microstrain after 184 d of hydration.")
Note: error bars indicate one standard deviation as determined for four replicate specimens.
Figure 22. Graph. Long-term drying shrinkage as a function of time.
When focusing on the cement-based grouts (G1–G4), it is interesting to note that three of them (G2, G3, and G4) showed a considerable amount of shrinkage (approximately 500 to 700 με) considering that they were cured in sealed conditions (see figure 21). The large initial expansion observed in G1 (see figure 18) helped in reducing most of its final shrinkage (about 200 με). However, prior research has demonstrated that the rate of shrinkage (i.e., the slope of the autogenous shrinkage response) and the differential shrinkage are more critical parameters than the final shrinkage value when considering whether a material is prone to shrinkage cracking.(46) The drying results for these cementitious grouts show that drying shrinkage was at least 1,000 με larger than sealed shrinkage due to the additional drying effect contributing to shrinkage. Drying shrinkage is typically dependent on the water content (i.e., w/c or w/b). The higher the w/b, the larger the capillary pores, the faster they will dry out. This might be the case in these cement-based grouts, as the drying shrinkage values are high.
The two epoxy grouts used in this research show lower shrinkage values (100 to 400 με) regardless of the curing condition. The reaction that occurs in this type of grout might undergo very small volume changes. Similarly, the UHPC used (U3) showed considerably lower shrinkage in both sealed and drying conditions (about 200 με) compared with the cement-based grouts, despite being a cementitious material. It is interesting to note that U3 depicted larger autogenous shrinkage in the corrugated tube test during the first 7 d compared with the other cement-based grouts (see figure 18). As a reminder, the corrugated tube test was performed without steel fibers. This is a good indication that the steel fibers typically included in the U3 mixture design contribute to eliminating some of the shrinkage taking place in the system.
As for the repair materials used (G5, F1, and M1), they showed lower shrinkage values than cement-based grouts and similar values to the epoxy grouts and the UHPC. Among them, G5 seemed to have larger values of shrinkage (about 800 με in drying conditions) due presumably to its cementitious nature. However these values are still much lower than the cement-based grouts. Finally, F1 and M1 did not depict any autogenous shrinkage after 6 mo, and their drying shrinkage values were very low (in the order of 300 με), possibly due to similar reasons as in the case of epoxy grouts wherein the reaction that occurs in these materials might be associated with very small volume changes.
Based on the dimensional stability results obtained with the ASTM test methods recommended by ASTM C1107, the grouts selected in this study comply with this standard in terms of expansion.(1) However, some of the grouts showed a certain degree of height reduction that could presumably be referred to as shrinkage; however, the presence of other parameters (e.g.,settlement) might lead to a misinterpretation of these results. A more fundamental approach must then be taken in order to understand whether this height reduction is due mainly to shrinkage deformations or not, and this was done by measuring pure expansion/shrinkage deformations as described by ASTM C1698 and by ASTM C157 in both sealed and drying conditions.(3,2) The results obtained in these tests show, contrary to what was previously mentioned, that all of the tested cementitious grouts undergo shrinkage at some point (in some cases, preceded by a small expansion), especially in drying conditions. This is an important finding because there appears to be a widely held misunderstanding of the performance of these "non-shrink" cementitious grouts. This misinterpretation of performance could lead to inappropriate expectations for the performance of these materials, particularly when used in connections for PBEs.
On the other hand, the two epoxy grouts, along with the repair materials and UHPC used in this research, underwent low shrinkage in both sealed and drying conditions. The relative dimensional stability of these materials could provide a significant advantage when deployed in connections between prefabricated concrete elements.
As already mentioned, ASTM C1107 references two other ASTM test methods to evaluate dimensional stability in grouts.(1) These are ASTM C827 (for fresh-stage height changes) and ASTM C1090 (for hardened-stage height changes).(39,40) Each of these tests was observed to deliver results that do not provide a complete picture of the dimensional stability of the tested materials.
A modified version of the ASTM C827 was previously proposed and used in this research for several reasons.(41) The original setup of this test (i.e., projector lamp, magnifying lens, and indicator charts) is time-consuming because of the need to manually record the increase/decrease in specimen height. The test also shows a clear propensity toward human error as it is difficult to clearly define the edge of the ball on the indicator charts since the shadow loses focus as the ball moves up or down. Another issue of using the original setup described in ASTM C827 is that the cylindrical specimen is not completely unrestrained.(39) As previously mentioned, there is always a certain degree of friction between the specimen's sides and the inner surface of the metallic mold. This is why, in order to provide the lowest friction possible, an acetate sheet was used between the test specimen and the mold. Although not shown in this report, specimens were also prepared without the acetate sheet, with results showing slightly smaller height changes (increase or decrease), due to a slight increase in the degree of restraint. Thermal effects (normally expansion) could also be assessed by measuring the temperature of the test specimen throughout the test.
As for ASTM C1090, this test method has the previously mentioned shortcoming of not allowing the specimens to expand during the first hours of the material's properties development due to the presence of the glass plate.(40) Another issue is that it is sometimes difficult to remove the glass plate from the top surface of the specimen, especially when using grout-type materials as opposed to cement-based materials (e.g., epoxy-resinous). This problem can be resolved by using a piece of acetate sheet in between the glass plate and the top surface of the specimen. It is also recommended to use acetate sheet to reduce most of the friction (i.e., restraint) between the specimen and the mold.
Common shortcomings for both of these test methods include the consideration of the simultaneous occurrence of several parameters (expansion, chemical and autogenous shrinkage, surface settlement, plastic shrinkage, etc.). Due to the presence of all these parameters, the measurements are more useful for comparative purposes but are less useful for quantitative assessment of shrinkage or expansion propensity. In addition, none of these test methods assess drying shrinkage, which has been shown to be a major component of the overall shrinkage. While ASTM C1090 is executed in sealed conditions, ASTM C827 only allows for a small exposed surface area and thus a reduced drying shrinkage component.(40,39) Finally, both standards could benefit from increased clarity in their definition of shrinkage and expansion limits within particular timeframes. For instance, in the case of using the ASTM C827 test method, a mixture could expand more than 4 percent during its fresh stage and return to a value below 4 percent before reaching final set, thus apparently still meeting the standard.(39)
Because all cementitious grouts used in this research showed shrinkage, it was decided that twoof them could be modified so that IC was included. This was done using prewetted LWAs at a dosage calculated using the equation in figure 3. As already mentioned, grouts are sometimes extended with normal weight aggregates, commonly for castings with dimensions of 6 inches (152.4 mm) or more. IC can be thought of as an extension of the grouts using prewetted LWA rather than normal weight aggregate. The idea behind using IC is to improve dimensional stability by reducing shrinkage, especially during the first days when the tensile strength of the material is still low. One of the terms needed for using figure 3 is the chemical shrinkage of the reactive fraction of the solid of each grout. Therefore, chemical shrinkage measurements for two of the cement-based grouts are presented in figure 23. The chemical shrinkage results are typically normalized by grams of binder (reactive material). As observed, both grouts provided the same amount of chemical shrinkage after 28 d of measurements. However, it is evident that G4 showed a higher rate of chemical shrinkage during the latter half of the timeframe, as indicated by the slope of the curve. This might be due to the estimated larger amount of reactive material in this grout as compared with that of G2 (see Mixture Proportioning with IC section in chapter 3). This is in agreement with the petrographic analysis in which the amount of measured reactive material of G2 and G4 was approximately 30 and 35 percent, respectively. By plotting the chemical shrinkage results as a function of the inverse of the time, it is possible to estimate the infinite chemical shrinkage needed for figure 3. This was done, and values of 1.99 and 2.15 fl oz/lb (0.13 and 0.14 mL/g) binder were obtained for G2 and G4, respectively, which again is in agreement with the larger amount of reactive material present in G4 based on the petrographic analysis. In other words, the G4 grout needs more prewetted LWA due to the larger infinite chemical shrinkage compared with G2 (see table 3).
 binder, and the x-axis shows time from 0 to 35 d. Error bars indicate one standard deviation of three replicate specimens. While the G2 grout shows a faster chemical shrinkage development, the G4 grout ends up having the same amount of chemical shrinkage after 28 d of hydration (0.115 fl oz/oz (0.12 mL/g) binder).")
1 fl oz/lb = 0.065 mL/g
Note: error bars indicate one standard deviation of three replicate specimens.
Figure 23. Graph. Chemical shrinkage as a function of time of two of the cement-based grouts.
Both autogenous and drying shrinkage were measured in the two cement-based grouts where IC was included. The results are shown in figure 24 (autogenous shrinkage via corrugated tubes test) and figure 25 (long-term autogenous and drying shrinkage).
When IC was added, the autogenous shrinkage component was removed, and the "true" expansive nature of the binder was revealed, as shown in figure 24. Long-term results are presented in figure 25. Again, the curves start at 1 d and have been zeroed to the corresponding strain measured with the corrugated tubes test at 1 d for each of the grouts. As can be observed, IC totally eliminates autogenous shrinkage during the first days of hydration reaction, resulting instead in a small autogenous expansion, perhaps due to ettringite formation and/or swelling of the cement hydration products due to water absorption. Less drying shrinkage is also observed despite their higher overall water content and greater mass loss during drying. The partial reduction would presumably correspond to two different reasons: (1) mitigation of autogenous (or internal) drying, and (2) extension in the time it takes to reach equilibrium with the local drying environment, because it may take longer to empty out the same-sized pores in the system with IC versus the system without IC.
 shrinkage as a function of time via ASTM C1698. Only 2 out of the 11 grouts included in the research study were designed to have internal curing (IC): G2 and G4. Thus, the plot shows four different curves: G2, G4, G2 with IC, and G4 with IC. The y-axis shows the measured autogenous shrinkage from -400 to 400 microstrain, and the x-axis shows time from 0 to 7 d. Error bars indicate one standard deviation as determined for three replicate specimens. While both G2 and G4 grouts without IC exhibit negative deformations after 7 d of hydration, the same grout materials with IC exhibit a net positive deformation (i.e., expansion) throughout the duration of the test (7 d)")
Note: error bars indicate one standard deviation as determined for three replicate specimens.
Figure 24. Graph. Effect of IC on the autogenous shrinkage.
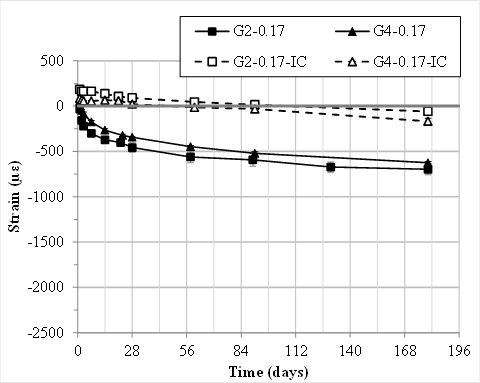
 shrinkage (top) and long-term drying shrinkage (bottom) as a function of time. This figure shows into two scatter plots with lines in a vertical layout. The top plot shows the measured long-term autogenous (sealed) shrinkage as a function of time, and the bottom plot shows the measured long-term drying shrinkage as a function of time, both according to ASTM C157. Only 2 out of the 11 grouts included in the research study were designed to have internal curing (IC): G2 and G4. Thus, both plots show four different curves: G2, G4, G2 with IC, and G4 with IC. The y-axis in both plots shows the measured autogenous shrinkage from -2,500 to 500 microstrain, and the x axis in both plots shows time from 0 to 196 d. Error bars indicate one standard deviation as determined for four replicate specimens. In the top plot, the results obtained in the grouts with IC show the elimination of the autogenous shrinkage during the first days of hydration reaction, resulting instead in a small autogenous expansion. After 184 d, both of these grouts have reduced autogenous shrinkage (about -200 microstrain) compared with that of the grouts without IC (about -700 microstrain). In the bottom plot, the results obtained in the grouts with IC show a reduction of the autogenous shrinkage after 184 d (about -1,400 microstrain) compared with that of the grouts without IC (from -2,200 to 2,500 microstrain).")
Note: error bars indicate one standard deviation as determined for four replicate specimens.
Figure 25. Graph. Effect of IC on the long-term autogenous (sealed) shrinkage (top) and long-term drying shrinkage (bottom) as a function of time.
The inclusion of prewetted LWA to provide IC was not expected to reduce the strength development of the grouts. In fact, other research has reported increases in the strength development at later ages, presumably due to an increase in the degree of hydration as well as the formation of a finer microstructure.(23) The effect that IC has on the strength development of the grouts used in this study is presented in table 9. IC clearly increases the strength in the G2 grout and maintains it in the case of G4. The reason for the different strength development of the twointernally cured grouts is not clear because they are proprietary materials with unknown formulations. Normally, IC would increase the degree of hydration of the system; however, this parameter was not measured. Nevertheless, these two grouts have shown enough early strength with or without IC so that the strength requirements in ASTM C1107 are fulfilled.(1)
| Grout | Average Compressive Strength, psi | |||
|---|---|---|---|---|
| 1 d | 3 d | 7 d | 28 d | |
| G2 - 0.17 | 5,018 (110)a | 7,150 (220) | 8,833 (10) | 9,805 (220) |
| G2 - 0.17 - IC | 4,540 (51) | 7,469 (41) | 10,182 (141) | 13,010 (511) |
| G4 - 0.17 | 2,408 (51) | 3,800 (110) | 5,149 (30) | 6,338 (59) |
| G4 - 0.17 - IC | 2,016 (20) | 3,989 (30) | 4,902 (351) | 5,961 (231) |
1 psi = 0.007 MPa
aNumbers in parentheses indicate one standard deviation in psi as determined for three replicate specimens tested at each age.
Besides reducing the autogenous and drying shrinkage, IC can also bring cost benefits because the cost per yielded volume of LWA is less than the cost per yielded volume of grout (solid fraction).[2] The mix designs for the IC grouts are provided in table 3. As shown in the table, these two grouts yield approximately 20 percent more volume when extended with the prewetted lightweight fine aggregate to promote IC. In other words, when extending a grout with LWA to yield 1 yd3 (0.76 m3) of material, the amount of solid grout needed is reduced, thus decreasing the overall material unit cost. Reduction in the cost per (internally cured) grout yielded volume has been estimated at about 20 to 25 percent for the grouts used in this research study. This cost reduction does not consider deployment costs.

