U.S. Department of Transportation
Federal Highway Administration
1200 New Jersey Avenue, SE
Washington, DC 20590
202-366-4000
Federal Highway Administration Research and Technology
Coordinating, Developing, and Delivering Highway Transportation Innovations
 |
| This report is an archived publication and may contain dated technical, contact, and link information |
|
Publication Number: FHWA-RD-97-030
Date: 1989-1994 |
|||||||||||||||||||||||||||||||||||||||||||||||||||||||||||||||||||||||||||||||||||||||||||||||||||||||||||||||||||||||||||||||||||||||||||||||||||||||||||||||||||||||||||||||||
High-Performance ConcretesA State-of-Art Report (1989-1994)4. BEHAVIOR OF HARDENED CONCRETE The behavior of hardened concrete can be characterized in terms of its short-term (essentially instantaneous) and long-term properties. Short-term properties include strength in compression, tension, bond, and modulus of elasticity. The long-term properties include creep, shrinkage, behavior under fatigue, and durability characteristics such as porosity, permeability, freeze-thaw resistance, and abrasion resistance. Comparatively speaking, information on the behavior of very early strength (VES) concrete and high early strength (HES) concrete is somewhat limited, whereas a substantial amount of information on the behavior of high strength concrete exists and additional information is being developed rapidly. Since high performance concretes typically have low water-cementitious materials ratios (W/CM) and high paste contents, their characteristics will, in many cases, be similar to those of high strength concrete. A significant difference in behavior between the early strength and the high strength concretes is in the relationship of compressive strength to other mechanical properties. Typically, strength gain in compression is much faster than strength gain in aggregate-paste bond. This will lead to relative differences in elastic modulus and tensile strength of early strength concretes and high strength concretes, expressed as a function of compressive strength. Thus the relationships of mechanical properties to 28-day compressive strength of high strength concrete cannot be expected necessarily to apply to VES and HES concretes. The strength of concrete depends on a number of factors including the properties and proportions of the constituent materials, degree of hydration, rate of loading, method of testing and specimen geometry. The properties of the constituent materials which affect the strength are the quality of fine and coarse aggregate, the cement paste and the paste-aggregate bond characteristics (properties of the interfacial, or transition, zone). These, in turn, depend on the macro- and microscopic structural features including total porosity, pore size and shape, pore distribution and morphology of the hydration products, plus the bond between individual solid components. Testing conditions including age, rate of loading, method of testing, and specimen geometry significantly influence the measured strength. The strength of saturated specimens can be 15 to 20 percent lower than that of dry specimens. Under impact loading, strength may be as much as 25 to 35 percent higher than under a normal rate of loading, i.e., 10 to 20 microstrains per second (me/sec). Cube specimens generally exhibit 20 to 25 percent higher strengths than cylindrical specimens. Larger specimens exhibit lower average strengths. 4.1.1 Constituent Materials and Mix Proportions Concrete composition limits the ultimate strength that can be obtained and significantly affects the levels of strength attained at early ages. Two dominant constituent materials that are considered to control maximum concrete strength are coarse aggregate and paste characteristics. 4.1.1.1 Coarse Aggregate The important parameters of coarse aggregate are its shape, texture and the maximum size. Since the aggregate is generally stronger than the paste, its strength is not a major factor for normal strength concrete, or for HES and VES concretes. However, the aggregate strength becomes important in the case of higher-strength concrete or lightweight aggregate concrete. Surface texture and mineralogy affect the bond between the aggregates and the paste as well as the stress level at which microcracking begins. The surface texture, therefore, may also affect the modulus of elasticity, the shape of the stress–strain curve and, to a lesser degree, the compressive strength of concrete. Since bond strength increases at a slower rate than compressive strength, these effects will be more pronounced in HES and VES concretes. Tensile strengths may be very sensitive to differences in aggregate surface texture and surface area per unit volume. A. Effect of Aggregate Type The effect of different types of coarse aggregate on concrete strength has been reported in several recent articles. Sarkar and Aitcin [1990] conducted detailed petrological, petrographical and mineralogical characterization of twelve different coarse aggregates that have performed with variable success in very high strength concrete in Canada and the United States. They pointed out that the intrinsic strength of coarse aggregate is not an important factor if water-cement ratio (W/C) falls within the range of 0.50 to 0.70, primarily due to the fact that the cement-aggregate bond or the hydrated cement paste fails long before aggregates do. It is, however, not true for very high strength concretes with very low W/C of 0.20 to 0.30. For such concretes, aggregates can assume the weaker role and fail in the form of transgranular fractures on the failure surface. It was concluded that the minerals must be strong, unaltered, and fine grained in order to be suitable for very high strength concrete. Intra- and intergranular fissures, partially decomposed coarse-grained minerals, and the presence of cleavages and lamination planes tend to weaken the aggregate, and therefore the ultimate strength of the concrete. Aitcin and Mehta [1990] also discussed the importance of evaluating the characteristics of coarse aggregates to be used in very high strength concrete. They tested four different types of coarse aggregates available in California in an identical concrete mixture proportion (W/CM = 0.275) to produce concrete strengths ranging from 85 to 105 MPa (12 to 15 ksi). The results showed that the compressive strength and elastic modulus were significantly influenced by the mineralogical characteristics of the aggregates. Crushed aggregates from fine-grained diabase and limestone gave the best results. Concretes made from a smooth river gravel and from crushed granite that contained inclusions of a soft mineral were found to be relatively weaker in strength. Their study suggested that the choice of coarse aggregate may be made by examining the stress–strain curves and the loading–unloading hysteresis loops for the high strength concrete mixtures made with the coarse aggregates under consideration. Chang and Su [1996] found in a recent study that there existed a good correlation between the compressive strength of coarse aggregate and its soundness (weight loss) obtained by the ASTM C 88 test. They investigated four different types of aggregates with significantly different soundess values. Using the aggregates for the mix proportions of high strength concretes, they also found close correlations between the mean compressive strengths of the aggregates and the compressive strength of the concretes, ranging from 35 to 75 MPa (5,000 to 10,700 psi), at both 7 days and 28 days of age. The mean compressive strength of the aggregate is calculated as
in which Leming [1990] also compared mechanical properties of high strength concrete made with four different types of aggregates (crushed shell-limestone, crushed granite, partially crushed gravel, and diabase) available in North Carolina. The 28-day concrete strength ranged from 51 to 81 MPa (7.35 to 11.57 ksi) with W/CM varying from 0.28 to 0.42. He observed that the mechanical properties varied significantly depending on the source and type of the coarse aggregates. The results also indicated that the W/CM ratio alone is not an effective predictor of strength for high strength concrete made with significantly different aggregates and paste composition. In a study by Lindgard and Smeplass [1993] six aggregate types with different strength and rigidity were tested: dehydrated bauxite, quartzite, quartz-diorite (as reference), gneiss/granite, basalt and limestone. All the aggregates except gneiss/granite were crushed. Fig. 4.1 shows the effect of the aggregate type on compressive strength. The difference between the highest and the lowest strengths is approximately 40%. The authors noted, however, that the bauxite and the basalt aggregates were porous and capable of absorbing significant amounts of mixing water, thus reducing the effective W/CM from 0.30 to 0.24 and 0.27 respectively. If corrections were made for this effect, the compressive strength variation among the five strongest aggregates would be negligible. A similar study [Giaccio et al. 1992] with basalt, granite, and limestone aggregates and a constant W/C of 0.30 plus 2.5% naphthalene-based superplasticizer showed that the three different aggregates produced a compressive strength of 92 MPa (13 ksi), 80 MPa (11.5 ksi), and 62 MPa (8.86 ksi) respectively, using 100 x 200 mm (4 x 8 in.) cylinders. Alexander and Addis [1992] studied the influence of aggregates and interfacial bond on the mechanical properties of high strength concrete, using different aggregates in South Africa. Based on the 28-day compressive (cube) strength, they showed that andesite and dolomite concretes were generally superior, with dolerite, quartzite and granite concretes following in descending order of strength. By using a special testing method in which cement paste was cast against half-cores from the rock core fracture tests, thereby creating an "artificial" paste/rock interface, they measured the interfacial work of fracture values (Rc) for paste/andesite and paste/dolomite interfaces. It was concluded that certain aggregates are more suitable for the production of high strength concrete because they bond better with cement paste as was the case with andesite. B. Effect of Aggregate Size The use of larger maximum size of aggregate affects the strength in several ways. First, since larger aggregates have less specific surface area and the aggregate–paste bond strength is less, the compressive strength of concrete is reduced. Secondly, for a given volume of concrete, using larger aggregate results in a smaller volume of paste, thereby providing more restraint to volume changes of the paste. This may induce additional stresses in the paste, creating microcracks prior to application of load, which may be a critical factor in very high strength (VHS) concretes. Therefore, it is the general consensus that smaller size aggregates should be used to produce higher strength concrete. The effect of the coarse aggregate size on concrete strength was investigated by Cook [1989] who used limestone of two different sizes: 10 mm (3/8 in.) and 25 mm (1 in.). A superplasticizer was used in all the mixes. In general, for a given W/C ratio, the smallest size of the coarse aggregate produced the highest strength; however, it was feasible to produce compressive strengths in excess of 69 MPa (10 ksi) using a 25 mm (1 in.) maximum size aggregate when the mixture was properly proportioned with a high-range water-reducing admixture. In a similar study by de Larrard and Belloc [1992] using crushed limestone aggregates, portland cement, silica fume, and superplasticizer for eight different concrete mixtures, it was shown that better performances and economy could be achieved with 20 to 25 mm (3/4 to 1 in.) maximum size aggregates even though previous researchers had suggested that 10 to 12 mm is the maximum size of aggregates preferable for making high-strength concrete. 4.1.1.2 Paste Characteristics It is generally accepted that the most important parameter affecting concrete strength is the W/CM ratio, sometimes referred to as the W/B (binder) ratio. Even though the strength of concrete is dependent largely on the capillary porosity or gel/space ratio, these are not easy quantities to measure or predict. The capillary porosity of a properly compacted concrete is determined by the W/CM ratio and degree of hydration. Most high performance concrete are produced with a W/CM ratio of 0.40 or less. The practical use of very low W/CM ratio concretes has been made possible by use of both conventional and high-range water reducers, which permit production of workable concrete with very low water contents [Fiorato 1989; Zia et al. 1991; Burg and Ost 1992]. A. Effect of Mineral Admixture Fly ash, slag and silica fume have been used widely as supplementary cementitious materials in high performance concrete. Although fly ash is probably the most common mineral admixture, on a volume basis, silica fume (ultra–fine amorphous silica, derived from the production of silicon or ferrosilica alloys) in particular, used in combination with high-range water reducers, has increased achievable strength levels dramatically [Ezeldin et al. 1989; Baalbaki et al. 1993; Zia et al.1993a, 1993b; Farny and Panarese 1994]. The effect of silica fume on the strength of concrete has been discussed in a comprehensive report [FIP 1988]. The contribution of silica fume to any property of hardened concrete may be expressed in terms of an efficiency factor, K. For compressive strength of concrete, K is in the range of 2 to 5, which means that in a given concrete 1 kg of silica fume may replace 2 to 5 kg of cement without impairing the compressive strength. This applies provided that the water content is kept constant and the silica fume dosage is less than about 20% by weight of cement. Collepardi et al. [1990] studied the effect of combined addition of silica fume and superplasticizer on concrete compressive strength by taking into account such parameters as: (a) type and dosage rate of superplasticizer, (b) type and content of portland cement, and (c) way of silica fume utilization (as additional component or as cement replacement). They concluded that in the presence of silica fume, for both type I and type III portland cement, the melamine sulphonated polymer superplasticizer performs better than the naphthalene sulphonated polymer, particularly when a high dosage such as 4% is used. A change from 2 to 4% superplasticizer dosage rate in general does not modify or reduce compressive strength in the absence of silica fume, whereas significantly increases compressive strength in the present of silica fume. High-reactivity metakaolin (HRM) is a more recently developed supplementary cementitious material. It is a reactive aluminosilicate pozzolan formed by calcining purified kaolinite at a specific temperature change. Chemically, HRM combines with calcium hydroxide to form calcium silicate and calcium aluminate hydrates. It has been shown that HRM in powder form is a quality-enhancing mineral admixture that exhibits enhanced engineering properties comparable to silica fume slurry [Caldarone et al. 1994]. At the present time, the supply of this material is limited and no practical cost data is available. B. Effect of Chemical Admixture The performance of chemical admixtures is influenced by the particular cement and other cementitious materials. Combinations which have been shown to be effective in many cases may not work in all situations, due to adverse cement and admixture interaction. Substantial testing should be conducted with any new combination of cements, and mineral or chemical admixtures prior to large scale use. Baalbaki and Aitcin [1994] conducted a research program to study the compatibility between three air-entraining agents, four water reducers, and one polynaphthalene sulfonate superplasticizer commonly used in Eastern Canada. Tests conducted on twelve differenct combinations of admixtures with a Type I cement showed that the addition of superplasticizer nearly always increased the air content without changing the bubble spacing. The only exception was when the air content of the concrete was lower than 4.5 percent 70 minutes after batching. In that case, the total air content decreased after the introduction of the superplasticizer and the spacing factor increased significantly. The tests were duplicated with another Type I cement and the results were not significantly different from the first set of test results. 4.1.2 Strength Development and Curing Temperature The strength development with time is a function of the constituent materials and curing techniques. An adequate amount of moisture is necessary to ensure that hydration is sufficient to reduce the porosity to a level necessary to attain the desired strength. Although cement paste in practice will never completely hydrate, the aim of curing is to ensure sufficient hydration. In pastes with lower W/CM ratios, self-desiccation can occur during hydration and thus prevent further hydration unless water is supplied externally. Many investigations have measured strength development (mostly compressive strength) with respect to time. In the previous state-of-the-art report [Zia et al. 1991], an in-depth discussion of the effects of silica fume, cement types, curing conditions (wet and dry), and curing temperatures on the strength development was presented. In general, a higher rate of strength gain is observed for higher strength concrete at early ages. At later ages the difference is not significant. A recent study [Zia et al. 1993] on VES, HES, and VHS concretes reported the similar trend as shown in Fig. 4.2. It should be noted that insulation was used to trap the heat of hydration to accelerate the early strength development of the VES concretes. Since the VES concretes were kept moist for only the first 6 or 4 hours, to be followed by air curing in the laboratory, the strength development was very rapid during the first three days, and the subsequent rate of strength gain was greatly reduced. For the HES concretes, a large amount of Type III cement was used along with a fast-acting accelerator and a relatively low W/C ratio, thus the strength development of the concrete was much more rapid in the first 15 days, and then the rate of strength gain was greatly reduced. For the VHS concretes, a large amount of Type I cement plus fly ash or silica fume was used along with a relatively low W/CM ratio, so the strength development was more rapid in the first 7 days and the subsequent rate of strength gain was greatly reduced. These early strength gains are in substantial contrast to the prediction by the current ACI Committee 209 recommendation [1993] for conventional concrete. A study by Aitcin et al. [1994] examined the effect of curing on measured compressive strength for different strength concretes. Cylinders of 100, 150, and 200 mm (4, 6, and 8 in.) diameter were cast from batches of ready-mixed concrete with target strengths of 35, 90, and 120 MPa (5, 13, and 17.5 ksi). The cylinders were air-cured, sealed, or water-cured up to one year. The beneficial effects of preventing moisture loss and water-curing were clearly observed from the test results. The increased apparent strengths with decreasing cylinder size were also noted. Based on the test results, the following equation was developed which is a modified form of the equation recommended by ACI Committee 209 [1993]: in which is the concrete compressive strength at an age of t days, A is the concrete compressive strength at an age of infinity, and B is a coefficient (in days) that determines the shape of the strength gain curve. The values of A and B are given in Table 4.1. Oluokun et al. [1990] reviewed the maturity concept with respect to the prediction of early-age concrete strength and pointed out that the linear relationship between the strength development and maturity is inaccurate for concrete at very early age or at much later age. By conducting an experimental program involving three different concrete mixes and measuring the compressive strengths at ages of 6 and 12 hr, and 1, 2, 3, 7, and 28 days, they developed an exponential relationship between the early-age strength and maturity of concrete as follows:
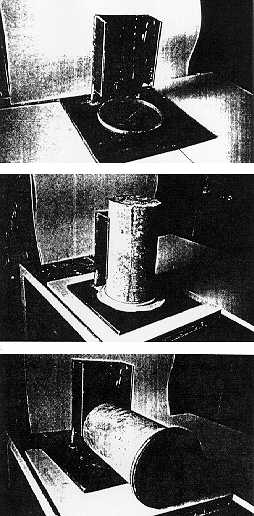
Using pulse velocity method, Ravindrarajah [1992] investigated the development of compressive strength of high-strength concrete from the age of 5 hours with respect to curing conditions and types of cementitious material. Normal portland cement, blast-furnace slag cement and silica fume were used either individually or in combination. Test results indicated that silica fume in concrete increased the pulse velocity; both pulse velocity and strength were lower for air-cured concrete than for water-cured concrete; and the relationship between strength and pulse velocity could be expressed as an exponential curve which was less influence by curing or cementitious material type. Evaluation of in-situ concrete strength based on paste efficiency concept was examined. Kawakami et al. [1989] reported a study on the rapid estimation of the 28-day compressive strength of concrete by 30-minutes curing of the wet-screened mortar in boiling water. It was demonstrated that the simple and rapid method is a possible way for estimating the 28-day compressive strength of concrete before the concrete is placed. Several studies [Russell and Larson 1989; Aitcin and Laplante 1990; Bickley et al. 1991] have reported the long-term compressive strength of high strength concretes containing silica fume. Structures constructed of the concrete were monitored under the field conditions and cores were taken from the structures for testing one year to six years after the structures were constructed. These studies dispelled the suspicion of possible strength regression of some silica fume concretes. The development of pavement concrete compressive strength, flexural strength, and splitting tensile strength as a function of time was reported by Lange [1994]. Significant strength gains beyond the 28-day strength were found. It is true for high- and normal-strength concretes, concretes with and without fly ash, and concretes cured in air and moist conditions. Although modern concretes have higher early compressive strength gains than concretes produced in 1940-56, both categories of concrete exhibit similar long-term trends in strength development when normalized to their 28-day strengths. Concrete properties such as elastic modulus, tensile or flexural strength, shear strength, stress–strain relationships and bond strength are usually expressed in terms of uniaxial compressive strength of 150 x 300 mm (6 x 12 in.) cylinders, moist cured to 28 days. Compressive strength is the common basis for design for most structures, other than pavements, and even then is the common method of routine quality testing. The terms "strength" and "compressive strength" are used virtually interchangeably. The discussion above in sections 4.1.1 and 4.1.2 generally applies equally well to all measures of strength, although most results and conclusions were based either primarily or exclusively on compressive strength results. Maximum, practically achievable, compressive strengths have increased steadily over the years. Presently, 28-day strengths of up to 84 MPa (12 ksi) are routinely obtainable. However, it has been reported [CEB-FIP 1994] that concrete with a 90-day cylinder strength of 131 MPa (19 ksi) has been used in buildings in the U.S., 143 MPa 20.5 ksi) cube strength for precast prestressed beams in Sweden, 131 MPa (19 ksi) cube strength for a slab on ground in Sweden, 110 MPa (15.7 ksi) cube strength for an overlay on bridge in Norway, 95 MPa (13.6 ksi) cube strength for highway pavement in Norway, and 100 MPa (14.3 ksi) for a pedestrain bridge in Japan. The trend for the future as identified by the ACI Committee 363 is to develop concrete with compressive strength in excess of 138 MPa (20 ksi) and identify its appropriate applications. Testing variables have a considerable influence on the measured compressive strength. The major testing variables are: mold type, specimen size, end conditions, and rate of loading. The sensitivity of measured compressive strength to testing variables varies with level of compressive strength. Since the compressive strength of VES and HES concretes are at conventional levels, conventional testing procedures can be used for the most part, although curing during the first several hours can affect test results dramatically. Testing of VHS concretes is much more demanding. However, in all concretes, competent testing is critical especially for high performance concrete. 4.1.3.1 Effect of Testing Variables An extensive study to investigate the effects of testing variables on the measured strength of high-strength concrete cylinders was conducted by Carino et al. [1994]. The variables included: end preparation (sulfur capping versus grinding), cylinder size (100 versus 150 mm diameter), type of testing machine (1.33-MN capacity versus 4.45-MN capacity), and nominal stress rate (0.14 versus 0.34 MPa/s). Two levels of strength (45 and 90 MPa) were used, and three replicates were tested for each run. Specific gravities were measured to check on the consistency of cylinder fabrication. Statistical analyses indicated that all the factors had significant effects on the measured compressive strength. On average, the 100 mm cylinders resulted in about 1.3% greater strength, the faster stress rate produced about 2.6% greater strength, the ground cylinders were 2.1% stronger, and the 1.33-MN testing machine produced about 2.3% greater strength. There were significant interactions among the factors, so that the effects were greater than the average values for particular factor setting. For example, the effect of end preparation depended on the strength level. For 45-MPa concrete, there was no strength difference due to the method of end preparation, but for the 90-MPa concrete, grinding resulted in as much as 6% greater strength in certain cases. Analysis of dispersion indicated that the 100-mm cylinders had higher within-tests variability, but the differences were not statistically significant. Based on the results of this study, recommendations were made for modifications to testing standards with respect to the loading rate, the capping method, the test cylinder size, and the required time for removal of molds. As a part of the Japanese 5-year R & D project on "the development of engineering technique for the construction of ultra-light and ultra-high-strength reinforced concrete buildings", Tanigawa et al. [1990] also conducted a study on testing method for compressive strength of high-strength concrete. Testing variables included three different concrete strengths: 58.8 MPa (8.5 ksi), 83.4 MPa (12.1 ksi), 107.9 MPa (15.6 ksi) at 28 days; eight end surface treatments (including ground surface); three different rigidities of testing machine (20 and 28 tf/mm) with a tilting platen (free versus fixed); four loading speeds (2~3 kgf/cm2/s, 1~1.5 kgf/cm2/s, 0.5~0.75 kgf/cm2/s, and 30~40 me/s); and two cylinder sizes (100 and 150 mm diameters). The test results indicated that the different treatments of the loading surface did not affect the compressive strength except for the case with friction reducing pad where a strength reduction of 9% was observed. The compressive strength also tended to decrease as the flatness of the end surface decreased. No significant effect on the measured compressive strength was observed with the difference in the rigidity of the testing machine. The effect on the compressive strength was also negligible if the loading platen was free to tilt throughout the test or allowed to tilt initially but fixed when the load was at 44 kips (20 tf). On the other hand, the compressive strength is greatly reduced if the loading platen was fixed at the initial loading. The effect of loading speed on the compressive strength was greater than that of normal strength concrete. Under the slowest load speed, the strength decreased by about 6 to 9%. The effect of the specimen size was the same as that of normal strength concrete. On average, cylinders of 100 x 200 mm showed about 3% higher strength than cylinders of 150 x 300 mm. 4.1.3.2 Effect of Mold Type The effect of mold type on strength was reported by Carrasquillo et al. [1988a] that use of 150 x 300 mm (6 x 12 in.) plastic molds gave strengths slightly lower than steel molds and use of 100 x 200 mm (4 x 8 in.) plastic molds gave negligible difference with steel molds. A recent report by French and Mokhtarzadeh [1993] also indicated that the compressive strength of cyliners cast in 150 x 300 mm (6 x 12 in.) heavygauge reusable steel molds was 2.5% higher than that of cylinders cast in flexible single-use plastic molds. It appeared that as long as the manual rodding method was used to consolidate the concrete, the effect of mold type on the compressive strength of concrete was insignificant. Carrasquillo et al. recommended that steel molds should be used for concrete with compressive strengths up to 103 MPa (15 ksi). For higher strength concrete, it seems logical that steel molds should also be used. 4.1.3.3 Effect of Specimen Size Many studies [Tanigawa et al. 1990; Baalbaki et al. 1992; French et al. 1993; Leming 1993; Aitcin et al. 1994; Carino et al. 1994] have been conducted to investigate the specimen size effect on the compressive strength. Comparisons were usually made between the compressive strength of 100 x 200 mm (4 x 8 in.) cylinders and that of 150 x 300 mm (6 x 12 in.) cylinders. Generally, 100 x 200 mm (4 x 8 in.) cylinders exhibit higher strengths than 150 x 300 mm (6 x 12 in.) cylinders. The difference may vary from 2 to 10% with a common value being 5%, and the difference is lower for higher strength concrete. Burg and Ost [1992] reported, however, that their test data showed that the strength of 100 x 200 mm (4 x 8 in.) cylinders was within 1% of the strength of 150 x 300 mm (6 x 12 in.) cylinders. A contradition to this trend is the study reported by Carrasquillo et al. [1988a] which showed that the compressive strength of 100 x 200 mm (4 x 8 in.) cylinders were approximately 7% lower than 150 x 300 mm (6 x 12 in.) cylinders. 4.1.3.4 Strength of Concrete Core The relationship between the compressive strength of 150 x 300 mm (6 x 12 in.) cylinders and cores from a column was studied by Cook [1989] for concrete with a strength of 69 MPa (10 ksi). It was concluded that the 85% criterion specified in the ACI Building Code (ACI 318-89) [1989] would be applicable to high strength concrete. The study also confirmed that job cured specimens did not provide accurate measurements of the in–place strength. The reason for lower core strength in the middle portion of the columns was attributed to temperature rise, i.e, 100oF (38oC) for high strength mixtures. In another study, Akers and Miller [1990] evaluated the relationship between 150 x 300 mm (6 x 12 in.) cylinders, 100 x 200 mm (4 x 8 in.) cylinders and drilled cores. The results showed that the strengths obtained from drilled cores were greatly influenced by three factors: their tested orientation relative to that in the structure; the elevation of the core in the structure; and the type of pre-test conditioning. A comparison of the core and cylinder compressive strengths indicated that the acceptance criteria of the ACI Building Code may have limited applicability at the higher strength levels. It was suggested that prior to core testing high strength concrete, the testing conditioning and acceptance criteria should be agreed upon in advance and be rigorously followed. Aitcin et al. [1990] also tested the strength of 100 mm (4 in.) cores taken from a mock column at two and four years after casting and found that it was nearly identical to that of cube specimens cured for 28 days in lime–saturated water at room temperature. The strength of the concrete tested was 85 MPa (12.3 ksi). In an evaluation of engineering properties of six commercially available high-strength concrete mixes in the range of 69 to 138 MPa (10 to 20 ksi), Burg and Ost [1992] reported that the core strength tested at 91 days and 14 months was slightly lower than the strength of corresponding insulated cylinders and all but one concrete mix exceeded 85% of the specified design strength fc' of the concrete. They further reported that no significant strength difference was found between cores taken from near the surface and the center of large-sized cubes. This is in contrast to the findings of Cook [1989]. Recently, the compressive strength of concrete cores was extensively studied by Bartlett and MacGregor [1994a, 1994b, 1994c, 1994d]. By examining and statistically analyzing hundreds of core test data, they found that the core strengths were greatly affected by the variations of four critical factors: (1) the core size, 50 or 100 mm (2 or 4 in.) diameter; (2) the length-to-diameter ratio of the core (l/d); (3) the moisture condition (moisture content and moisture gradient) of the core; and (4) the damage sustained during drilling of the core. 4.1.3.5 Effect of End Condition The preparation of the end conditions (cappings) of the concrete cylinder can significantly affect the measured compressive strength. Generally speaking, the standard sulfur mortar capping is suitable for concrete strength up to about 52 MPa (7.5 ksi). For higher strength concrete, different procedures are used to prepare the end conditions of cylinders for compressive testing. One procedure is the parallel grinding of the ends of the cylinder, thereby eliminating the need for end caps. While grinding is regarded as the best procedure, it entails expensive equipment and longer preparation time so that it is not practical for field applications. Another procedure is the use of an unbonded cap consisting of a restraining cap and an elastomeric pad as insert. The unbonded cap system is far more cost-effective and can be easily equipped by any laboratory and used in the field. A previous study [Carasquillo et al. 1988b] showed that for concrete strengths between 28 and 69 MPa (4 and 10 ksi), the use of polyurethane inserts with aluminum restraining caps produced average test results within 5% of those obtained using sulfur mortar caps. For concrete strengths below 76 MPa (11 ksi), the use of neoprene inserts with steel restraining caps yielded average test results within 3% of those obtained using sulfur mortar caps. For higher strength concrete, the use of either unbonded capping system became questionable. More recently, Pistilli and Willems [1993] compared sulfur caps with unbonded polymer pads in compressive strength testing of concrete within the strength range of 20.7 to 124.2 MPa (3 to 18 ksi) and compared sulfur caps with ground and lapped surfaces within the range of 89.7 to 138 MPa (13 to 20 ksi). Similar tests were conducted by Ipatti [1993] comparing untreated mold surface, sulfur capping, and ground surface for cube specimens, and sawn surface, sulfur capping, and ground surface for cylindrical specimens. Sawing of the cylindrical specimens was accomplished with a water cooled cutting machine with a diamond saw blade of 625 mm diameter, capable of cutting cylinders up to 250 mm in diameter. The capping compound consisted of sulfur, quartz filler, and chalk powder in 1.25 : 0.25 : 0.75 ratio. The compressive strength of the sulfur compound, based on 40 mm cube, was 44 MPa (6.38 ksi). Four grades of concrete were used in the tests including 60, 80, 90, 110 MPa (8.7, 11.6, 13.1, 16 ksi). The test results indicated that for the cylindrical secimens, the highest average strengths were obtained with ground or sulfur capped surfaces. The coefficient of variation averaged 1% for ground surfaces, 1.5% for sulfur capped surfaces and 7.9% for sawn surfaces. For the cube specimens, the highest average strength were obtained with ground surfaces, the second highest with untreated mold surfaces, and the lowest with sulfur capped surfaces. The corresponding coefficients of variation were 0.8%, 1.9%, and 1.3% respectively. A new technique for the unbonded cap system has been developed recently in France [Boulay et al. 1992; Boulay and de Larrard 1993] in which the neoprene insert is replaced by dry sand (the sand box). The strength of the confined sand seems to have no limit and when used as the capping system, the results it produces are comparable to those obtained with grinding for concrete strength between 50 to 80 MPa (7.25 to 11.6 ksi). Lessard et al. [1993] has found a high strength capping compound (testing 60 to 70 MPa using 50-mm cubes) to be effective when used for testing high strength concrete up to 120 MPa due to the confinement of the capping compound between the platen of the test machine and the speciment, but the capping layer has to be less than 3 mm thick. Under such conditions, the results are similar to those obtained when the cylinder ends are faced by grinding. Another recent method developed by Johnson and Mirza [1993] is to provide a confining ring to the standard sulfur mortar capping. The method employs standard concrete laboratory equipment and an inexpensive customized capping apparatus for preparing the cylinder ends, see Figs. 4.3 and 4.4. The technique ensures that confinement is provided to the cap without having to place tight controls on cylinder end roughness prior to capping and on the cap thickness itself. Using a capping compound with the manufacturer's specified ultimate compressive strength of 35 MPa after 5 minutes and 55 MPa after 48 hours (based on 50-mm cubes), they tested cylinders (one hour after capping) with compressive strength of over 100 MPa. The results compared closely to those with ground ends, see Fig. 4.5. 4.1.3.6 Effect of Loading Rate It is generally understood that the measured compressive strength of concrete increases with increasing rate of loading. Many studies of the subject have been conducted over the past seven decades, covering a wide range of strength of concrete (17.4 to 60.4 MPa), strain rate (10-6/s to 10/s), specimen size and shape (cylinder, cube, and prism), curing and testing conditions (wet and dry), and loading mechanism (electrohydraulic servosystem, pressure-activated piston system, ballistic pendulum and drop hammer apparatus). An excellent review of the literature has been prepared by Fu et al. [1991] and their general conclusions are as follows:
The review by Fu et al. also presented four different dynamic constitutive models to represent a complete stress–strain curve for plain and reinforced concrete under compression. It should be noted that the proposed models have been based on axial compression and the effect of strain gradient has not been accounted for. Scott et al. [1982] had pointed out that strain gradient due to eccentric compression may lead to an increase in the strain at failure and a decrease in strength. Virtually no information is available on the effect of loading rate for concrete with strengths in excess of 69 MPa (10 ksi). 4.1.3.7 Effect of Temperature The strength properties of concrete are not affected by normal changes of temperature. Under extreme temperature conditions, however, the behavior of concrete may be substantially different. Castillo and Durrani [1990] reported a study on the effect of transient high temperature on the strength and load-deformation behavior of high-strength concrete. The concrete strength ranged from 31.1 to 89 MPa (4.5 to 12.9 ksi) and the temperature exposure was in the range of 23 to 800 C (73 to 1,472 F). Before exposure to elevated temperature, the test specimens were preloaded to simulate the presence of loads in real structures. It was observed that the compressive strength of high-strength concrete decreased by 15 to 20% when exposed to temperatures in the range of 100 to 300 C (212 to 572 F) With temperatures in the range of 300 to 800 C (752 to 1,472 F), the compressive strengh of concrete decreased to about 30% of its strength at room temperature. The effect of exposure to low temperature on the mechanical properties of high-strength concrete containing silica fume and fly ash was reported by Marzouk and Hussein [1990]. Test cylinders were exposed to cold ocean water with temperature varying from -10 to 20 C (14 to 68 F) after the cylinders being cured for only 24 hours. For the specimens exposed to cold ocean water, the strength at 28 and 91 days was only 40 and 54% respectively of the 3-day strength at room temperature. However, for the specimens exposed to temperatures of -10 C, the strength at 28 and 91 days was 97 and 91% respectively of the 3-day strength at room temperature. The low rate of maturity was attributed to slow hydration process due to low temperature, which caused the rate of evolution of calcium hydroxide to decrease and the secondary pozzolanic reaction to stop. Lee et al. [1989] also conducted studies of the basic mechanical properties of concrete under low temperature in the range of -70 to 20 C (-94 to 68 F). Their results indicated that the compressive strength increased as the temperature decreased and the rate of increase for high-strength concrete at different low temperatures was generally lower than that for normal strength concrete. The tensile strength governs the cracking behavior and affects other properties such as stiffness, damping action, bond to embedded steel, and durability of concrete. It is also of importance with regard to the behavior of concrete under shear loads. The tensile strength is determined either by direct tensile tests or by indirect tensile tests such as flexural or split cylinder tests. 4.1.4.1 Direct Tensile Strength The direct tensile strength is difficult to obtain. Due to the difficulty in testing, only limited and often conflicting data is available. It is often assumed that direct tensile strength of concrete is about 10% of its compressive strength. An account of several earlier studies using different specimen sizes and geometries, examining the effects of curing, loading rate, sustained and cyclic loadings as well as impact, has been given in the previous report [Zia et al. 1991]. It was concluded that the uniaxial tensile strength of concrete can be estimated by the expression 6.5fc' and that data were not available for higher strength concrete with fc' greater than 55 MPa (8 ksi). Among more recent studies on tensile strength of high strength concrete, very few involved direct tensile testing. One such study was reported by Marzouk and Jiang [1994] regarding the effects of freezing and thawing on the tension properties of high-strength concrete. Flat direct tension speciments of 20 x 75 x 300 mm (0.8 x 3 x 12 in.), with sawed notches (11 mm in depth and 3 mm in width) on both edges, were attached to a pair of special wedge-type frictional grips and subjected to direct tension test in a closed-loop servo-hydraulic universal test machine. An electromechanical extensometer (gage length of 25 mm) was used to control the loading. The concrete contained both silica fume and fly ash with W/CM of 0.3 and was cured in water for 28 days. The 28-day compressive strength of the concrete was 74.4 MPa (10.8 ksi). Each freezing and thawing cycle consisted of alternately lowering the temperature of the specimen from 18.3 to -17.8 C and raisingit from -17.8 to 18.3 C in 3.4 hr. The direct tensile strength was found to be 4.2 and 3.4 percent of the compressive strength before freezing-thawing cycling and after 700 cycles, respectively. The average value of cracking stain was found to be 115 me before cycling and 65 me after 700 cycles of freezing and thawing. A set of typical tensile stress–strain curves is shown in Fig. 4.6. 4.1.4.2 Indirect Tensile Strength The most commonly used tests for estimating the indirect tensile strength of concrete are the splitting tension test (ASTM C 496) and the third-point flexural loading test (ASTM C 78). Both the splitting tensile strength (fct) and the flexural strength or modulus of rupture (fr) are related to the compressive strength by the following general expression:
ACI Committee 363 [1993] recommended that for concrete strength up to 83 MPa (12 ksi), the coefficient should be taken as 7.4 for and as 11.7 for . Other investigators have proposed slightly different values for , or suggested variations to Eq. (4.4). More details can be found in the previous report [Zia et al. 1991]. The results of the recent SHRP studies [Zia et al. 1993] indicated that for the splitting tensile strength the recommendation of ACI Committee 318 is equally acceptable as that of ACI Committee 363. However, for the flexural strength (modulus of rupture), the recommendation of ACI 318 is a better representation than that of ACI Committee 363. See Figs. 4.7 and 4.8. In a two-year study to obtain "optimum" high performance concrete based on cement dosage, dosage of superplasticizer, addition of silica fume, and selection of size and shape of aggregates, Charif et al. [1990] found that the tensile strength could be increased by 40 to 60% over the normal strength concrete. Regarding the effect of freezing and thawing, Marzouk and Jiang [1994] reported that after 700 cycles, the modulus of rupture of high strength concrete was reduced by 15% whereas the reduction was 60% for normal strength concrete. The study by Burg and Ost [1992] showed that the average modulus of rupture and splitting tensile strength in comparison with the compressive strength were similar to the recommendation of ACI Committee 363. The moist cured specimens consistently produced higher strength than air cured specimens. See Figs. 4.9 and 4.10. Two types of bond strength are of interest in pavement and bridge deck applications: bond strength of concrete to concrete and bond strength of concrete to reinforcing steel. 4.1.5.1 Concrete-Concrete Bond New concrete is placed against existing concrete in many circumstances. Often an attempt is made to bond the two concretes together. The stress states that develop at the bonding surface will vary considerably depending on the type and the use of the structure. For example, the bond on a bridge deck overlay may be subject to shear stress in conjunction with tensile or compressive stresses induced by shrinkage or thermal effects, in addition to compression and shear from service loads. Bonding agents are often used with the intention of producing a bond that is as strong as the components being joined. A wide variety of bonding agents have been used in practice, including epoxy resin, acrylic latex, styrene butadiene rubber (SBR) latex, copolymer polyvinyl acetate (PVA), and portland cement mortar. The latter two are used widely as inexpensive general purpose agents for bonding concretes. No single method of test can replicate all in-service state of stresses in bond. Several earlier research studies describing test methods and evaluating bonding materials were summarized previously [Zia et al. 1991]. Generally, there are three different methods to measure the interfacial bond strength between two concrete surfaces being joined [Hindo 1990]. They include split shear (slant shear) test, direct shear test, and direct tensile test as shown in Fig. 4.11. In the slant shear test, the bonding plane is inclined at 30 degrees from the longitudinal or loading axis and it is subjected to normal compression and in-plane shear. The test specimen may be in the form of a cylinder or a rectangular prism. If failure occurs by shearing of the bonding plane, the bond strength is then determined by dividing the maximum load by the area of the shearing plane. For the direct shear test, there are three altenatives — push-off test using a specimen of two L-shaped parts, double direct shear test, and double notched shear test as illustrated in Fig. 4.12 [Horiguchi et al. 1988]. In all these three cases, the bond strength is determined by dividing the maximum shear load by the area of the shear plane. In the direct tensile test, the bond strength of the joint is actually measured by the tensile strength of the test specimen. The direct tensile test has been adapted to field application where a partially cored specimen is pulled in-place through a steel plate epoxied to the top of the core [Hindo 1990; Petersen et al. 1993]. In the SHRP study on VES and HES concretes, Zia et al. [1993c, 1993d] used push-off tests to assess the bond strength between VES(A), VES(B), HES and the standard North Carolina Department of Transportation (NCDOT) pavement concrete. They found that the VES(A) concrete with crushed granite developed a nominal bond strength at 6 hours ranging from 0.83 MPa (120 psi) to 1.03 MPa (150 psi). The VES(B) concrete with crushed granite developed a 4-hour nominal bond strength of 1.55 MPa (225 psi). These values were much lower than the corresponding value of 2.28 MPa (330 psi) obtained from the control specimen tested at 7 days using the standard NCDOT pavement concrete. The differences reflect primarily the effect of test age. For the HES concretes tested at 24 hours, the nominal bond strength was 1.9 MPa (275 psi) with crushed granite as aggregate and was 2.4 MPa (350 psi) with marine marl as aggregate. These values compared well with the bond strength of 2.3 MPa (330 psi) of the control specimen tested a 7 days. Kudlapur and Nawy [1990] also used push-off tests to evaluate the early-age bond strength between high-strength regular portland cement concrete and cold weather high-strength concretes for the rehabilitation of bridge decks. One half of the push-off specimen was made of a regular high-strength concrete which, after 28 days of moist curing, produced compressive strengths of 83 MPa (12 ksi) to 100 MPa (14.5 ksi). This part of the test specimen was cured for 30 days before the other half of the push-off specimen was cast with magnesium phosphate concrete or methylmethacrylate (MMA) polymer concrete in the cold room at a temperature of 15o to 20o F (-9.4o to -6.7o C). The push-off tests were conducted at 1, 3, and 7 days after the cold weather concrete was cast. The test results indicated that the magnesium phosphate concrete developed a bond strength of 1.71 MPa (248 psi) in one day and increased to 1.92 MPa (278 psi) in 7 days. For the MMA polymer concrete, the bond strength was 6.14 MPa (890 psi) in one day and increased significantly to 7 MPa (1,015 psi) in 7 days. Using slant shear tests, Wakeley et at. [1991] evaluated the bonding characteristics of three commercially available rapid-setting materials as spall-repair concretes for rapid runway repair. The three materials were a methyl methacrylate binder (Silikal R17AF), a magnesium phosphate mortar mix (Set-45), and a high-performance blended cement mortar mix (Pyrament 505). Each was extended 50 percent by mass with coarse aggregate for the tests. The specimens used for the slant shear tests were 100 x 200 mm (4 x 8 in.) cylinders rather than the 75 x 150 mm (3 x 6 in.) cylinders as specified in the ASTM C 882-87 test method. The bond strength was calculated by dividing the load carried by the specimen at failure by the area of the bonding surface which was 162 cm2 (25.13 in.2). The substrate concrete had a 28-day compressive strength of 41 MPa (5.9 ksi) and the bonding area was sandblasted lightly before the repair concrete was cast. The tests were conducted 24 hours after the repair concrete was cast and at two temperature levels — a warm temperature of 22.8oC (73oF) for all three materials and a cold temperature of -15oC (5oF) for Silikal, -9.4oC (15oF) for Pyrament, and 7.2oC (45oF) for Set-45. The three different cold temperatures were used because of the difference in strength gain of the three materials. Furthermore, both dry and wet aggregates were used for the tests at warm temperature. The test results are summarized in Table 4.2. 4.1.5.2 Steel-Concrete Bond Methods recommended by the current ACI Building Code (ACI 318 – 89) for estimating the development length and anchorage of tensile steel are based on bond tests generally using concrete with compressive strength not greater than about 28 MPa (4,000 psi). It is uncertain that these empirical equations for estimating the steel–concrete bond are applicable for higher strength concrete, and research on bond strength characteristics of higher strength concrete has been identified as one of the research needs by the ACI Committee 363 [1987]. Pull-out test is commonly used for the evaluation of bond strength between steel and concrete. However, this test does not represent the stress conditions which exist in the concrete around the reinforcement in a flexural member. To overcome this shortcoming, a flexural test is often used in which both the steel and the concrete are in tension. Several earlier researches [Zia et al. 1991] showed that higher rate of loading would cause more rapid deterioration of anchorage bond and that the bond characteristics of deformed bars were affected significantly by the age of concrete. It was also concluded that the use of superplasticizer did not seem to affect the bond strength and the increased addition of silica fume up to 16% showed an improved effect on the pull-out strength, especially in the high compresssive strength range of concrete, because it "densifies" the interfacial zone between the steel and the surrounding concrete [Gjorv et al. 1990]. Since 1990, several studies have been conducted to investigate specifically the bond strength of reinforcement in high strength concrete. de Larrard et al. [1993] evaluated the bond strengh between high strength concrete and reinforcing bars using the RILEM beam test. A high strength concrete with 28-day compressive strength of 95 MPa (13.6 ksi) was used along with a normal strength concrete of 42 MPa (6 ksi) as control. Three different sizes of deformed bars (10, 16, 25 mm) and one smooth bar (25 mm) were used. Based on several preliminary tests, the RILEM recommended bond (anchorage) length of 10 times bar diameter had to be reduced to 3 times to 2.5 times bar diameter for high strength concrete to ensure bond failure rather than yielding of reinforcement. Transverse reinforcement was used in the test specimens so the lateral confinement of concrete was provided. The average bond strength along the bond length was calculated corresponding to the free end slip of the bar at 10 and 100 mm. The test results are shown in Table 4.3. It was concluded that the effect of bar size on bond strength was very significant as one would expect. The increase in bond strength with high strength concrete (as compared to normal strength concrete) was approximately 80% for 10 mm deformed bars and 30% for 25 mm deformed bars. The improvement of bond is attributed to the increase in concrete tensile strength and confinement due to both concrete shrinkage and transverse reinforcement. Azizinamini et al. [1993] and Azizinamini [1992] reported a study on tension splice of #11 and #8 bars embedded in high strength concrete. Nominal concrete strength varied from 45 MPa (5 ksi) to 105 MPa (15 ksi). Different splice lengths were used for two-bar and three-bar specimens. The concrete cover was equal to one bar diameter. The tension splice was tested in the constant moment region. The test results indicated that the nomalized bond strength utest/Öfc' decreased as concrete strength increased and that the rate of decrease increased as splice length increased. With constant concrete strength, the nomalized bond strength also decreased with increasing splice length. Furthermore, top-cast bars in normal strength concrete showed approximately 8% reduction in bond capacity compared to bottom-cast bars, whereas top-cast bars in high strength concrete showed slightly higher bond capacity in comparison with bottom-cast bars. It was concluded that over the splice region the bond stress distribution at the ultimate stage might not be uniform for high strength concrete and the nonuniform bond stress distribution could be more pronounced for increased splice length or decreased concrete cover. With high strength concrete and small concrete cover, it is not an efficient approach to increase bond capacity by increasing the splice length. Instead, the use of some minimum amount of transverse reinforcement over the spliced region would be a better approach to prevent splitting of concrete cover so as to increase the bond capacity and to provide for more ductility. Kaku et al. [1992] tested 26 simply supported beams to investigate bond splitting strength of tensile reinforcement in a shear span. Test variables included concrete strength (40, 60, 80, 100 MPa), development length and spacing of reinforcement, amount and detail of transverse reinforcement, and two cross sections of test specimens. The test results indicated that (1) the bond splitting strength is proportional to Öfc' or, more conservatively, (fc')0.6, (2) the use of transverse reinforcement with supplementary ties significantly increases the bond splitting strength, (3) without transverse reinforcement, bond strength decreases with increase in development length, and (4) bond strength ratio of top bars to bottom bars increases to unity with increase of concrete strength. Based on the test results, a bond strength equation was developed which acounts for the concrete strength, the development length and spacing of reinforcement, and the amount and detail of transverse reinforcedment. The proposed equation is slightly more conservative than the recommendation of the Architectural Institute of Japan. Using pull-out tests of 62 specimens, Teng and Ye [1992] investigated the bond-slip behavior of deformed bars in high strength concrete. Compressive strength of concrete varied from 60 MPa to 100 MPa based on 150 x150 mm cubes. Bar diameter, embedment length, and confining reinforcement were other variables considered. The test results indicated that with increasing concrete strength, both the bond strength and the stiffness of the bond-slip relationship increased. For high strength concrete, the splitting failure of specimens without spirals was more brittle. For a given embedment length, the bond strength was proportional to the tensile splitting strength of concrete and to square roots of relative concrete cover. With increasing embedment length, the bond strength decreased. In a recent statistical analyses of 133 splice and development specimens with no transverse reinforcement and 166 specimens with transverse reinforcement to develop design criteria for development length of conventional and high relative rib area reinforceing bars (with fc' varying from 2,500 to 16,000 psi or 17 to 110 MPa), Darwin et al. [1996] found that the effect of concrete strength on bond strength was more accurately represented by (fc')1/4 than (fc')1/2 for the full range of concrete strength. Steel-concrete bond in high-strength lightweight aggregate (LWA) concrete was reported by Mor [1992] based on pull-out tests. By varying silica fume contents (0 and 13 to 15%) and W/CM (0.25 to 0.34), four different concrete mixes were produced with similar high strength of 69 MPa (10 ksi). The use of silica fume doubled the ratio of bond strength to compressive strength at 0.25 mm (0.01 in.) slip for LWA concrete, while having no significant effect on normal weight aggregate (NWA) concrete. Silica fume reduced porosity and thickness of the transition zone adjacent to the steel, thus improving the adhesion-type bond at small slip levels. The lower Ec of LWA concrete, combined with its compatible aggregate and cement paste matrix, results in better utilization of the bond adhesion, allowing larger stress and strain levels. The bond characteristics along a high-strength beam reinforcement within an interior beam-column joint panel under monotonic loading was studied by Kitayama et al. [1991]. They found that the bond strength reached the maximum value for the joint constructed with high-strength concrete and steel until a diagonal shear crack occurred across the beam reinforcement. On the contrary, with lower strength concrete and steel, the bond deterioration of the joint panel was caused by yielding of the beam reinforcement. A study of anchorage of beam reinforcement within a typical high-strength concrete interior beam-column joint under load reversals was conducted by Lee et al. [1991]. Based on their results, it was concluded that the design criterion of bond performance recommended by the Architectural Institute of Japan (AIJ) can not be applied to the high-strength reinforced concrete. The bond characteristics of prestressing strands in both normal strength and high strength concretes is an important issue relative to prestressed concrete design. Mitchell et al. [1993] investigated the influence of high-strength concrete on the transfer and development lengths of pretensioning strands, using concrete strengths varying from 31 to 89 MPa (4.5 to 12.9 ksi) and three different strand diameters of 3/8, 1/2 and 0.62 in. (9.5, 12.7 and 15.7 mm). Expressions for transfer length and development length were proposed to account for the influence of concrete strength, a concept also suggested previously by Zia and Mostafa [1977]. It should be mentioned that a major research program on transfer and development lengths of prestressing strands has been underway for some time at the Turner and Fairbank Laboratory of the Federal Highway Administration and the final report is expected in 1996. The deformation of concrete depends on short-term properties such as the static and dynamic modulus, as well as strain capacity. It is also affected by time dependent properties such as shrinkage and creep. 4.2.1 Static and Dynamic Elastic Modulus The modulus of elasticity is generally related to the compressive strength of concrete. This relationship depends on the aggregate type, the mix proportions, curing conditions, rate of loading and method of measurement. More information is available on the static modulus than on the dynamic modulus since the measurement of elastic modulus can be routinely performed whereas the measurement of dynamic modulus is relatively more complex. 4.2.1.1 Static Modulus It is generally agreed that the elastic modulus of concrete increases with its compressive strength. The modulus is greatly affected by the properties of the coarse aggregate, the larger the amount of coarse aggregate with a high elastic modulus, the higher would be the modulus of elasticity of concrete. The modulus also increases with concrete age. Regardless of the mix proportions or curing age, concrete specimens tested in wet conditions show about 15% higher elastic modulus than tested in dry conditions. This is attributed to the effect of drying of transition zone between the aggregate and the paste. As strain rate is increased, the measured modulus of elasticity increases. Much more research data have been presented in the past few years and they generally confirm the above fundamental understandings. The effect of aggregate type was considered by Baalbaki et al. [1991], Giaccio et al. [1992], Nilsen and Aitcin [1992]; the effect of curing conditions by Asselanis et al. [1989] and Cabrera and Claisse [1991];and the size effect of test specimens by Baalbaki et al. [1992]. The effect of cold temperature on the elastic modulus was investigated by Lee et al. [1989] and their results indicated that the elastic modulus increased as the concrete is subjected to very low temperatures. Four commonly used empirical equations for the elastic modulus in terms of the compressive strength were presented in the previous state-of-the-art report [Zia et al. 1991]. They include the ACI Code equation, the equation recommended by the ACI Committee 363, the equation suggested by Ahmad et al., and the equation proposed by Cook. In a recent study by Alfes [1992], he proposed that in which is the elastic modulus in GPa, is the unit weight of concrete in kg/m3, and is the 28-day compressive strength of concrete. It is noted that this equation is quite similar to the equations recommended by Ahmad et al. and by Cook. Many authors [Baalbaki et al. 1992; Setunge et al. 1990; Nilsen and Aitcin 1992a] have found that their test data were overestimated by the ACI Code equation and the equations in other national codes. Some indicated a better representation by the equation recommended by the ACI Committee 363. However, many other authors have found that the ACI Code equation was quite acceptable for prediction [Zia et al. 1993a]. It seems that there is no consensus on this issue at the present time. If an accurate knowledge of the elastic modulus is desired, the best approach is to obtain the value from direct testing of the specific concrete being used for construction. A valuable record of long-term performance of the high strength concrete used in Water Tower Place has been reported by Russell and Larson [1989]. This record covers a period of 13 years. Another set of valuable test data on the engineering properties of commercially available high-strength concretes, including the elastic modulus, can be found in the report presented by Burg and Ost [1992]. 4.2.1.2 Dynamic Modulus As stated previously, much less information is available on the dynamic modulus than on the static modulus of HPC. In the past few years, very little has been published in the literature. What has been summarized in the previous state-of-the-art report [Zia et at. 1991] still represent the current knowledge of the subject. Generally speaking, the measurement of dynamic modulus corresponds to a very small instantaneous strain. Therefore the dynamic modulus is approximately equal to the initial tangent modulus which is appreciably higher than the static (secant) modulus. The difference between the two moduli is due in part to the fact that heterogeneity of concrete affects the two moduli in different ways. For low, medium, and high strength concretes, the dynamic modulus is generally 40%, 30% and 20% respectively higher than the static modulus of elasticity [Mehta 1986]. Recently, Nilsen and Aitcin [1992b] used pulse velocity test to predict the static modulus of elasticity of high-strength concrete. The strain capacity of concrete can be measured either in compression or in tension. In the compression mode, it can be measured by either concentric or eccentric compression testing. In the tensile mode, the strain capacity can be either for direct tension or indirect tension. The behavior under multiaxial stress states is outside the scope of this report, and only the behavior under uniaxial stress condition will be discussed. 4.2.2.1 Stress-Strain Behavior in Compression The stress-strain behavior is dependent on a number of parameters which include material variables such as aggregate type and testing variables such as age at testing, loading rate, strain gradient and others. Higher strength and corresponding strain are achieved for crushed aggregate from fine-grained diabase and limestone as compared to concretes made from smooth river gravel and from crushed granite that contained inclusions of a soft mineral. Many investigations have been conducted to obtain the complete stress-strain curves in compression with compressive strengths up to 20,000 psi (140 MPa). For concrete of higher strength, the shape of the ascending part of the curve becomes more linear and steeper, the strain at maximum stress is slightly higher, and the slope of the descending part becomes steeper. This is true whether the aggregate is normal weight or lightweight. To obtain the descending part of the stress-strain curve, it is necessary to avoid specimen-testing machine interaction. One approach is to use a closed-loop testing system with a constant rate of axial strain as a feedback signal for closed-loop operation. For very high strength concretes it may be necessary to use the lateral strains as a feedback signal rather than the axial strains. Another successful approach is to test high strength concrete cylinders in parallel with two or more instrumented auxiliary high strength steel tubes as reported by Banthia and Sicard [1989]. A comprehensive and simple way of characterizing the stress-strain response of concrete in compression is the fractional equation which has been described thoroughly in the previous state-of-the-art report [Zia et al. 1991]. Since high strength concrete is increasingly being used in members subjected to high compressive stress, the question of its ductility has become an issue of considerable interest. Several studies [Muguruma et al. 1989; Hatanaka et al. 1990; Hatanaka et al. 1991a; Hatanaka et al. 1991b; Koike and Hatanaka 1991; Sun and Sakino 1993] of high strength concrete with different degrees of lateral confinement have been conducted and the results were used to modify the previously proposed stress-strain models for confined high strength concrete. Due to the effective lateral confinement, the descending part of the stress-strain curve rises, becoming less steep, and the ultimate limiting strain is also increased. 4.2.2.2 Stress-Strain Behavior in Tension The direct tensile stress-strain curve is difficult to obtain. Due to difficulties in testing concrete in direct tension, only limited and often conflicting data are available. Other than the several studies described in the previous report [Zia et al. 1991], no new developments can be found in the recent literature. 4.2.2.3  :Flexural Tension While the information on the stress-strain behavior in tension is severely limited, virtually no data is available regarding the strain capacity in flexural tension. In the recent SHRP C-205 studies, Zia et al. [1993c, 1993d, 1993e] developed a special mounting device which was utilized to measure the flexural strain capacity of HPC under flexural tension tests. As expected, there was a wide range of scatter of the test data, roughly varying from 120m to 200m with 150m being a reasonable average value. This remains an area for which research is sorely needed to provide a basis for design where flexural cracking is an important consideration. Poisson's ratio under uniaxial loading conditions is defined as the ratio of lateral strain to strain in the direction of loading. In the inelastic range, due to volume dilation resulting from internal microcracking, the apparent Poisson's ratio is not constant but is an increasing function of the axial strain. Very limited data on the values of Poisson's ratio for high strength concrete is available. In general, Poisson's ratio of higher strength concrete in the elastic range appears comparable to the expected range of values (0.15 to 0.20) for lower-strength concrete. Slightly higher values (~0.22) are given by ultrasonic tests. In the inelastic range, the relative increase in lateral strains is less for higher-strength concrete than for concrete of lower strength. That is, higher-strength concrete exhibits less volume dilation than lower-strength concrete. This implies less internal microcracking for concrete of higher strength. Other than the data referenced to in the previous report [Zia et al. 1991], a more recent study on high strength concrete with strength up to 120 MPa (17,000 psi) by Setunge et al. [1990] indicated that the Poisson's ratio of very high strength concretes increased with an increase in compressive strength. An empirical equation was proposed for the Poisson' s ratio as a function of the square root of the compressive strength. Shrinkage and creep are time-dependent deformations that, along with cracking, provide the greatest concern for designers because of the degree of uncertainty associated with their prediction. Concrete exhibits elastic deformations only under loads of short duration, and due to additional deformation with time, the effective behavior is that of an inelastic and time-dependent material. 4.2.4.1 Shrinkage Shrinkage of high performance concrete may be expected to differ from conventional concrete in three broad areas: plastic shrinkage, drying shrinkage, and autogenous shrinkage. Plastic shrinkage occurs during the first few hours after fresh concrete is placed. During this period, moisture may evaporate faster from the concrete surface than it is replaced by bleed water from lower layers of the concrete mass. Paste-rich mixes, such as high performance concretes, will be more susceptible to plastic shrinkage than conventional concretes. Drying shrinkage occurs after the concrete has already attained its final set and a good portion of the chemical hydration process in the cement gel has been accomplished. Drying shrinkage of high strength concretes, although perhaps potentially larger due to higher paste volumes, do not, in fact, appear to be appreciably larger than conventional concretes. This is probably due to the increase in stiffness of the stronger mixes. Data for VES and HES mixes is limited. Autogenous shrinkage due to self-desiccation is perhaps more likely in concretes with very low W/CM ratio, although there is little data outside indirect evidence with certain high strength concrete research [Aitcin et al. 1990]. Shrinkage should not be confused with thermal contraction which occurs as concrete loses the heat of hydration. Shrinkage is a function of the paste, but is significantly influenced by the stiffness of the coarse aggregate. The interdependence of many factors creates difficulty in isolating causes and effectively predicting shrinkage without extensive testing. The key factors affecting the magnitude of shrinkage are:
A widely used predictive equation for shrinkage strain is that given by the ACI Committee 209 [1993]. It should be noted that if the usual laboratory-sized test specimens are used for determining the shrinkage properties of a concrete mix, then the predicted behavior of a concrete structure such as bridge, could well be in error unless correct allowances for curing and size effect are used. Surface area to volume and shape effect correction factors are used to accommodate physical differences affecting drying rates. Humidity and composition effect parameters can also be applied, however, these corrections are necessarily broad. Differences in empirical data can be large. Given a choice, casting a trial section is much preferred than relying on generalized predictive equations. The shrinkage properties of concretes with higher compressive strengths are summarized in an ACI State-of-the-Art Report [1993]. The basic conclusions were:
Collins [1989] conducted an experimental study on shrinkage of high-strength concrete in which five test mixes were prepared based on historical data. These mixes varied in paste content, aggregate size, and the use of high-range water-reducing admixtures. The results of the test program showed that shrinkage deformations were somewhat less for concrete mixtures with lower paste contents and larger aggregate size. In a more recent study, Alfes [1992] examined how shrinkage was affected by the aggregate content, the aggregate modulus of elasticity, and the silica fume content. Using W/C ratio in the range of 0.25 to 0.3 with 20% silica fume by weight of cement and varying amount and type of aggregates (basalt, LD-slag, and iron granulate), he produced concretes with 28-day strength in the range of 102 to 182 MPa (14,600 to 26,000 psi). The test results showed that there is a direct and linear relationship between the shrinkage value and the modulus of elasticity of the concrete. Carette et al. [1993] reported a study of high performance concretes with high volume fly ash from sources in the U. S. The concretes had low bleeding, satisfactory slump and setting characteristics and low autogenous temperature rise. These concretes also had excellent mechanical properties at both early and late ages with compressive strength reaching as high as 50 MPa (7,000 psi) at 91 days and the drying shrinkage of the concretes was relatively low. Field measurements of surface shrinkage strains on a mock column, fabricated with high strength concrete, after two and four years were made by Aitcin et al. [1990] and the measurements were compared with results on specimens under laboratory conditions. It was shown that the surface shrinkage strains under the field condition were considerably lower than those measured under the laboratory conditions. In a similar study by Hindy et al. [1994], measurements of dry shrinkage were made on concrete specimens as well as on instrumented reference columns made with two different ready-mixed high-performance concretes. One had a 91-day compressive strength of 98 MPa (14,200 psi) and the other had a 91-day compressive strength of 80 MPa (11,600 psi). The first contained silica fume but the second did not. The effects of curing time, curing conditions, silica fume content, and W/CM ratio were considered. It was found that the longer the curing time the lower the dry shrinkage, and that the lower the W/CM ratio the lower the dry shrinkage. Dry shrinkage of small specimens measured by the conventional laboratory test was found to over-estimate shrinkage of the concrete in the real structure. The ACI 209 predictive equation was found to be valid for the high performance concretes only if new values for the parameters were introduced. In the recent SHRP C-205 studies, Zia et al. [1993c, 1993d, 1993e] evaluated the shrinkage behavior of VES, HES, VHS concretes with different aggregates (crushed granite, marine marl, rounded gravel, and dense limerock). Shrinkage measurements were made for three to nine months in different cases. The observed behavior followed the general trend of conventional concrete except for the two cases of VES concrete using a special blended cement (Pyrament) with marine marl and rounded gravel as aggregates. In these two cases, the specimens exhibited an expansion of approximately 140 microstrains, rather than shrinkage for the entire period of 90 days. The expansion was attributed to the lack of evaporable water in the concrete because of its very low W/C (0.17 for marine marl, and 0.22 for rounded gravel). It should be noted that a valuable collection of 13-year shrinkage data on the concretes used for Water Tower Place in Chicago has been reported by Russell and Larson [1989] and the shrinkage data of a group of commercially produced high strength concretes can be found in the report by Burg and Ost [1992]. 4.2.4.2 Creep Creep is closely related to shrinkage and both phenomena are related to the hydrated cement paste. As a rule, a concrete that is resistant to shrinkage also has a low creep potential. The principal parameter influencing creep is the load intensity as a function of time; however, creep is also influenced by the composition of the concrete, the environmental conditions, and the size of the specimen. The composition of concrete can essentially be defined by the W/CM ratio, aggregate and cement types and quantities. Therefore, as with shrinkage, an increase in W/CM ratio and in cement content generally results in an increase in creep. Also, as with shrinkage, the aggregate induces a restraining effect so that an increase in aggregate content and stiffness reduces creep. Numerous tests have indicated that creep deformations are proportional to the applied stress at low stress levels. The valid upper limit of the relationship can vary between 0.2 and 0.5 of the compressive strength. This range of the proportionality is expected due to the large extent of microcracks in concrete at about 40 to 45% of the strength. A widely used predictive equation for creep strain at time t days after loading is that given by the ACI Committee 209 [1993]. As with shrinkage, use of standard-sized laboratory test specimens for determining creep properties of a concrete mix will require adjustment for size and shape effects to reasonably predict behavior of a concrete structure. Earlier studies on creep of concrete containing fly ash, silica fume, and high-range water reducer have been summarized in the previous report [Zia et al. 1991]. It was observed that, with comparable strength, there was no apparent difference between the specific creep of silica fume concrete and that of portland cement concrete, or of fly ash concrete. However, creep strains, creep coefficient, and specific creep were all smaller for high strength concrete than for concretes of medium and low strengths at different stress levels and at any time after loading. Collins [1989] investigated the effect of mix proportions on creep characteristics in a study in which five mixes with 28-day design strengths ranging from 8,700 psi to 9,300 psi (60 MPa to 64 MPa) were used. The results indicated that creep was somewhat less for concrete mixtures with lower cement paste and larger aggregate size. It was also shown that the use of high-range water-reducing admixture did not show a significant effect on the creep deformations. Carette et al. [1993] reported a study of high performance concretes with high volume fly ash from sources in the U. S. The concretes had low bleeding, satisfactory slump and setting characteristics and low autogenous temperature rise. These concretes also had excellent mechanical properties at both early and late ages with compressive strength reaching as high as 50 MPa (7,000 psi) at 91 days and the creep of the concretes was relatively low. In a study of long-term deflection of high-strength concrete beams, Paulson et al. [1991] pointed out that a large body of experimental evidence was available confirming that the creep coefficient of high-strength concrete under sustained axial compression was significantly less than that of ordinary concrete. Thus the ratio of time-dependent deflection to immediate elastic deflection of high-strength concrete beams under sustained loads should likewise be lower. With nine beams made of nominal concrete strengths over a range to 13,000 psi (91 MPa) and loaded over a 12-month period, they found significant differences between the deflection of high-strength concrete beams and that of nornal strength concrete beams. It was suggested that the long-term deflection multipliers of the ACI Code should be modified to account for the reduced creep deflection with high strength concrete. Since high-strength concrete is increasingly being used in compression members with reinforcement and creep data are generally obtained with small unreinforced specimens in the laboratory, Yamamoto [1990] conducted a creep test of a reinforced concrete column of 25 x 25 x 100 cm (9.84 x 9.84 x 39.4 in.) containing 2.44% longitudinal reinforcement and 0.79% lateral ties. The concrete strength was 582 kgf/cm2 (57 MPa or 8,280 psi) at 31 days. When the concrete was 33 days old, a sustained load of 198 kgf/cm2 (19.4 MPa or 2,815 psi) was applied on the column. After 170 days of loading, the creep coeffficient of the concrete was determined to be 0.57 and the ultimate creep coefficient was estimated to be 1.4 which suggested that the creep deformation of high-strength reinforced concrete columns would be much smaller than that of normal strength concrete columns. In the recent SHRP C-205 studies, Zia et al. [1993e] evaluated the creep behavior of VHS concretes with different aggregates (crushed granite, marine marl, and rounded gravel). Creep strain measurements were made for 90 days in each case. The observed creep strains of the different groups of VHS concrete ranged from 20% to 50% of that of conventional concrete. The creep strains were especially low for concretes with a 28-day strength in excess of 10,000 psi (70 MPa). The specific creep of the concrete with marine marl was much higher than that of the concrete with either crushed granite or washed rounded gravel. It should be noted that a valuable collection of 13-year creep data on the concretes used for Water Tower Place in Chicago has been reported by Russell and Larson [1989] and the creep data of a group of commercially produced high strength concretes can be found in the report by Burg and Ost [1992]. The thermal properties of concrete are of special concern in structures where thermal differentials may occur from environmental effects, including solar heating of pavements and bridge decks. The thermal properties of concrete are more complex than for most other materials, because not only is concrete a composite material whose components have different thermal properties, but its properties also depend on moisture content and porosity. Data on thermal properties of high performance concrete is limited, although the thermal properties of high strength concrete fall approximately within the same range as those of lower strength concrete, for characteristics such as specific heat, diffusivity, thermal conductivity and coefficient of thermal expansion [Farny and Panarese 1994]. Several earlier studies on the effects of extreme temperature on the behavior of concrete were summarized in the previous report [Zia et al. 1991], including the study by Castillo and Durrani [1990] on high-strength concrete (12,900 psi or 89 MPa) under temperatures ranging from 23oC to 800oC, and the study conducted by Diederichs et al. [1989] on high-strength concretes of 12,300 to 16,000 psi (85 to 111 MPa) subjected to temperatures up to 350oC. Also included was the study by Lee et al. [1989] on normal and high-strength concretes exposed to temperatures ranging from +20oC to -70oC. In a more recent study, Olsen [1990] evaluated the explosion risk of heat induced high strength concrete as compared to normal strength concrete. Cylinders of 100 x 200 mm with a compressive strength in the range from 30 MPa to 90 MPa were cured in two different ways: (a) Seven days in water followed by 21 days in laboratory atmosphere (20oC and 60%RH). (b) Seven days in water followed by 21 days sealed with plastic aluminum foil. A total of 36 cylinders were heated in an electrical oven at a heating rate of 2.5oC per minute until reaching a temperature of 600oC. After 2 hours at this temperature, the cylinders were cooled at a rate of up to 1oC per minute. The tests showed that the explosion risk depended on the curing conditions and that, in the case of high strength concrete, the explosion risk is not higher than for normal strength concrete especially for concrete cured under condition (a). In a study of deterioration of lightweight fly ash concrete due to gradual cryogenic frost cycles, Khayat [1991] monitored longitudinal thermal strains of water-saturated and air-dried concretes between 65o and -250oF. Cumulative drops in compressive and splitting tensile strengths were measured after each of 5 gradual freeze-thaw cycles ranging from a high of 65oF to two low temperatures of -40o and -100oF. That was done to evaluate the concrete's frost durability at liquified petroleum and natural gas temperatures, respectively. As expected, moist concrete exhibited larger dilation and residual strains than air-dried concrete. Burg and Ost [1992] measured the coefficient of thermal expansion of five commercially available high-strength concrete in the Chicago area and they found that the coefficient varied between 5.2 to 6.8 microinches/in./oF. Under repeated loads, concrete suffers damages resulting from progressive growth of internal microcracks. After a sufficient number of load repetitions, concrete fails at a load less than its static strength. The fatigue strength of concrete is therefore a fraction of its static strength that the concrete can support repeatedly for a given number of load cycles. At fatigue failure, concrete exhibits increased strains and reduced modulus (i.e. slope of its stress-strain curve) due to the progressive internal damages from microcracking. As the static strength of concrete increases, it becomes increasingly more brittle and its ultimate strain capacity does not increase proportionately with the increase in strength. Therefore very high strength concrete could be vulnerable to fatigue loading. However, in high strength concrete, the elastic modulus of the paste and that of the aggregate are more similar, thereby reducing stress concentrations at the aggregate paste interface, which would make high strength concrete less susceptible to fatigue loading. The basic concepts of S–N curve, Goodman diagram, and Miner's Rule regarding fatigue strength have been described in the previous report [Zia et al. 1991]. In addition, earlier fatigue studies examining the various effects of loading variations (such as effect of resting, effect of loading rate, effect of stress gradient, effect of stress reversal, effect of impact load, and effect of air entrainment) have also been summarized in the same report. In the following, only a few of the special fatigue studies reported recently will be described. Bazant and Schell [1993] reported an experimental study of fatigue fracture of geometrically similar high-strength concrete specimens of very different sizes. Notched beams were subjected to three-point cyclic loading. The number of cycles to failure ranged from 200 to 41,000. It was found that Paris law for the crack length increment per cycle as a function of the stress intensity factor, which was previously verified for normal strength concrete, was also applicable to high-strength concrete. However, for specimens of different sizes, an adjustment for the size effect needs to be introduced, of a similar type as previously introduced for normal strength concrete. A linear regression plot estimating the size-adjustment parameters was derived. A linear elastic fracture mechanics type calculation of the deflections under cyclic loading on the basis of the size-adjusted Paris law produced correct values for the terminal phase but grossly underpredicted the initial deflections. The results underscore the importance of considering fatigue fracture growth in the case of high-strength concrete structures subjected to large, repeated loads, and taking into account the very high brittleness under fatigue loading. Based on a deformation formulation and utilizing the monotonic force-deflection curve and the fatigue creep curve, Daerga and Pontinen [1993] developed a hypothesis for fatigue failure of concrete structures. The hypothesis was applied to flexural fatigue tests of notched beams of a plain high performance concrete. The experiments comprised monotonic loading in deformation control and constant amplitude loading at three different load levels in flexural tension. The test results essentially confirmed the hypothesis. Furthermore, the hypothesis provided an estimation of accumulated damage and a prediction of remaining service life, which accounted for the nonlinear nature of damage development. Do et al. [1993] conducted tests to provide data on the response of high-strength concrete to cyclic loading. The test results were compared with those on normal strength concrete and also with those obtained in other studies with high-strength concrete. It was found that fatigue life results are scattered, but may be predicted reasonably well using a probabilistic approach based on the McCall model and assuming a probability of failure. Longitudinal strain development in high-strength concrete is similar to normal strength concrete. The results of low-cycle fatigue testing of high-strength concrete were reported recently by Mor et al. [1992]. In their study, lightweight and normal weight aggregate concretes were tested under reversible loading under both submerged and air-dry conditions. Fatigue capacity of lightweight aggregate concrete was similar to or better than that of normal weight aggregate concrete of similar strength properties. Submersion of high-strength concrete in water did not affect its fatigue capacity. Fatigue capacity of high-strength reinforced concrete was found to be directly related to the bond between concrete and reinforcement and not related to any other strength property. The addition of silica fume to lightweight aggregate concrete improved its bond by 100 percent and its fatigue life by over 60 percent. No significant improvement was observed when silica fume was added to normal weight aggregate concrete. Flexural fatigue loading is common in concrete pavements and bridge decks. Fatigue fracture characteristics of Florida concrete subjected to flexural loading was investigated by Tawfiq [1993]. The objectives of the investigation were (1) to investigate the effect of several parameters on the fatigue strength of Florida concrete under constant amplitude loading, and (2) to obtain a relationship between these parameters and the fatigue life represented by the number of cycles of loading endured. Three parameters were used in the study: (1) stress ratio, (2) number of cycles of loading to failure, and (3) the compressive strength of concrete. Additionally, the strain accumulation, hysteretic behavior, and stiffness degradation were also studied. Based on the test results, the author suggested four empirical formulas to predict the fatigue strength of Florida concrete. Three of the four formulas are intended for plain concrete elements with pre-existing cracking (notched) and the fourth formula is used to estimate the total fatigue life for uncracked elements (unnotched). The test results showed that high strength concrete could have about 22% shorter fatigue life than lower strength concrete. This implies that to prolong the fatigue life of a high strength concrete element subjected to 70% loading ratio, the total applied loads should be multiplied by a factor of 0.78. The rate of stiffness deterioration at the second stage of cracking was much higher in high strength concrete than in lower strength concrete. This confirms the need for better quality control and assurance when high strength concrete is used in pavement and bridge construction. When properly designed and carefully produced with good quality control, concrete is inherently a durable material. However, under adverse conditions, concrete is potentially vulnerable to deleterious attacks such as frost, sulfate attack, alkali-aggregate reaction, and corrosion of steel. Each of these processes involves movement of water or other fluids, transporting aggressive agents through the pore structure of concrete. Therefore, porosity and permeability are important properties which affect the durability of concrete. 4.4.1 Porosity and Permeability An excellent review of the pore structure and its influence on permeability of cement paste and concrete has been presented by Young [1988]. It is generally agreed that for normal-weight concrete, its porosity resides principally in the cement paste. The pore structure of the paste can be classified into two types: (1) intrinsic pores in the cement gel resulting from hydration; and (2) capillary pores originating from the space initially filled with water. The size and distribution of these pores cover a very large range, from much less than 2.5 nm to 10,000 nm. Typically, the size of the gel pores is less than 10 nm whereas the size of the capillary pores is more than 10 nm. Pores of 10,000 nm or larger are classified as air voids. In the previous state-of-the-art report [Zia et al. 1991], the basic information on how porosity and permeability are affected by W/C ratio, curing, mineral and chemical admixtures has been presented, and the various methods commonly used to measure porosity and permeability has been discussed. In the past several years, a large number of porosity and permeability studies have been reported in the literature. Some of these recent studies will be summarized in the following sections. 4.4.1.1 Porosity Based on energy, structural stability and durability criteria, Xu et al. [1993] proposed an ideal structural model for very low porosity cementitious materials. It was suggested that the ideal structure would consist of surface reactive fine fillers and cementitious products combined to form a chemically stable mature network with good interfacial bond. They investigated a new method involving treatment of aggregate surfaces for use in forming ideal structures, and the effects of matrix and filler characteristics on interfacial bond were examined. A method of replacing a large quantity of unhydrated cement in very low porosity cementitious systems was investigated. The test results demonstrated that interfacial bond was an important factor affecting mechanical properties, and that replacing unhydrated cement by inert fine aggregates resulted in a considerable decrease of strength. Surface treatment of aggregates was effective in maintaining the compressive strength of mortar at the same level as pure cement paste. Surface hydraulic aggregates were effective in producing the ideal structure for very low porosity cementitious materials. It seemed that a key factor in approaching ideal structure is to change inert aggregate surfaces into chemically reactive surfaces. Mercury intrusion porosimetry is a common method for measuring pore size distribution of hydrated cement products. However, an accurate measurement of this is difficult to obtain. Feldman and Beaudoin [1991] used mercury intrusion porosimetry to 414 MPa to measure the pore size distribution of cement pastes prepared at W/C ratio of 0.8, 0.6, and 0.45. Specimens were predried before intrusion measurements by several techniques including solvent replacement with methanol or isopropanol, evacuation and/or heating for various periods and conditioning at 11% RH. Second intrusions were also performed to investigate the effects of first intrusion. They concluded that it was not possible to obtain an actual pore size distribution of cement paste by mercury intrusion because of its sensitivity to stress. 4.4.1.2 Permeability A. Air (or Gas) Permeability Bunte and Rostasy [1989] described three selected methods that are suitable for on-site testing of concrete permeability, among them are the air permeability test methods by Schonlin and Hilsdorf and by Figg. Both methods measure the air permeability of the surface layer of concrete. In the Figg method [Figg 1992], a small hole (10 mm diameter and 40 mm deep) is drilled into the concrete and the hole is plugged to half its depth with silicone rubber, either cast in-situ or using a specially shaped preformed bung. A 17-gage hypodermic needle is then pressed through the plug to reach the small test cavity which is evacuated to a pressure of 55 kPa below atmospheric and the time (in seconds) for a 5 kPa pressure increase is taken as a measure of the concrete permeability. See Fig. 4.13(a). In the Schonlin and Hilsdorf method, a small suction chamber is adhered to the concrete surface by creating a partial vacuum inside the chamber. See Fig. 4.14(a). The reduction of vacuum inside the chamber due to flow of air through the concrete into the chamber is monitored with respect to time. The permeability index of the concrete is determined from the change of pressure in the chamber within a give time period. If V is the volume of the vacuum chamber and pa is the atmospheric pressure outside the chamber, Dt is the lapse of time during which the initial pressure in the chamber pi is increased to p, then the permeability index is calculated by the following equation:
Schonlin and Hilsdorf [1988] had also extended their test procedure to determine the air permeability of a concrete disk of 150 mm diameter and 40 mm thick. See Fig. 14(b). The concrete disk is cast directly into a rubber ring and is subsequently cured for 7 days, unless the duration of curing is the variable, and then stored in a constant environment of 20oC, 65% RH up to the time of testing at an age of 56 days. The vacuum chamber is adhered to one side of the disk specimen with the other side of the disk exposed to the atmospheric pressure. The vacuum chamber is evacuated first to a stabilized pressure and a stop cock between the vacuum pump and the instrument is closed. As the air flows through the concrete disk, the air pressure in the vacuum chamber increases. A time t0 is taken when the pressure reaches a value of p0 = 20 mbar and time t1 is taken when the pressure reaches a value of p1 = 50 mbar. Based on these pressure and time measurements, the permeabilty coefficient K (m2/sec) is obtained from the following expression: 
in which is the volume of the vacuum chamber, is the atmospheric pressure, is the thickness of the specimen, and A is the cross-sectional area of the specimen. Hilsdorf [1989] investigated the question of whether a single parameter such as the air permeability of concrete is suitable to characterize concrete durability in a general way. He pointed out that a characteristic air permeability coefficient K as defined by Eq. (4.7) for a standard concrete specimen cured and preconditioned in a standardized way can be determined rapidly and reliably with the test procedure described above. The characteristic air permeability coefficient K reflects the effects of W/C ratio and curing, and correlates well with the progress of carbonation under laboratory conditions [Burieke and Hilsdorf 1993]. Lower air permeability coefficient also indicates a higher resistance to freezing and thawing, to chemical attack, and to penetration of chloride ions. However, the relationships between K and depth of carbonation and other factors affecting durability may no longer be unique if concretes contain larger amounts of admixtures (both mineral and chemical). Thus he concludes that air permeability of concrete is not the unique parameter to describe concrete durability, and it is unlikely that such a parameter exists. Nevertheless, he argues that it is advantageous to characterize concrete not only in terms of its standard compressive strength but also in terms of K since together with a knowledge of the type of cement it reveals several technological parameters such as composition and curing on the potential durability of a particular concrete. Using a test device and procedure virtually identical to Schonlin and Hilsdorf's, Leeming [1993] conducted the surface air permeability test to determine the relative durability of concrete. See Fig. 4.15. The initial results of the test showed that the test was sensitive enough to differentiate between the sides, top and bottom of a concrete cube and that it also related in some measure to the carbonation depth. However, the test was sensitive to the moisture content of the concrete as all other known permeability test procedures. It was suggested that one potential application was the testing of surface coatings for their ability to restrict the carbonation of concrete. Another possible application would be to test whether the surface of the concrete is sufficiently dry so that silanes will achieve adequate penetration. Following virtually the same concept as that of Schonlin and Hilsdorf, Whiting and Cady [1992] developed a device for measurement of air permeability of concrete as a part of their SHRP project. A series of comparative tests was carried out and it was established that a linear relationship existed between results obtained on the same specimens using the laboratory and field versions of the method. See Fig. 4.16. A series of field trials was also conducted to evaluate the device under actual test conditions. The results from three test sites showed that there was a general relationship between the readings taken in the field and the air permeability values determined from cores taken at the sites. Just as other similar devices, Whiting and Cady's device is portable, can take measurements on overhead and vertical surfaces, has a short testing time, and is fairly simple to operate. However, the device has an effective depth of measurement of only approximately 12.5 mm (0.5 in.) and the air intake is from an undefined surface area. It also has difficulty in achieving a good seal when the test surfaces are rough or contain microcracks, and it has been reported that the consistency of the test results in the field appears to be highly operator-dependent. In contrast to the devices described above, which utilize vacuum to draw air out of concrete, Basheer et al. [1993a, 1993b] developed "Autoclam" permeability system for measuring the in-situ permeation properties of concrete by applying a pressure over the concrete surface to force air into it. See Fig. 4.17(a). Thus the base ring of Autoclam must be fastened to the concrete surface by strong adhesives or mechanical anchors. Using the equipment, the rate of decay of air pressure in the cell is recorded for the air permeability test. It was found that statistically satisfactory results could be obtained from a mean of three tests, and since the flow lines were largely concentrated within 40 mm from the test surface, reliable data could be collected by dry the surface even if the surface under test was initially wet. Tests were performed with W/C ratio, aggregate/cement ratio, and number of days of wet curing as the variables. Using a test cell developed at Leeds University [Cabrera and Lynsdale 1988], Cabrera et al. [1989] conducted an extensive laboratory study of oxygen permeability of concrete involving 25 mixes with varying W/C ratios and five different types of superplasticizer. The mix designs were based on the criterion of minimum porosity by selecting the components of concrete to achieve maximum packing. Some mixes were also prepared by substituting 30% of cement with fly ash. The specimens were cured in a fog room kept at 20oC and 100% RH. Prior to testing for porosity and oxygen permeability, the specimens were dried in an oven at 105oC. In addition to air content, slump, flow table reading, and compressive strength measured by the standard methods, the porosity was obtained by helium pycnometry using a Micromeritics Autopycnometer. With the abundance of data from the 25 mixes, the data were analyzed by using a standard statistical package (SAS) achieving a confidence limit of 95%. Based on the statistical analysis, they developed a model relating permeability to several key parameters as follows:
If the data for concrete mixes with and without fly ash were separately grouped, the following two models relating oxygen permeability to porosity and compressive strength were obtained. For concrete without fly ash, and for concrete with fly ash, in which fcu = compressive strength of cube in MPa. To use a permeability test for quality control would require measurements to be made at early ages. Therefore relations to predict the long-term permeability of concrete from values at early ages would be very useful. From the data collected in this study, a statistical model to predict the permeability of concrete up to the age of 90 days from its one-day value was obtained.
where K1 = one-day value of permeability in m2, and t = concrete age in days. Using Eq. (4.10), one can establish tentative one-day permeability values as a criterion for designing for durability at the stage of trial mixes for a particular job, from the knowledge of the permeability of "good" and "bad" in-service concrete. The investigators obtained the permeability values of in-service 30 year old concretes, both "good" concrete and "bad" concrete showing signs of distress and cracking. The values were 5 x 10-17 m2 and 190 x 10-17 m2 respectively. By using these values as the target long-term permeabilities, one can determine the one-day permeability values from Eq. (4.10) as follows: For "good" concrete, K =1.02 x 10⁻¹⁶ m2 = 10.2 x 10⁻¹⁷ m2 and for "bad" concrete,K1 =1.02 x 10⁻¹⁴ m2 = 1,020 x 10-17 m2 The above illustrates an approach to design for durable concrete with permeability as control. It should be understood that the models can be of more general use if the data base is expanded to cover a wider range of concrete mixes. Based on the above results, it was suggested by the authors that the target design value for oxygen permeability at one day should be 10 x 10-17 m2. Air permeability test was also used by Dhir et al. [1991] to characterize the intrinsic permeability of concrete. The effect of micro-cracking on air permeability of concrete was studied by Nagataki and Ujike [1991]. The micro-crackings were induced by the differences of thermal expansion coefficients between aggregate and mortar or between aggregate and cement paste under elevated temperature as well as internal crackings formed around deformed tension bar. The air permeability coefficient of concrete under elevated temperature above 100oC was substantially higher than that of concrete at normal temperature. For reinforced concrete specimens subjected to sustained tensile loading, the air permeability coefficient through concrete cover was also much higher than that of the specimens without tensile loading. As one would expect, the air permeability coefficient increased as the tensile stress increased and the diameter of the steel bar became larger. Torrent and Jornet [1991] conducted a comprehensive research program to evaluate the quality of the outer layer of concrete (the 'covercrete'), in terms of its durability and protective value to the underlying reinforcing bars. The effects of the concrete grade and cement type on the oxygen permeability were investigated. The specimens were moist-cured for 7 days followed by dry curing for 21 days. The results showed that the permeability to oxygen was reduced 40 times when the concrete strength was increased from 25 to 85 MPa. However, the cement type (including portland and blended cements) seemed to play only a secondary role in the quality of the 'covercrete' of concretes of the same grade, especially above 25 MPa. The permeability of blended cement concrete was compared to that of the alkali activated slag concrete and portland cement concrete by Hakkinen [1992] using carbonation tests and gas penetration. The test results indicated that the high strength slag concrete activated by cement was very dense. The carbonation test results showed that in high strength concrete the dense structure of the paste compensates for the lack of calcium in blended cement concrete. In the alkali activated slag concrete the structure contained microcracks at the microscopic level, and the carbonation was significantly higher in alkali activated slag concrete than in other concretes. The gas permeability results revealed the same trends at the carbonation tests. B. Hydraulic Permeability Absorption is a liquid transport mechanism due to capillary suction in pores of concrete. Balayssac et al. [1993] used the water absorption test for assessing both cover concrete porosity and largest capillary size, which are significant factors for concrete durability. The criterion used was the amount of water absorbed after one hour. The value is sufficiently representative of the mean radius of the largest capillaries. The results showed that the absorption test could be used to assess the effects of cement content on porosity of cover concrete and to account for the beneficial effects of curing on capillary size. Correlations were also established between carbonation depth and amount of water absorbed after one hour, which confirmed the validity of the tests for assessment of the resistance of concrete to carbonation. McCarter and Ezirim [1990] also examined the movement of water into concrete using sorptivity test by measuring the depth of water penetration. Cylinders of 150 x 300 mm (6 x 12 in.) were cast with a high strength concrete (W/C = 0.35) and a low strength concrete (W/C = 0.6), both with ordinary portland cement. After 24 hours, the cylinders were demolded and the sides of the cylinders were sealed with a latex based paint, and left to cure at 21oC, +55% of -5% relative humidity. After curing, the cylinders were placed in plastic containers on stainless steel rods and the containers were filled with water up to 10 mm above the exposed surface. The specimens were removed after 1, 4, 9, 25, and 169 hours and split longitudinally. The depth of water penetration was detected by dusting the fractured surface with a moisture sensitive dye. By plotting the depth of penetration of water against square root of time for the complete test period, an equation was obtained for calculating the depth of penetration of water. The air permeability test method by Figg described in Section A can also be used easily for water permeability test [Figg 1992]. To conduct the water permeability test which must be subsequent to the air test, the drilled cavity is filled with water at a hydrostatic head of 100 ml and the time for 0.01 ml of water to be absorbed by concrete is measured. See Fig. 4.13(b). Thus the permeability is expressed as a time in seconds. The shorter the time the more permeable the concrete, and conversely, the more durable the concrete the longer the permeability time. Figg used this method to evaluate durability of concrete prisms made with three different aggregate/cement ratios (1:3, 1:6, and 1:9), three different aggregates (flint gravel, limestone, and basalt), and W/C ratios in the range of 0.35 to 0.90. After 28 days of curing under water, the prisms were left outdoors in trays 50 mm deep to accelerate damage from weathering. The most permeable concretes (basalt) suffered damage after 12 winters exposure. Even though the specimens showed unexpectedly good performance, the permeability tests correctly predicted relative durability of the different concretes. Similarly, "Autoclam" developed by Basheer et al. [1993a, 1993b] is so equipped that it can also be used for water permeability test. See Fig. 4.17(b). Another method for measuring water permeability is the Initial Surface Absorption Test (ISAT) which has been recognized by the British Standards. See Fig. 4.18(a). One of the difficulties with the test method was the leakage problem of the watertight cap. To overcome the problem, a modified cap was developed. See Fig. 4.18(b). It is noted that to fasten the test device to the concrete surface anchor bolts must be installed. Using the ISAT, which is sensitive to curing, cement type and grade of concrete, Dhir et al. [1994] found close correlations between permeation properties and the durability of concrete. In a study lasting for 10 years, a wide range of concrete mixes were designed using ordinary portland cement and blended cement with fly ash and ground granulated blastfurnace slag. Moist curing was varied from 0 to 28 days, and the maximum aggregate size from 5 to 40 mm. All mixes were tested for absorptivity and different aspects of durability including freezing-thawing resistance, carbonation, chloride ingress and mechanical wear. The test results showed that the absorptivity of concrete, measured with the ISAT, could be used as an accurate specification for concrete durability, irrespective of curing, grade or mix constituents. Based on the test results, a tentative classification for concrete durability was proposed as shown in Table 4.4. Another method for measuring transient permeability in the laboratory was developed by Roy [1989], see Fig. 4.19. Her test setup uses cylindrical specimens contained in a flexible sleeve and connected to an up-stream and down-stream fluid reservoir. At the start of the experiment, both reservoirs and the specimen are maintained at the same constant pressure. Fluid flow is initiated through the specimen by rapidly establishing a pressure gradient between the up-stream and down-stream reservoirs. As the pressure begins to decay through the test sample, it is monitored and from this pressure decay, the permeability is calculated. Simultaneous collection of data from both the up-stream and down-stream reservoirs allows a simpler and more accurate data analysis technique which does not depend on knowing the value of the final pressure at the outset of the experiment. Measurements on several samples have resulted in a permeability of 9 x 10⁻⁸ darcys which is consistent with previous measurements on permeability using both liquid (water) and gas systems. An efficient laboratory test set-up for conducting 40 water permeability tests simultaneously has been developed in Florida and used in an extensive study to evaluate the effects of various mix parameters and curing conditions on the modulus of rupture and permeability of structural concretes commonly used in Florida [Tia et al. 1990]. The test program covered three aggregate types (a Florida porous limestone, a river gravel, and an Alabama dense limestone), three cement types (Type I, II, and III), three W/C ratios (0.33, 0.38 and 0.45), three maximum aggregate sizes (3/8, 3/4, and 1 in.), two pozzolans (fly ash and silica fume) and six curing conditions ( steam curing, air curing, curing compound and three moist curing conditions). In addition, concrete samples obtained from six concrete projects in Florida were tested to evaluate the differences between the in-service concrete and the laboratory-cured concrete. Based on the successful laboratory studies, a field permeability test (FPT) method was developed and implemented in the testing and evaluation of thirteen selected marine concrete structures in Florida [Tia et al. 1992; Meletiou and Tia 1992]. Core samples of the site concrete tested by the FPTs were extracted and evaluated in the laboratory using the standard rapid chloride permeability test. The results of the rapid chlorida permeability test were found to be linearly related to the water permeabilities as measured by the FPT method. The latter was found to be able to provide a relative measurement of permeability which can be used as an indicator of the quality and performance characteristics of structural concrete. The effect of curing conditions on the permeability and durability of concrete exposed to field conditions was investigated by Ewertson and Petersson [1993]. Two classes of concrete were cured under different conditions and then exposed to three different environments: outdoors exposed to rain fall, outdoors protected from rainfall, and indoors. After one or two years of such exposures, the water permeability and the carbonation depth were determined. The test results showed that the differences between different curing conditions were more pronounced the drier the climate. This means that laboratory tests cannot always be used for predicting the concrete behavior of a real structure. Field exposure tests are to be preferred. The results from the carbonation tests indicated that wet curing and covering with plastic sheet were equally efficient. The effects on oxygen permeability and water absorption at various depths in the "covercrete" were also investigated by Ballim [1993] with concrete containing ordinary portland cement and blended cements with fly ash and GGBS. A range of strength grades was tested for each of the binder types. Concretes were exposed to moist curing conditions for 1, 3, 7, and 28 days before being tested at 28 days after casting. It was observed that moist curing had a marked influence on the potential durability of concrete and that a relatively greater influence on durability could be effected by extending the duration of early-age moist curing rather than decreasing the water/binder ratio. C. Chloride Ion Permeability A standard procedure for measuring the movement of chloride ion through concrete is the test method of AASHTO T 277 "Rapid Determination of the Chloride Permeability of Concrete." In this procedure, the specimens are conditioned first by one hour of air dry, three hours of vacuum (pressure < 1 mm Hg), one hour of additional vacuum with specimens under de-aired water, and followed by 18 hours of soaking in water. The test consists of monitoring the amount of electrical current passed through 102 mm (4 in.) diameter x 51 mm (2 in.) long vacuum-saturated concrete specimen when one side of the specimen is immersed in a NaCl solution and the other side in a NaOH solution and a potential difference of 60V dc is maintained on the specimen for 6 hours. The total chage passed, in coulombs, is related to chloride permeability of the specimen.. The lower the total charge, the less permeable and more durable is the concrete. While the AASHTO method has been widely used by many investigators, it is not without some shortcomings. First, since the method measures the total charge flowing through the test specimen in 6 hours, it tends to heat up the specimen. Higher temperature causes more current to flow through the specimen which, in turn, causes more temperature increase in the specimen. Consequently, the test can show very high total charge values as experienced by Zia et al. [1993c, 1993d, 1993e] and Geiker et al. [1991]. The temperature effect can be overcome by measuring the initial current flowing through the specimen or by measuring the AC impedance of the specimen [Hansen et al. 1993]. Chloride permeability (in coulombs) is essentially a conductance test whereas AC impedance (in ohms) is essentially a resistance test. Since the two properties are reciprocals, an inverse relationship could be expected between the two measurements. Their test data indicated that the initial current could be correlated with the inverse impedance (reciprocal of impedance). In an investigation of the AASHTO T 277 test procedures, Feldman et al. [1994] also found that simple measurement of initial current or resistivity gave the same ranking as conventional tests for the four classes of concretes they studied and that the initial current or resistivity measurement can replace the rapid chloride permeability test with a considerable time saving. Another potential problem with the AASHTO T 277 test is that it may be affected by admixtures used in the concrete. ASTM C 1202 "Electrical Indication of Concrete's Ability to Resist Chloride Ion Penetration" which is basically the same document as AASHTO T 277, cautions that the rapid chloride permeability test can produce misleading results when calcium nitrite has been added and mixed into the concrete. The test has shown higher coulomb values on concrete with calcium nitrite than on identical concrete without calcium nitrite. However, ponding tests on concrete with calcium nitrite have shown it to be as resistant to chloride ion penetration as concrete without calcium nitrite. The high coulomb measurement may be due to additional ions being introduced with the calcium nitrite, making the water in the concrete more electrically conductive and making the concrete appear more permeable. Thus any time ions are added from any admixture or other source, the high coulomb measurement may become a problem. The same consideration should also be true for the AC impedance test. Both AASHTO T 277 and ASTM C 1202 imply a correlation between the total charge (coulombs) measured and the amount of chloride ingress. However, Pfeifer et al. [1994] reviewed the documents referenced in ASTM C 1202 and concluded that reliable and proper correlations do not exist between the rapid test procedure results and 90-day ponding test results. They recommended that the table relating chloride penetration to coulomb values in these test procedures be removed since it is inaccurate and can be misleading. The influence of drying on the chloride ion permeability of high performance concretes was investigated by Pigeon et al. [1993]. A wide range of concretes ranging from very high performance to normal concretes with 13 basic mixtures were prepared using four different hydraulic binders at three W/CM ratios. The specimens were dried at three different temperatures. It was found that with the use of silica fume and W/CM of 0.25 or less, it was possible to make high performance concretes that are extremely resistant to the internal damage that can result from drying, even at 110oC. They concluded that it is most probable that, under natural exposure conditions, the resistance to the penetration of chloride ions of the concretes will decrease significantly with time, unless they are not adequately protected against the effect of freezing and thawing cycles. Given the appropriate lightweight aggregate, the concrete industry is now capable of producing high-strength lightweight concrete. With its increased strength to weight ratio, the structural advantage of such concrete is quite obvious. The issue of durability of high-strength lightweight concrete has received increasing attention from the researchers and engineers. Recent investigations have been reported by both Burg et al. [1990] and Zhang and Gjorv [1991a, 1991b]. Three high-strength lightweight concretes intended for severe, marine exposure were developed by Burg et al. for the unique set of environmental and operating conditions encountered by arctic offshore structures. Two of the concretes had a design compressive strength of 49 MPa (7,000 psi), one with fly ash and the other with silica fume. The third concrete had a design strength of 63 MPa (9,000 psi) and contained silica fume. Salient properties of both fresh concrete and hardened concrete were obtained including chloride permeability. Measured data, where possible, were compared with theoretical values based on compressive strength. Where appropriate, modified relationships between measured compressive strength and other mechanical properties were suggested. Zhang and Gjorv's studies were focused on both the mechanical properties and the resistance of high-strength lightweight concrete (50 to 100 MPa) to water penetration and accelerated chloride penetration. Their results indicated that the permeability of high-strength lightweight concrete appeared to be very low but might be higher than that of normal weight concrete at a similar strength level. The permeability appeared to depend on the porosity of the mortar matrix than the porosity of the lightweight aggregate. There also appeared to be an optimum cement content for permeability. No direct relationship between water permeability and electrical conductivity was observed, but a direct relationship between water permeability and accelerated rate of chloride penetration was observed. D. Effect of Mineral Admixtures It is generally recognized that the use of fly ash, silica fume, and GGBS will improve the pore structures and thus the durability of concrete. High performance concretes are produced often with large quantities of these mineral admixtures. Such applications not only will help improve the strength and durability characteristics of high performance concrete but also will help dispose more of the industrial by-products which are major environmental concerns. The effect of mineral admixtures on the pore structure and chloride permeability of concrete was examined by both Geiker et al. [1991] and Torii and Kawamura [1991]. Using the AASHTO T 277 method, they found with mineral admixtures the concrete was much less permeable to chloride ions than the concrete without mineral admixtures independent of curing and environmental conditions. Torii and Kawamura also found that at the surface of concretes with a mineral admixture the hydration of portland cement was considerably depressed and coarse pores were developed when concrete with a mineral admixture were stored in a dry condition for a long time. However, at the depth of 5 cm from the surface of concrete specimen there was little change both in the degree of hydration and the pore structure. Numerous similar studies [Malhotra 1990; Ellis et al. 1991; Dunstan et al. 1993; Dhir and Byars 1993a, 1993b; Dhir et at. 1993; Ozyildirim 1992, 1994; Ozyildirim and Halstead 1994; Bilodeau et al. 1994] have also been published in the past several years. These studies are generally project-specific with respect to constituent materials, curing methods, environmental exposures, and testing techniques. The results usually indicate the beneficial effects of the three commonly used mineral admixtures. E. Comparative Evaluations The majority of the permeability studies reported in the literature are carried out usually by using more than one permeability test procedures. Parallel tests for air (or oxygen) permeability, water permeability, carbonation depth, chloride permeability, and/or resistivity are often conducted to develop correlations among these characteristics. For a specific investigation, acceptable correlations can usually be established. However, the correlations are dependent on the specific parameters involved in each study and therefore cannot be generalized. Examples of these comparative evaluations can be found in the publications by Galligo and Rodriguez [1991], Torrent et al. [1991], Zhang and Gjorv [1991b], Hakkinen [1992], Dunstan et al. [1993], and Dhir et al. [1993a, 1993b]. A collection of useful data on rapid chloride permeability, electrical resistivity, corrosion rate, and water absorption of commercially available high-strength concretes has been presented by Burg and Ost [1992]. The ranking of the different mixes tested in terms of water absorption is identical to that of rapid chloride permeability. The measured concrete resistivity is also consistent with the indicated corrosion rate for each mix tested. Damage of concrete under repeated cycles of freezing and thawing (frost attack) is a major problem of durability. In the previous state-of-the-art report [Zia et al. 1991], the mechanism with which freezing and thawing damages concrete has been discussed and some of the earlier reseaches have been summarized. For the normal strength concrete, entrained air of 4 to 8% by volume of concrete provides an effective defense against frost damage and the exact amount is dependent on the maximum size of the coarse aggregate, provided that the coarse aggregate itself is frost resistant [Zia et al. 1993a]. The optimum spacing factor of the air voids should be no more than 0.2 mm (0.008 in.) and the air voids should be small with their diameter being in the range of 0.05 to 1.25 mm (0.002 to 0.05 in.) to ensure that the required spacing factor is obtained with low air contents. By using concretes with different entrained air void systems subjected to long and short cycles of freezing and thawing in 4% sodium chloride solution, Stark [1989] found that the long freeze-thaw cycles were more severe than the short freeze-thaw cycles for same number of cycles, even where air void spacing factors were no greater than 0.2 mm (008 in.). His findings agree with the ice accretion theory of frost damage in concrete. However, Attiogbe et al. [1992] noted that properly air-entrained concretes containing superplasticizers can have adequate freeze-thaw resistance at calculated spacing factors greater than the ACI recommended maximum spacing factor of 0.008 in. (0.2 mm). Their test data for concretes made with or without superplasticizers showed that virtually all the concretes with adequate resistance under freeze-thaw testing had specific surface values less than the ACI recommended minimum. Siebel [1989] found that when superplasticizers were used in a high workability air-entrained concrete, the number of pores with a diameter up to 300 mm decreased, while the content of pores larger than 500 mm and the bubble spacing factor increased. Small pores coalesced and formed larger pores. Although the air content of the fresh concrete was sufficient, the superplasticized concrete sometimes had a spacing factor above 0.20 mm. For this reason, concrete with superplasticizers did not always have adequate freezing and thawing resistance. The de-airing agents contained in the superplasticizers were found to have a considerable effect. At the present time, there is no clear direction as to whether all high-strength concrete will require air-entrainment and the necessary air-void parameters. Some argue that with low W/CM ratio and mineral admixtures, the amount of freezable water in high-strength concrete would be low and its pore size would be decreased to the extent that water in the pore cannot freeze. However, in their study of high performance concretes, Zia et al. [1993c, 1993d, 1993e] found that 5% entrained air was required to achieve a higher level of frost resistance than that required by the ASTM C 666, Procedure A (i.e., a durability factor of 80% versus 60%). Galeota et al. [1991] studied the freeze-thaw resistance of both non-air-entrained and air-entrained cylindrical specimens (38 specimens of each kind). Half of each kind contained 20% silica fume by weight of cement. After every 50 cycles of freezing and thawing, the dynamic modulus of the specimen was measured and compared with that of the control specimen to determine the durability factor until the durability factor was reduced to 40 per cent. Each cycle of freezing and thawing lasted 12 hours during which the specimens were cooled from 5oC ± 2oC to -25oC ± 2oC in air and then warmed to 5oC ± 2oC in water. They found that the specimens with silica fume, both non-air-entrained and air-entrained, performed very poorly with their durability factors being reduced to less than 40% in 50 and 100 cycles of freezing and thawing respectively. After 250 cycles of freezing and thawing, the non-air-entrained specimens without silica fume achieved an average durability factor of 60%, but the air-entrained specimens without silica fume showed no deterioration at all. It was concluded that the very poor performance of the specimens was probably due to the high void spacing factor because of very high silica fume content, even though the air-entrained specimens had 5% air in the fresh state. The freeze-thaw resistance of both air-entrained and non-air-entrained concretes was also investigated by Kashi and Weyers [1989]. They tested specimens from 27 batches of high-strength concrete containing silica fume with W/CM ratios of 0.25 and 0.32, and with and without entrained air. The tests were conducted in accordance with ASTM C 666, Procedure A. Another set of similar specimens were moist cured for 28 days instead of 14 days to determine the effect of curing time. The results showed that non-air-entrained high-strength concrete with W/CM ratio of less than 0.30 was frost resistant regardless of the length of curing time. Non-air-entrained high strength concrete with W/CM ratio of 0.32 was durable if silica fume was not used. Li et al. [1994] investigated the freezing and thawing (F/T) durability of non-air-entrained cement pastes, mortars, and concrete. The test specimens (with four different W/C ratios of 0.24, 0.27, 0.30, 0.33) were cured in 95 ± 3% relative humidity and a temperature of 23oC ± 1oC until testing at 14, 28, or 90 days. Freezing and thawing was performed according to ASTM C 666, Procedure A. The F/T durability of non-air-entrained pastes and mortars was evaluated by measuring the decrease in compressive strength, but the F/T durability of non-air-entrained concrete was determined by the method of ASTM C 666, Procedure A. For comparison purposes, the relative dynamic modulus of the mortar was also measured. At the W/C ratio of 0.24, both the paste and mortar showed excellent F/T resistance at 0, 5, and 10% silica fume levels. When the W/C ratio was higher than 0.24, the paste and mortar durability was significantly reduced. Similarly, at the W/C ratio of 0.24, the non-air-entrained concretes were F/T durable regardless of the silica fume and total cementitious content but the durability was decreased for concretes with higher W/C ratios. The results indicated that factors other than the W/C ratio had little influence on the F/T durability and the critical W/C value was 0.24. The damage in the paste was characterized by surface scaling while in the mortar and concrete a few large cracks led to final failure. [Authors' Note: The research described by Li et al. covers only non-air-entrained pastes, mortars, and concretes, in spite of the misleading title of their publication.] The F/T durability of non-air-entrained high-strength concrete with a constant W/CM ratio (0.35) and a fixed amount of silica fume (10 % by weight of cement) was investigated by Cohen et al. [1992] to evaluate the effects of the duration of curing in saturated lime-water for 7, 14, 21, and 56 days prior to the freezing and thawing cycles. The aggregates used in the investigation were frost resistant. Therefore, the failure of the non-air-entrained concrete specimens could be attributed only to cracking of the paste. It was found that silica fume modified the frost resistance mechanism of the paste in the concrete. All specimens failed when tested according to the ASTM C 666, Procedure A, using 60% relative dynamic modulus as the failure criterion. The test data suggested the possible existence of a critical curing period of 14 to 21-day in saturated lime-water, which was associated with the largest gains in length and mass, the largest drops in bulk density and compressive strength, and the lowest number of cycles to failure (or lowest durability factor). There were some improvements to the frost resistance properties when the duration of curing was decreased to 7 days or increased to 56 days, but the improvements were insufficient for the concrete to meet the standard test requirements. An interesting observation was made in that the induced damage to the concrete after 300 cycles of freezing and thawing was indicated primarily by a significant drop in the dynamic modulus (from 6.5-million psi to 300,000 psi) rather than a major reduction in compressive strength (with highest compressive strength of 11,000 psi at 0 cycle and lowest strength of 8,000 psi after 300 cycles). The researchers concluded that while an explanation for this phenomenon requires further study of the microstructure, it appears clear that the concrete deterioration process during the freezing and thawing cycles had reached a stage that the normal relationship between the compressive strength and the modulus could no long hold true. Pigeon et al. [1991] also attempted to determine the influence of various parameters on the limiting value of W/CM ratio below which air entrainment is no longer required for good freezing and thawing resistance. Seventeen high-strength concretes were made using portland cement with and without silica fume, and tested for frost resistance according to ASTM C 666, Procedure A. The parameters included the type of cement, the type of aggregate, and the length of the curing period. The test results, along with previously published data, indicated that the limiting value of W/ CM ratio could be higher than 0.30 in certain cases, but equal to or less than 0.25 in others, depending particularly on the characteristics of cement. They suggested that more research is needed before the values can be used as guidelines, since field exposure conditions differ substantially from laboratory testing conditions, and because the air void spacing factor of non-air-entrained field concretes could be significantly higher than that of laboratory made concretes. It is interesting to note that Burg and Ost [1992] tested five commerically available non-air-entrained high-strength concretes for their freeze-thaw resistance. The W/CM ratios of the five concrete mixes ranged from 0.22 to 0.29, their 28-day compressive strengths of moist cured 150 x 300 mm (6 x 12 in.) cylinders ranged from 11,400 psi (80 MPa) to 17,250 psi (121 MPa), and their silica fume contents ranged from 0 to 16%. Out of the five concretes, only the one with the highest strength, the lowest W/CM ratio, and the largest amount of silica fume sustained the freezing-thawing test without deterioration for over 1,400 cycles. The other four concretes all failed to meet the requirements of ASTM C 666, Procedure A. In lieu of silica fume, high-reactivity metakaolin has been found as an effective mineral admixture to produce high-strength concrete with good freeze-thaw resistance [Caldarone et al. 1994]. In the past several years, there has been an increasing interest in using large quantities of fly ash or GGBS to produce high performance concrete. The durability of such concrete becomes an important issue since these mineral admixtures are often used to replace a major portion of the portland cement in the concrete. A series of recent studies reported in Canada [Langley et al. 1989; Malhotra 1989; Malhotra and Painter 1989; Malhotra 1990; Bilideau et at. 1994; Bilodeau and Malhotra 1994] showed that air-entrained high-volume fly ash concrete exhibited excellent frost resistance based on the ASTM C 666, Procedure A test. The performance of the concrete was also very good against chloride-ion penetration based on the AASHTO T 277 test. The only exception was the deicing salt-scaling test (ASTM C 672) in which the performance of the concretes investigated was less than satisfactory. The concrete mixes contained class F fly ash (about 56% of the total cementitious materials and W/CM of 0.30) or GGBS (up to 50% of the total cementitious materials and W/CM of not more than 0.55) with roughly 4 to 6% entrained air and a large dosage of superplasticizer for good workability. On the other hand, using class C fly ash, Nasser and Lai [1993] found that the use of high percentage of fly ash in concrete (35 to 50%) reduced its resistance to freezing and thawing even though it contained about 6% air and was cured in water for 80 days. However, concrete containing 20% fly ash gave satisfactory performance if its air content and strength were comparable to control concrete which contained no fly ash. Several recent studies on the freeze-thaw durability of air-entrained concrete for marine and arctic construction have been conducted. Moukwa et al. [1989] tested concrete with W/C = 0.44 and 4% air in both fresh and seawater. Two laboratory procedures were used, one simulating the field freeze-thaw conditions the concrete undergoes in the tidal zone and the other similar to ASTM C 666, Procedure A. The results of the study suggested that surface effects would probably play an important role in the deterioration of concrete under arctic conditions. Whiting and Burg [1991] tested high-strength lightweight concretes produced from two different lightweight aggregate sources subjected to a variety of freezing and thawing test procedures and conditioning methods. The concrete strengths ranged from 54 to 73 MPa (7,700 to 10,400 psi) and their unit weight varied from 1,920 to 2080 kg/m3 (120 to 130 lbs/ft3). Silica fume, fly ash, and GGBS were used in the different mixtures. The high-strength lightweight concretes exhibited excellent performance with virtually no degradation during the standard freeze-thaw testing. Prolonged exposure was needed to cause significant damage under simulated arctic offshore conditions. Durability was found to be a strong function of cumulative freezing and thawing cycles and moisture content, with saturation of aggregates prior to test leading to premature failure. In a separate study, Tamura and Tazawa [1991] developed a new mixing procedure in which the lightweight coarse aggregate and 50% of the cement (plus fly ash or silica fume) were mixed first for one half of a minute with 50% of superplasticizer plus a portion of the water to make the W/CM = 0.15. The remaining half of the cementitious materials was then added and mixed for another half of a minute. The fine aggregate (sand) was then added to the mixer at the one minute mark and mixing continued for another half of a minute. At the 1-1/2 minute mark, all the remaining water and superplasticizer were added to the mixer and mixing continued untile it was complete at the 3-minute mark. This mixing procedure allowed the lightweight coarse aggregate to be enveloped first with relatively soft cement paste and then the second addition of cement absorbed the water from the first cement paste coating to ensure a stronger enveloping action. The proposed mixing procedure proved to be most effective in enhancing the freeze-thaw resistance of high-strength lightweight concrete studied. In addition, they study also indicated that there was a close relationship between the water content in the lightweight aggregate before mixing and the resistance to freezing and thawing. For the high-strength lightweight concrete containing fly ash with its air content of 7 to 8%, it was desirable to adjust the water content in the lightweight aggregate to no more than 8%. For the concrete with silica fume, adequate freeze-thaw resistance was obtained even with a water content of 14% in the lightweight aggregate. To better control water absorption into the lightweight aggregate under high pumping pressure, Asai et al. [1994] developed a new lightweight coarse aggregate with its surface being coated by a high molecular paraffin. The coated aggregate made it possible to produce lightweight concrete with high durability against freezing-thawing, abrasion, and fire. Scaling is another problem of durability. It is caused by repeated application of deicing salts. Concrete surface damaged by salt scaling becomes roughened and pitted as a result of spalling and flaking of small pieces of mortar near the surface. Even high–quality concrete with adequate air entrainment can still suffer scaling by deicing chemicals. The exact cause of scaling is not well understood but it is recognized that when deicing chemicals are applied to melt ice, the heat consumption causes a rapid drop in the temperature of the concrete just below the surface resulting in damages from the effects of rapid freezing or differential thermal strains. Furthermore, deicing chemicals can accumulate in the surface layer of the concrete, forming relatively concentrated solutions. When water stays on the concrete surface, it flows towards the concentrated chemical solution causing an osmotic action accompanied by hydraulic pressures. These pressures may, in turn, cause salt scaling. Scaling is most likely to occur where there is a weak layer of paste or mortar at or near the concrete surface. The best prevention of scaling is to eliminate the weak layer of material by proper mix design and good construction practice in placing, finishing, and curing. Over vibration, too much trowelling, and excessive bleeding should all be avoided. Well cured concrete pavements, allowed to dry for a period before deicing salts are applied, generally will have good scaling resistance. Earlier studies on the scaling resistance of concrete containing silica fume and using Pyrament blended cement have been summarized in the previous state-of-the-art report [Zia et al. 1991]. It was concluded that based on the available research results curing history and moisture condition are important factors to field performance which can not be accounted for by the standard ASTM test procedures. Thus a need exists for new test procedures that will take into account these factors. More recently, the deicer salt scaling resistance of high-strength concretes made with different cement was studied by Gagne et al. [1991]. Seventeen concrete mixtures were prepared with W/CM = 0.26 and 0.30, which produced high-strength concretes with a 28-day strength in the range of 60 to 90 MPa (8,600 to 12,860 psi). For W/CM = 0.26, Type I cement plus 6% silica fume was used. For W/CM = 0.30, two types of cement and a silica fume were used ( Type III, Type III + 6% silica fume, Type I + 6% silica fume). Using sodium chloride as a deicer, all specimens were subjected to 150 daily cycles of freezing and thawing in accordance with ASTM C 672. After 50 cycles, the weight loss for all concretes was lower than 0.75 kg/m2 and after 150 cycles the weight loss was under 2 kg/m2. No clear relationship was found between the scaling resistance and the spacing factor. The test results, along with others, indicated that non-air-entrained high-strength concretes with good deicer salt scaling resistance could be produced with a portland cement plus silica fume and good quality coarse aggregate by using a W/CM of 0.30, even after only 24 hours of curing. With certain Type III cement, it is also possible to produce scaling resistant concrete with air entrainment and silica fume. In their study of non-air-entrained concretes, Li et al. [1994] also found no salt scaling, after 50 cycles of testing, for concretes with W/CM of either 0.24 or 0.27, but some scaling was observed for the specimens with W/CM = 0.30 and the specimens with W/CM = 0.33 suffered severe scaling. After 100 cycles of testing, the specimens with W/CM = 0.27 showed some scaling while those with W/CM = 0.24 still showed no sign of scaling. In lieu of silica fume, high–reactivity metakaolin has also been used as an effective mineral admixture for high-strength concrete which proved to have satisfactory performance in scaling resistance [Caldarone et al. 1994]. The effect of curing and drying on salt scaling resistance of fly ash concrete was investigated by Bilodeau et al. [1991]. Concretes with 20 and 30% fly ash as cement replacement were produced with two types of aggregate, using W/CM of 0.35, 0.45, and 0.55. The test results showed that, with few exceptions, concrete with up to 30% fly ash performed well under the scaling test. Extended moist-curing or dry periods did not seem to affect significantly the scaling performance of the reference concrete as well as the fly ash concrete. However, when higher volume of fly ash (55 to 60%) was used in air-entrained concrete, the scaling performance of the concrete was less than satisfactory [Bilodeau et al. 1994]. Abrasion is wearing due to repeated rubbing and friction. For pavements, abrasion results from traffic wear. Adequate abrasion resistance is important for pavements and bridge decks from the standpoint of safety. Excessive abrasion leads to an increase in accidents as the pavement becomes polished reducing its skid resistance. There is no generally accepted criterion for evaluating the abrasion resistance of conventional concrete. The lack of an abrasion resistance criteria is due to the fact that surface wear normally is not a controlling factor in pavement performance. If the pavement surface is provided an adequate texture depth during construction, its design is dictated by other requirements. An exception is in areas where the use of studded tires is permitted. Abrasion resistance of concrete is a direct function of its strength, and thus its water-cement ratio and constituent materials. High quality paste and strong aggregates are essential to produce an abrasion resistant concrete. The superior performance in abrasion resistance of concretes made with Pyrament blended cement was summarized in the previous state-of-the-art report [Zia et al. 1991]. Unfortunately, Pyrament cement is no longer being produced and not available to the construction industry. The use of silica fume high-strength concrete with low W/C ratio for the repairs of abrasion-erosion damage of in the stilling basin at Kinzua Dam and in the concrete lining of the low-flow channel, Los Angeles River was described by McDonald [1989]. It was shown that silica fume offers potential for improving many properties of concrete which are particularly beneficial in repair of hydraulic structures. The experimental work on the abrasion resistance of concrete pavements subjected to heavy traffic from studded tires was discussed in a paper by Gjorv et at. [1990]. Their test results indicated that if the concrete strength were increased from 50 MPa (7,200 psi) to 100 MPa (14,400 psi), the abrasion of the concrete would be reduced roughly by 50%. At 150 MPa (21,600 psi), the abrasion of the concrete was comparable to that of high quality massive granite. When compared with a high quality asphalt pavement, the abrasion resistance of the very high-strength concrete represents an increase in the service life of the pavement by a factor of nearly ten. A unique piece of equipment, called TEREDO, for in-situ assessment of abrasion resistance of concrete has been developed by researchers at University of Belfast, Northern Ireland [Montgomery et al. 1989]. It is designed for accelerated abrasion test by using rotating wheels. Three sets of spiked steel dressing wheels are mounted on radial arms around a central spindle rotating at a constant speed of 50 rpm by a small DC motor with a variable speed control. The central shaft is attached to a center-hole jack allowing a force to be applied to the spindle through the jack, thus enabling the rotating wheels to abrade the surface. The machine is so designed that the dressing wheels will follow the contours of the test surface, including any peaks and troughs formed by its abrading action. The depth to which the test surface has been abraded is measured at 8 points along the abraded annular path after 15 minutes of operation. This recorded depth is used as a measure of the abrasion resistance of the surface. The investigation into the sensitivity of the apparatus to the variables of concrete mixes indicated that TEREDO produces test results which relate to the strength of the concrete. Therefore, correlations can be established between the measured abrasion depth and water/cement ratio, curing regime, and the method of surface finish. Laplante et al. [1991] conducted an experimental program using the ASTM C 779 test method to determine the abrasion resistance of concrete with silica fume addition, W/CM ratio, and coarse aggregate type as variables. They found that coarse aggregate was the most important factor, followed by W/CM ratio in rank, affecting the abrasion resistance of concrete. The abrasion resistance of concrete is strongly influenced by the relative abrasion resistance of its mortar and coarse aggregate. When the coarse aggregate and mortar have nearly the same abrasion resistance, the surface wear of the concrete would be fairly uniform and the concrete can present serious skidding and slipping problems when wet. When the W/CM is very low, it can make the concrete almost as abrasion resistant as high-performance rocks. Also using the ASTM C 779 test method, Dhir et al. [1993] conducted a study to investigate the abrasion resistance of concrete as affected by the curing method (water vs air), length of curing, variable workability, and variable maximum aggregate size. By measuring also the initial surface absorption (ISAT) at the 10-minute mark, a linear correlation was established between the abrasion of concrete and its initial surface absorption at 10 minutes, see Fig. 4.20. Abrasion resistance of high-strength concretes containing chemical and mineral admixtures was investigated by de Almeida [1994]. Ten concrete mixtures were evaluated for their abrasion resistance according to a Portuguese Standard, which is similar to the Brazilian Standard and the German Standard DIN 52108, using the Dorry apparatus, Fig. 4.21. The compressive strength of the concrete varied from 60 to 110 MPa (8,700 to 15,950 psi) at 28 days, and the W/CM varied from 0.24 to 0.42. The concrete mixtures contained silica fume, fly ash or natural pozzolan, with or without a superplasticizer, with workability being kept constant, Fig. 4. 22. From the test results, it was concluded that the abrasion resistance of concrete generally varies inversely with the W/CM ratio (see Fig. 4.23), the porosity, and the cement paste volume in the concrete. Therefore, by using superplasticizer to reduce substantilly the W/CM ratio, the abrasion resistance of concrete would be improved considerably. Introducing mineral admixture without using superplasticizer would reduce the abrasion resistance of concrete since more water would be needed to maintain a constant workability. It is noted that the results of the study should be applied to high-strength concrete mixtures only. However, even the least abrasion resistant concrete produced in the study resulted in surface wear that was only 17% of ordinary concrete. It is worth noting that Fwa [1989] developed a laboratory test procedure for cyclic wetting and drying to simulate the weathering effects of Singapore's climate on the wearing resistance of concrete pavements. Tests were conducted with a rotating drum on plain cement mortar specimens with and without weathering treatment. While no direct correlations were established between his test data and the field performance of in-service pavements, the test results did suggest that the test procedure could be useful for evaluation of the relative surface wear resistance of concrete pavement. Abrasion resistance of concrete including rather high volumes of Class C fly ash (50% and 70% replacements of cement) was investigated by Naik et al. [1994]. A reference portland cement concrete was proportioned to produce 28-day strength of 41 MPa (5,950 psi). Abrasion tests were conducted by using the rotating cutter method of ASTM C 944. All the specimens made either with or without fly ash passed the abrasion resistance requirements of ASTM C 779, Procedure B. An accelerated test method, using the rotary cutter device having dressing wheels equipped with smaller size washers, was developed. A measured amount of standard Ottawa sand was added to the surface being abraded at one minute intervals. The results of the accelerated test showed lower abrasion resistance for high–volume fly ash concrete systems relative to no-fly ash concrete. Traditionally, interest in the strength and other properties of concrete has been focused on those at 28 days and beyond. In the past several years, there has been an increasing interest in the strength and other properties of concrete at ages less than 28 days. There are at least three factors which have contributed to this increased interest in early strength: (1) the fast-paced construction schedules that expose concrete to significant structural loads at early ages, (2) the development of specialty cements or admixtures which enable the achievement of higher strength at early ages, and (3) the recognition that long-term performance of concrete is greatly affected by its early-age history. At the present time, there is no generally accepted definition of early strength. Any strength measured at ages less than the standard 28 days is regarded as early strength. Since the properties of concrete depend closely on the degree of cement hydration, one definition of early strength could be the strength at the age corresponding to 50% hydration of cement. For concrete made with ordinary portland cement (ASTM Type I) and cured at a standard temperature of 20oC, approximately 50% of the cement will hydrate within 3 days. In an Engineering Foundation Conference on Properties of Concrete at Early Ages [Carino et at. 1989], it was recommended that the early age could possibly be defined as the period during which the properties of concrete undergo rapid change. A total of seventeen papers were presented in the Engineering Foundation Conference. The papers covered various topics including the following:
The Conference presented four principal recommendations: (1) the influence of cement paste microstructure on long-term performance of concrete and the effects of early-age history on microstructure need to be understood; (2) codes and standards need to address concrete at early ages; (3) the importance of controlling the temperature rise in structures during early ages needs to be understood and methods for such control need to be implemented; and (4) increased efforts in education and technology transfer are required. A classical study by Klieger on high early strength concrete with Type I and Type III cements and the later developments of Pyrament blended cement and Regulated Set cement have been summarized by the authors in the previous report [Zia et al. 1991]. In the past few years, a number of valuable researches have been reported in the literature. Chengju [1989] compared various expressions for maturity of concrete with special regard to the influence of temperature. Various maturity functions and strength-maturity equations were reviewed by comparing with published data, and a parabolic maturity function was proposed. Also reviewed were the principle and performance of a commercial maturity meter, which is based on the evaporation of liquid. It was concluded that the maturity concept may serve as an effective means of predicting the early-age strength of in-situ concrete in spite of its inherent limitations. Under the SHRP C-205 contract, Zia et al. [1993c, 1993d], developed mixture proportions of two options of very early strength (VES) and high early strength (HES) concretes using four different types of aggregates. Option A of VES concrete, using Type III cement, melamine-based superplasticizer, air entrainment agent, and calcium nitrite as accelerator, achieved a minimum compression strength of 14 MPa (2,000 psi) in 6 hours with W/C of 0.40. Option B of VES concrete, using a proprietary blended cement (Pyrament PBC-XT) without any other admixtures, achieved a minimum compressive strength of 17.5 MPa (2,500 psi) in 4 hours with W/C of 0.23. Both concretes were insulated immediately after casting in order to preserve the heat of hydration so as to speed up the maturity of the concrete. HES concrete, also using Type III cement, naphthalene-based superplasticizer, air entrainment agent, and calcium nitrite as accelerator, achieved a minimum compressive strength of 35 MPa (5,000 psi) in 24 hours with a W/C of less than 0.35 and without insulation. Sections of test pavements, as full-depth full-lane replacement or new construction, were installed in Arkansas, Illinois, Nebraska, New York, and North Carolina to evaluate the constructibility and long-term performance of HES concrete. Some of the pavements were insulated to mimic VES concrete. Satisfactory results were obtained from the field experiments. Following the work of Zia et al., Whiting and his colleagues conducted field studies of full-depth pavement replacedments and bridge deck overlays for early opening of repaired highways (from 4 to 24 hours) in Georgia, Ohio, and Kentucky under SHRP C-206 contract. In a series of papers [Nagi et al 1994; Nagi et al. 1995; Whiting and Nagi 1994; Whiting et al. 1994], they reported the performance of 11 different concrete mixtures used for pavement repairs and 3 different concrete mixtures for bridge deck overlays. A variety of tests were performed including determination of water content by microwave drying, temperature development in test slabs, early strength gain predictions, long-term strength gain and elastic moduli, as well as durability testing. Usually more than one test methods were applied in each performance test. Based on these extensive field studies, they concluded that (1) concretes used for early highway opening applications showed a high rate of early strength gain and developed considerable heat during the first few hours after placement, (2) a variety of methods can be used to predict in-place strength gain of concretes designed for early highway opening applications, (3) most of the early opening mixtures continued to gain strength after placement up to a period of at least 90 days (the longest test period included in the study), and (4) questions still remained regarding durability of concretes designed for early opening applications. There were indications that microcracking in the concretes, possibly caused by thermal effect, may account for some of the poor performance in freeze-thaw testing. The use of calcium chloride should be avoided, as it contributes to reduced freeze-thaw resistance. Another interesting and successful field application of high performance concrete was described by Lessard et al. [1994]. To accelerate the traffic reopening in 24 hours, and to minimize the loss of customers and revenue, high performance concrete was used for a routine concrete sidewalk at the entrance of a McDonald's restaurant. The air-entrained concrete was designed to have a compressive strength of 20 MPa (3, 000 psi) in 24 hours and achieved a compressive strength of 69 MPa (10, 000 psi) in 28 days. Economic comparisons indicated that the cost of the sidewalk using the high performance concrete was 16% over the cost of a 30 MPa (4,400 psi) normal concrete sidewalk. To achieve early compressive strength, an accelerator is usually used in the concrete mix. Rear and Chin [1990] evaluated the performances of three commercially avialable non-chloride accelerating admixtures with five different Type I and Type I/II portland cements, two different Class C fly ashes and two different Class F fly ashes. Their test results showed that the three accelerating admixtures were all effective in increasing early compressive strength with both cement and cement-fly ash combinations. However, the range of performance with different cements, fly ashes, and addition rates points out the importance of testing with local materials to determine the most effective combination. Early strength development of concrete containing high volume of fly ash has also attracted the attention of several investigators recently. Malhotra and Painter [1989] tested three series of specimens for early-age strength and freezing-thawing resistance. The cement content was kept constant at 145 ± 5 kg/m3 while the amount of Class F fly ash varied from 43% to 65% of the total cementitious materials. The W/CM varied from 0.28 to 0.42 and the air content varied from 4.0 ± 0.5% to 9.5 ± 1.0%. The strength properties of the concrete were determined at ages up to 91 days, and the freezing and thawing tests were conducted according to ASTM C 666, Procedure A. The test results showed that the compressive strength of the concrete increased with decreasing W/CM ratio and with increasing amounts of fly ash. The optimum amount of fly ash was about 58% of the total cementitious materials. The concretes investigated showed adequate early-age strength and satisfactory freezing-thawing resistance, but the test specimens suffered moderate to considerable surface scaling. Naik and Ramme [1990a, 1990b] described their studies of using Class C fly ash to replace a part of cement in the concrete produced in precast/prestressed concrete plants. The objective was to develop optimum mixture proportions for producing high early strength concrete with high fly ash contents. It was found that fly ash replacement improved workability, decreased water demand, and increased strength while maintaining the high early strength of 34 MPa (5,000 psi) requirements of precast/prestessed concrete operations. Hammons and Smith [1990] examined the development of compressive strength and modulus of elasticity of concrete mixtures containing Class C fly ash in the amount of 25% to 50% of the total cementitious materials from one and one-half hours after final set to 14 days. Sarkar et al. [1991] observed a sudden upsurge of mechanical strength at 12 hours in a silica fume/fly ash high-strength concrete and the cause for the sudden upsurge of strength was investigated and the microstructural characteristics of the concrete was determined. The concrete was subject to progressive hydration from 1 to 91 days. It was suggested that the early increase in strength in a silica fume/fly ash concrete might be explained by the dissolution of a certain amount of K2O from the surface of a substantial number of fly ash particles in very early stage of hydration. In contrast, silica fume concrete (without fly ash) with identical cement, aggregates, and W/C did not develop such high early strength, though the trend was reversed from age one day. Special cements and binder materials are often used to achieve eary concrete strength for special applications. Pyrament cement was used for runway repair at Yeager Airport inCharleston, West Virginia [Anon. 1990]. An extensive study of concretes made with Pyrament cement was conducted by Husbands et al. [1994], and a comparative evaluation of Pyrament cement and two other rapid-setting materials (Set 45 and Silikal R17AF) for rapid runway repair was performed by Wakeley et al. [1991]. In both studies, excellent performance of Pyrament cement as a binder was identified. Unfortunately, the producer of Pyrament cement suspended its production and the material is no longer available to the transportation industry. 4.6 Interrelationships of Properties Many of the mechanical properties of concrete discussed in the previous sections are interrelated and their relationships are expressed in quantitative terms. Some of the properties, however, may also be linked indirectly even though their relationships cannot be established explicitly. In the previous report [Zia et al. 1991], four interrelationships of properties were discussed. They included the relationship between strength and strain capacity, between strength and permeability, between fatigue and tensile strain capacity, and between fatigue and permeability. The authors are not aware of any significant developments in this topical area in the past few years. 4.7 References
Tables & Figures
Table 4.2
Table 4.3
Table 4.4
Figure 4.1 The effect of the aggregate type on compressive strength
Figure 4.2 Variation of compressive strength of HPC with time
Figure 4.3 Confined capping apparatus for compressive strength testing of HPC cylinders
Figure 4.4 Vertical cross-section of a cylinder with prepared confined cap at both ends
Figure 4.5 Average compressive strength of cylinders relative to strength of standard 150 x 300 mm cylinders with ground ends
Figure 4.6 Stress-strain curves of high-strength concrete specimens under direct tension before and after 700 cycles of freezing and thawing
Figure 4.7 Relationship between splitting tensile strength and compressive strength of HPC
Figure 4.8 Relationship between modulus of rupture and compressive strength of HPC
Figure 4.9 Modulus of rupture versus compressive strength of cylinder
Figure 4.10 Splitting tensile strength versus compressive strength of cylinder
Figure 4.11 Three types of bond strength test: (a) slant shear test; (b) direct shear test; (c) direct tensile test
Figure 4.12 Three types of shear test and their loading arrangements (dimensions in mm)
Figure 4.13 Figg's method for permeability measurement Figure 4.14 Schonlin & Hillsdorf's air permeability test
Figure 4.15 Leeming's air permeability test setup
Figure 4.16 Whiting & Cady's air permeability test apparatus
Figure 4.17 Autoclam apparatus for permeability tests
Figure 4.18 ISAT test apparatus
Figure 4.19 Roy's test setup for transient permeability measurement
Figure 4.20 Relationship between depth of abrasion and the ISAT-10 reading
Figure 4.21 Schematic view of Dorry apparatus also known as Amsler-Lafond apparatus
Figure 4.22 Abrassive wear of 10 different concrete mixtures tested by de Almeida
Figure 4.23 Correlation between abrassive wear (Aw) and water-cement ratio
|
|||||||||||||||||||||||||||||||||||||||||||||||||||||||||||||||||||||||||||||||||||||||||||||||||||||||||||||||||||||||||||||||||||||||||||||||||||||||||||||||||||||||||||||||||