U.S. Department of Transportation
Federal Highway Administration
1200 New Jersey Avenue, SE
Washington, DC 20590
202-366-4000
Federal Highway Administration Research and Technology
Coordinating, Developing, and Delivering Highway Transportation Innovations
 |
 |
| This presentation is an archived publication and may contain dated technical, contact, and link information |
|
Long-Term Bridge Performance Program |
PowerPoint Version (2,390 kb)
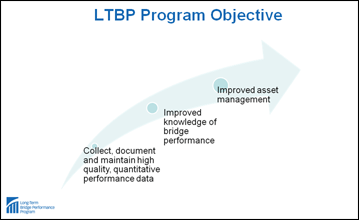
FHWA Long-Term Bridge Performance Program
Designated in the "SAFETEA-LU" surface transportation authorization legislation as a 20-year research effort to improve our knowledge of bridge performance
Funding is currently only authorized through FY-2009
Challenges!
FHWA's Perspective
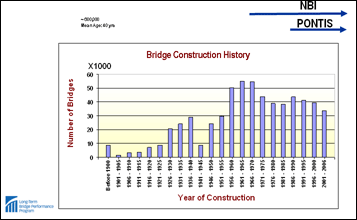
1) Aging bridge population - performance poorly understood
2) Currently available data will not support desired performance assessments
3) LTBP Program is essential to understanding, improving bridge performance
LTBP program should,
a.) Focus on most common bridges
b.) Serve FHWA and stakeholder needs
c.) Not burden bridge owners with new requirements
d.) Encourage international cooperation
State DOTs' Perspective
1) Available road and bridge funds have leveled off or decreasing
2) Key material prices escalating beyond inflation rate
3) Traffic Volume and load demands growing rapidly
4) Demand and expectations from users of the system will continue to grow
5) Eliminating deficient bridges
LTBP program should,
a.) Help States meet challenges
b.) Set data protocols
c.) Focus on practical, useful data
d.) Take advantage of sensing technology
Research Community's Perspective
Availability and quality of data will affect the degree of uncertainty in assessing bridge performance, developing deterioration models and performing LCC analysisUncertainty in data is
Aleatory- that is the inherent randomness or variability in the data
Epistemic- that is the lack of sufficient knowledge or the inability to predict or estimate the desired data correctly
Bridge Performance
Challenges in Measuring Bridge Performance
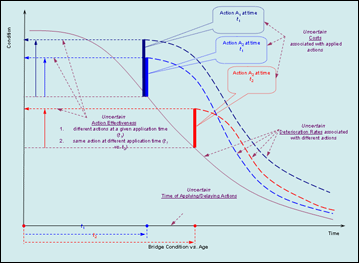
Measuring Performance
Moving Target!
Stewardship and Management
Anticipated Impacts of the LTBP Program
Vision
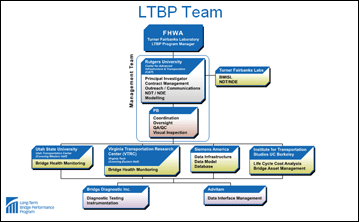
LTBP Team
Project Lead and Administrator
Principal Industry Partner
|
Academic Partners
Industry Partners
Special Consultant
|
Concluding Remarks
Concluding Remarks Continued....
LTBP Program Web site
www.fhwa.dot.gov/research/tfhrc/programs/infrastructure/structures/ltbp/
Hamid Ghasemi, Ph.D., Program Manager
LTBP Program
Hamid.ghasemi@dot.gov
202-493-3042
Ali Maher, Ph.D., Principal Investigator
Mmaher@rci.rutgers.edu
Thank You!
QUESTIONS OR COMMENTS
PowerPoint files can be viewed with the PowerPoint Viewer

