U.S. Department of Transportation
Federal Highway Administration
1200 New Jersey Avenue, SE
Washington, DC 20590
202-366-4000
Federal Highway Administration Research and Technology
Coordinating, Developing, and Delivering Highway Transportation Innovations
 |
| This techbrief is an archived publication and may contain dated technical, contact, and link information |
|
Publication Number: FHWA-HRT-08-046
Date: March 2008 |
|||||||||||||||||||||||||||||||||||||||||||||||||||||||||||||||||||||||||||||||||||||||||||||||||||||||||||||||||||||||||||||||||||
Safety Evaluation of Center Two-Way Left-Turn Lanes on Two-Lane RoadsFHWA Contact: Roya Amjadi, This document is a technical summary of the Federal Highway Administration report, Safety Evaluation of Center Two-Way Left-Turn Lanes on Two-Lane Roads, FHWA-HRT-08-042. PDF Version (1.12 MB)
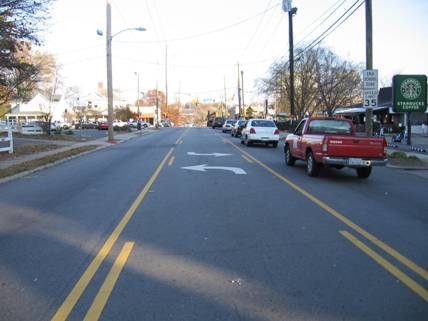
PDF files can be viewed with the Acrobat® Reader® OBJECTIVEThe Federal Highway Administration (FHWA) organized 26 states to participate in the FHWA Low-Cost Safety Improvements Pooled Fund Study as part of its strategic highway safety plan support effort. The purpose of the study is to evaluate the safety effectiveness of several low-cost safety improvement strategies through scientifically rigorous crash-based studies. One of the strategies evaluated for this study was the installation of center two-way left-turn lanes (TWLTLs) on two-lane roads. This strategy is intended to reduce the frequency of head-on crashes and rear-end crashes involving a turning vehicle. The safety effectiveness of this strategy has not been thoroughly documented previously; therefore, this study is an attempt to provide an evaluation of TWLTLs through scientifically rigorous procedures. IntroductionCrashes on two-lane, undivided roadways accounted for 1.9 million (39 percent) crashes in 2005 in the United States.(1) The majority of fatal crashes on two-lane roads occur at nonintersection locations. According to the Fatality Analysis Reporting System (FARS), of the 29,323 fatal crashes that occurred in 2005 on two-lane roads, 22,173 crashes (over 75 percent) occurred at nonintersection locations. This accounts for over 56 percent of the total 39,189 fatal crashes that occurred in 2005.(2) In addition, rear-end crashes accounted for 1.8 million (about 30 percent) of the crashes that occurred in 2005,(1) and 75 percent of all rear-end crashes involve a vehicle that is either stopping or has already stopped.(3) TWLTLs have been used to reduce rear-end, head-on, and turning-related crashes occurring on two-lane roads. An example of a TWLTL in North Carolina is provided in figure 1. This strategy may reduce turning-related crashes because vehicles are removed from the primary travel lane while drivers wait for an acceptable gap to turn. TWLTLs may also reduce head-on collisions by providing a buffer between opposing directions of travel, as discussed in the National Cooperative Highway Research Program's NCHRP Report 500 Volume 4: A Guide for Addressing Head-On Collisions.(4) The NCHRP guide concludes that this strategy cannot be considered a proven strategy because there were no valid estimates of the effectiveness of such conversions based on pertinent before-after studies for two-lane roads. The one limited Ohio study,(5) completed after the NCHRP guide was published, is credible but is based on a limited dataset. More studies are needed to substantiate these and other evaluations for the strategy to be confidently and efficiently implemented for maximum cost effectiveness.
Figure 1 . Example of TWLTL in North Carolina. MethodologyData were collected from several States that had installed TWLTLs on two-lane roads. Study locations were selected from Arkansas, California, Illinois, and North Carolina based on the availability of installation data, including location and installation date. Geometric, traffic, and crash data were obtained for a total of 530.2 km-years (329.3 mile-years) in the before period (95.8 km-years (59.5 mile-years) from Arkansas, 90.7 km-years (56.3 mile-years) from California, 36.4 km-years (22.6 mile-years) from Illinois, and 307.3 km-years (190.9 km-years) from North Carolina) and 407.2 km-years (252.9 mile-years) in the after period (127.8 km-years (79.4 mile-years) from Arkansas, 52 km-years (32.3 mile-years) from California, 20.8 km-years (12.9 mile-years) from Illinois, and 206.6 km-years (128.3 mile-years) from North Carolina). Mile-years are the number of miles of roadway on which the strategy was applied multiplied by the number of years the strategy was in place. Geometric, traffic, and crash data were also obtained for reference sites with characteristics similar to the strategy sites in all four States. Empirical Bayes (EB) methods were incorporated in a before-after analysis to determine the safety effectiveness of TWLTLs on two-lane roads. The EB methodology for observational before-after studies(6) was used for the evaluation. Safety performance functions (SPFs) were calibrated separately for each State for use in the EB methodology. Generalized linear modeling (GLM) was used to estimate the model coefficients using the software package SAS®.(7) A negative binomial error distribution was assumed for the GLM which is consistent with the state of research in developing these models. SPFs were estimated for the following crash classifications:
The full report includes a detailed explanation of the methodology, including a description of how the estimate of percent reduction is calculated. ResultsTwo sets of results were calculated and are presented in the following sections. One set contains aggregate results for the four States combined. The other set is based on a disaggregate analysis that attempts to discern factors that may impact the safety effectiveness of this treatment. Aggregate AnalysisThe aggregate results shown in table 1 present data for all four States combined with crash types of which rigorous analysis was possible. The results are statistically significant at the 95-percent confidence level. The results are generally favorable, especially for rear-end crashes with an estimated reduction of 38.7 percent. For other crash types not presented in table 1, the available data does not facilitate a rigorous aggregate analysis. Preliminary analyses for head-on crashes and for differences between intersection and nonintersection crashes support the decision to not present results for those crash types, primarily due to small sample sizes. Separate results for each State were also calculated and are presented in the full report.
Disaggregate AnalysisThe disaggregate analysis attempted to discern factors that may impact the safety effectiveness of installing on two-lane roads. Other than road environment, the results do not suggest definitive evidence of such factors. The separate results for urban and rural environment installations are reported in table 2. For all States, rural installations tend to be are more effective than for urban ones; the difference is highly significant, except for Illinois.
*These negative effects are highly insignificant. Note: Bold denotes results that are statistically significant at the 95% confidence level. A negative sign indicates an increase in crashes. The disaggregate analysis was used to examine other factors but could not provide any further useful insights. There was sparse information on intersection and driveway density—two factors that would likely impact the effect of this treatment. Any possible impact on the effectiveness of speed on this treatment could not be discerned. California data provided design speed, while North Carolina provided speed limit. Even so, in the latter case, many roads classified as urban in the data had speeds of 88.6 km/h (55 mi/h), and several roads classified as rural had speed limits of less than 48.3 km/h (30 mi/h), further confounding attempts to identify the impacts of speed. From the aggregate analysis and logical considerations, locations with a high frequency of rear-end collisions, especially those involving a lead vehicle desiring to make a turn, would benefit from installing TWLTLs. This finding in itself can provide sound guidance in selecting locations for which this treatment would have the greatest impact. Because of the trend for rural installations to be more effective, results for all States were combined by crash type to derive estimated reductions for rural treatments. These are shown in table 3.
Economic AnalysisThe purpose of economic analysis is to determine the economic feasibility of applying this strategy. The construction cost was estimated and expressed as an annual cost and then compared to the crash savings calculated from the crash effect estimates and the most recent FHWA unit crash cost data.(8) These data indicated that the mean comprehensive crash cost for a rear-end crash (all severities combined) ranged from $13,238 for unsignalized intersections to $30,090 for nonintersection locations. Comprehensive crash costs represent the present value, computed at a discount rate, of all costs over the victim's expected life span that result from a crash. The major categories of costs used in the calculation of comprehensive crash costs included medically-related costs, emergency services, property damage, lost productivity, and monetized quality-adjusted life years.(8) Initial construction cost data provided by the four States had a large range, depending on whether or not the existing cross-section between the shoulder edges could accommodate the extra lane. A mean value was used in the economic analysis. Based on the Office of Management and Budget suggested discount rate of 7 percent and a 50-year life, the initial costs per mile were converted to equal annual costs over the life of the facility (using the standard economics formula for a capital recovery factor) and compared to the cost per mile-year for rear-end crashes avoided. The cost comparison numbers for each State are presented in table 4. It is important to note that table 4 only presents the crash savings for rear-end crashes. This comparison suggests that this strategy can be cost effective, depending on the installation costs and the amount of operational benefits. Higher cost installations are not cost effective. It is critical to select those locations where the rear-end target crashes and, by extension, the target crash savings are likely to be highest.
SUMMARYThe objective of this study was to evaluate the safety effectiveness of installing TWLTLs on rural roads as measured by crash frequency before and after the installation of the TWLTLs. The study also examined the effects of this strategy on specific crash types; total, injury, and rear-end crashes were examined in a rigorous analysis, while a cursory analysis was performed for head-on, intersection, and nonintersection crashes. The results of the aggregate analysis indicate statistically significant reductions at the 95-percent confidence level in total, injury, and rear-end crashes for the four States combined where installations were evaluated. The positive effects for rear-end crashes comprise the largest crash-type reduction. There were too few head-on crashes for a definitive analysis. The disaggregate analysis was intended to provide further insight into the circumstances where crash reductions were identified. For all States, rural installations were found to be more effective than urban ones. In fact, for urban installations, the safety effects were negligible, which suggests that potential sites in this environment should be carefully selected and that further research may be needed to identify circumstances most favorable for urban installations. CONCLUSIONSTWLTLs installed to two-lane roadways can be cost-effective treatments for rural installations, particularly for the lower-cost installations. More research is required to ascertain if there are circumstances under which urban installations would also be cost effective. Based on the lower 95-percent confidence limit of the safety effect estimates, reductions of at least 29 percent, 19 percent, and 36 percent can be conservatively expected in total, injury, and rear-end crashes, respectively, at rural installations, as presented in table 5. From the analysis and logical considerations, locations with a high frequency of rear-end collisions, especially those involving a lead vehicle desiring to make a turn into driveways along the two-lane road, would experience a greater safety benefit from installing TWLTLs. Future research on the impacts of intersection and driveway density and on differentiating the effect of the two installation methods, restriping versus widening, could provide additional insights. It is recommended that the accident modification factor (AMF) for TWLTL in the Interactive Highway Safety Design Model be revisited in light of the findings in this research because AMF, which is for total crashes, makes an implicit assumption about the AMF for target crashes.
Note: The conservative estimates are based on the lower 95% confidence interval and are calculated as the point estimate minus 1.96 times the standard error. References
|
|||||||||||||||||||||||||||||||||||||||||||||||||||||||||||||||||||||||||||||||||||||||||||||||||||||||||||||||||||||||||||||||||||