U.S. Department of Transportation
Federal Highway Administration
1200 New Jersey Avenue, SE
Washington, DC 20590
202-366-4000
Federal Highway Administration Research and Technology
Coordinating, Developing, and Delivering Highway Transportation Innovations
| REPORT |
| This report is an archived publication and may contain dated technical, contact, and link information |
|
| Publication Number: FHWA-HRT-14-020 Date: January 2015 |
Publication Number: FHWA-HRT-14-020 Date: January 2015 |
This chapter consists of three main sections. The first section briefly describes characteristics of rural and suburban roads. The second section describes the speed-related outcomes of current design and operational practices—specifically, the discussion explains why intermediate and lower speed roads sometimes operate in a state of design, operating, and posted speed discord, as defined by the FHWA Speed Concepts Guide.(4) The third section identifies traffic engineering treatments, as well as design and retrofit decisions and practices, that influence operating speeds.
DEFINING RURAL AND SUBURBAN ROADWAYS
Roadway design criteria differ by functional classification, which includes a definition of area type—urbanized, small urban area, or rural.(7) U.S. Bureau of Census designates the urbanized areas as having populations of 50,000 or more. Small urban areas have populations of 5,000 or more and are not within urbanized areas.(7) State transportation department functional classification maps provide the boundaries that define the extent of both urbanized and small urban areas. Rural areas are all remaining areas in a State outside the urbanized and small urban area boundaries. Road designers consider whether an existing or planned road is urban or rural, with urban including both urbanized and small urban areas. State transportation department functional classification maps vary in terminology use but appear consistent with intent. For example, the Utah Department of Transportation delineates urban and small urban areas.(8) Washington State Department of Transportation shows city limits and urban boundaries.(9) Virginia Department of Transportation maps include boundaries for urbanized areas and small urban clusters.(10) New Jersey Department of Transportation (NJDOT) shows only one type of urban boundary.(11) Although different terms are used, the boundaries seem to be consistently based on the FHWA and U.S. Census Bureau definitions. This is not surprising because State functional classification requirements are tied to the FHWA Federal-aid Program.(7)
The preceding discussion demonstrates that by using State transportation department functional classification maps, any existing or planned road can be designated as urban or rural. Suburban road designations are not as definite. The general definition of suburban is “the residential area on the outskirts of a city or large town,” but land uses can be more than just residential.(12) The U.S. Department of Justice defines “suburban” as a census block group no more than 30 mi from an urban area with a density of at least 500 people per mi2 but fewer than 2,000 people per mi2.(13) Ban and Ahlquist defined four geographic areas of cities—urban zone, urban cluster, suburban, and exurban.(14) They defined suburban areas as those areas located between urban clusters and exurban areas, but with blurred boundaries. They define these areas as follows:
The U.S. Department of Agriculture describes a rural area as countryside or settlements of fewer than 2,500 people, implying that the areas between urban boundaries and rural areas with populations greater than 2,500 may be considered suburban.(15)
Some published documents have tried to summarize common physical characteristics of suburban areas. The FHWA Urban Boundary and Federal Functional Classification Handbook provides general arterial spacing observations by area type: ½ to 1 mi in urban areas, 1 to 2 mi in suburban areas, and 2 to 3 mi in low-density areas.(16) The FHWA publication Access Management in the Vicinity of Intersections describes suburban areas as consisting of large-scale residential, commercial, industrial, or retail developments typically separated by larger distances than in urban areas.(17) The following characteristics describe suburban areas:
The FHWA University Course on Bicycle and Pedestrian Transportation offers the idea that three types of land use imply suburban character:(18)
The Texas Department of Transportation’s Roadway Design Manual defines a suburban roadway as a high-speed roadway that serves as a transition between urban streets and high-speed, rural highways.(19) It is typically 1 to 3 mi long, has light-to-moderate driveway densities (10 to 30 driveways per mi), and has both rural and urban characteristics. The specific mixed characteristics identified were high-speed operations while using curb and gutter for drainage.
The Pennsylvania Department of Transportation’s (PennDOT) and NJDOT’s Smart Transportation Guidebook defines the following seven “context areas” from least to most developed:(20)
The PennDOT and NJDOT guidebook includes a set of quantifiable characteristics for each of the seven context areas and a recommendation to base identified land use on this information. Table 1 summarizes the quantifiable characteristics.
Table 1. Quantifiable characteristics of land use contexts (PennDOT and NJDOT, 2008).(20)
| Characteristic | Rural | Suburban Neighborhood | Suburban Corridor | Suburban Center | Town/Village Neighborhood | Town Center | Urban Core |
| Density Units (DU)1 |
1 DU/ 20 ac | 1–8 DU/ac | 2–30 DU/ac | 3–20 DU/ac | 4–30 DU/ac | 8–50 DU/ac | 16–75 DU/ac |
| Building Coverage | N/A | < 20 percent | 20–35% | 35–45% | 35–50% | 50–70% | 70–100% |
| Lot Size/Area | 20 ac | 5,000–80,000 ft2 | 20,000– 200,000 ft2 | 25,000– 100,000 ft2 | 2,000– 12,000 ft2 | 2,00020,000 ft2 | 25,000– 100,000 ft2 |
| Lot Frontage2 | N/A | 50–200 ft | 100–500 ft | 100–300 ft | 18–50 ft | 25–200 ft | 100– 300 ft |
| Block Dimensions | N/A | 400 ft wide by varies | 200 ft wide by varies | 300 ft wide by varies | 200 by 400 ft | 200 by 400 ft | 200–400 ft |
| Maximum Height | 1–3 stories | 1.5–3 stories | 1 story retail; 3–5 story office | 2–5 stories | 2–5 stories | 1–3 stories | 3–60 stories |
| Minimum/ Maximum Setback | Varies | 20–80 ft | 20–80 ft | 20–80 ft | 10–20 ft | 0–20 ft | 0–20 ft |
| 1The guidebook does not define a density unit and may instead refer to a dwelling unit; dwelling units per acre are used in the guidebook to define high-, medium-, and low-density areas. 2The distance measured between points where side property lines meet road right-of-way lines. N/A = Not Applicable |
|||||||
Land use contexts should be broadly defined for road segments greater than 600 ft in length because of practical limitations on the frequency of changing the roadway typical section over a short stretch of road.(20)
The Smart Transportation Guidebook includes a “matrix of design values” with design criteria as rows and land use contexts as columns for five different roadway types: 1) regional arterial, 2) community arterial, 3) community collector, 4) neighborhood collector, and 5) local road.(20) This roadway typology is different than the existing functional classification system outlined by FHWA and was proposed to capture the actual role of the roadway in the surrounding community.(7) Access, mobility, and speed are considered on the road segment of interest as opposed to using only one functional classification for an entire highway.
The literature review on area type definitions demonstrated the lack of an objective definition for “suburban.” Suburban areas may be inside or outside of urban boundaries. Physical characteristics vary. Because the scope of this research project is rural and suburban roads, the research team relied on State-specific definitions of these area types when gathering information about rural and suburban roads in that State.
This section describes the relationships among design, operating, and posted speed limits during the project development process (pre- to post-construction). In addition, it also discusses the known relationship between speed and safety, including both crash frequency and severity.
Relationship Among Design, Running, Operating, and Posted Speeds
This section discusses road geometric design practices and speed-related outcomes, with particular focus on the concepts of design speed, operating speed, and posted speed. Several sections draw significantly on the FHWA’s Speed Concepts: Informational Guide and Understanding Speed Concepts, as well as on follow-up work to the informational guide published by Porter et al.(4,21,22) The following sections use both operating speed and running speed to describe relationships between design speed and observed speeds. Operating speed is “the speed at which drivers are observed operating their vehicles during free-flow conditions.” Running speed is “the speed at which an individual vehicle travels over a highway section.” Operating speeds and running speeds during off-peak, low-volume conditions provide similar insights on how drivers select speeds based on the road geometrics, particularly on uninterrupted flow facilities.
U.S. transportation agencies develop designs and prepare plans for road construction. Designers rely on a set of adopted standards and policies that include design criteria. The most commonly adopted policy is A Policy on Geometric Design of Highways and Streets (Green Book), published by the American Association of State Highway and Transportation Officials (AASHTO).(23) Design criteria in the Green Book are based on research and practice and are generally expressed as minimum, maximum, or ranges of values for design elements (e.g., minimum horizontal curve radius, maximum grade). When adopting or recommending design criteria, individual State transportation departments and other transportation agencies, as well as AASHTO, consider factors such as safety, efficiency, driver comfort, aesthetics, construction cost, and future maintenance activities. AASHTO updates design criteria in the Green Book as meaningful research results become available. The process a designer follows to establish design criteria for any given project remains essentially unchanged since the earliest design policies.(24,25)
U.S. road geometric design practice is based on selecting and applying a design speed. The design speed is usually selected during preliminary design activities and influences subsequent design decisions. Fitzpatrick et al. provided a synthesis of design speed selection practices.(26) Donnell et al. provided the inputs to and outcomes of design speed selection.(4)
A review of AASHTO design policies revealed three different design speed definitions:
Although the wording has changed, the basic application and interpretation has not. Definitions and supplemental guidance on design speed selection imply the design speed is conceptually consistent with operating speeds at the higher end of the speed distribution observed on a road segment. In other words, the majority of drivers will travel at or below the design speed. The second implication is that drivers traveling at or below the design speed are traveling at safe speeds. Drivers traveling above the design speed also travel above the safe speed. Subsequent research and analysis have shown that traveling above the design speed is not necessarily less safe than traveling below the design speed. There are documented cases where the PSL is higher than the design speed but less than inferred design speed, the “maximum speed for which all critical design-speed-related criteria are met at a particular location.”(21) There has been no thorough research regarding safety performance on road segments with different design speeds, inferred design speed, operating speed, and posted speed relationships.
As early as 1954 and 1957, AASHTO design policies described the expected relationships between the design speed and average running speed―and current policy reflects these. The policies suggested that running speeds would be close to design speeds when design speeds were low. It was also recognized that “some sections of low design speed highways are frequently overdriven, with an appreciable number of drivers exceeding the design speed.”(24) Design policy noted that the speed selected by most drivers would increase as design speed increased, but at a lower rate. AASHTO provides the following example(22):
Comparing the observed average speeds with calculated design speeds, it is found that on sections of highway having a 30-mph design speed the average running speed is approximately 90 percent of the design speed. The ratio gradually decreases to about 70 percent for highway sections with a design speed of 70 mph. (p. 40)
AASHTO expanded the design speed and running speed relationships to include numbers for both low volume and peak volumes.(24) Figure 1 illustrates these relationships.(22) Table 2 provides current design speed–running speed relationships.

Reproduced with permission of the Transportation Research Board
Figure 1. Graph. Approximate relationships between design and running speeds for urban conditions (figure 1 from Porter et al., 2012).(22)
Table 2. Relationship between design speed and average running speed (table 3-6 in AASHTO 2011).(28)
| Design Speed (mph) | Average Running Speed (mph) | Design Speed (mph) | Average Running Speed (mph) |
| 15 | 15 | 50 | 44 |
| 20 | 20 | 55 | 48 |
| 25 | 24 | 60 | 52 |
| 30 | 28 | 65 | 55 |
| 35 | 32 | 70 | 58 |
| 40 | 36 | 75 | 61 |
| 45 | 40 | 80 | 64 |
Figure 1 and table 2 illustrate that current practice related to selecting design speed continues to be influenced by early design speed definitions and the ideal design speed and running speed relationships. The early definitions suggest selecting a high design speed if a majority of the drivers will select speeds below the design speed and the design speed reflects a maximum safe speed. Operating speeds will likely be close to their targeted range because they are not expected to increase at a rate directly proportional to design speed. There will also be a larger buffer between operating speeds and design speeds at higher design speed values, which is desirable because (at the time) design speed represented the maximum safe speed. However, the design speed definition has changed. The current definition removes direct references to safety but reflects the same basic philosophy in supplemental guidance related to design speed selection until recently(29):
Except for local streets...every effort should be made to use as high a design speed as practical to attain a desired degree of safety….(p. 67)
AASHTO states that “every effort should be made to attain a desired combination of safety, mobility, and efficiency within the constraints of environmental quality, economics, aesthetics, and social and political impacts.”(28)
Once planners select a design speed, they then determine minimum (or maximum) design values for a number of elements. The next section discusses these other design criteria.
Design criteria most directly related to design speed are for horizontal curvature (superelevation, side friction, and curve radius relationships) and required stopping sight distance. The maximum side friction factor and maximum rate of superelevation parameters are the parameters used to establish the minimum radius of curvature. The values for maximum side friction factor are based on driver comfort, not on physical side friction supply and demand relationships. The result is a significant “margin of safety” between friction values used for design and friction supply at the road surface–tire interface at the point of impending skid. Figure 2 provides an example.(22) The numbers for side friction supply were based on a recent re-analysis of findings by Harwood et al.(30) They are applicable for roadways on level or near-level grades; National Cooperative Highway Research Program (NCHRP) Project 15-39 is currently investigating aspects of friction supply within horizontal curves on steep grades.(31) Figure 3 illustrates the effect of the margin of safety on determining the minimum radius of curve.(22) An additional relationship provided shows the minimum radius of curve based on truck rollover thresholds for trucks traveling at the design speed. Harwood et al. also provides the basis for the rollover threshold numbers.(30) Side friction demand is one factor used to determine horizontal curve signing needs. Bonneson et al. provided a detailed review of related published literature and curve signing guidelines.(32)

Source: Transportation Research Board
Figure 2. Graph. Comparison of maximum side friction factor used for design to available side friction (figure 2 from Porter et al., 2012).(22)

Reproduced with permission of the Transportation Research Board
Figure 3. Graph. Comparison of minimum curve radius used for design to minimum curve radii (figure 3 from Porter et al., 2012).(22)
The perception-reaction time and the deceleration rate supply the parameters used to establish the minimum required stopping sight distance. The currently recommended design is a perception-reaction time of 2.5 s.(28) The 2.5-s perception-reaction time is based on a synthesis of four studies and is believed to encompass the capabilities of most drivers, including older drivers, and to exceed the 90th percentile of reaction time for all drivers. (See reference 28 and 33 through 36.) A deceleration rate of 11.2 ft/s is used for design.(37) This value is based on research by Fambro et al.(36) Most drivers decelerate at rates greater than 14.8 ft/s and approximately 90 percent decelerate at rates greater than 11.2 ft/s. These rates are well within those required for drivers to maintain steering control during braking on wet surfaces.(28)
A conservative design approach becomes apparent when comparing the limiting parameter values used for the design of horizontal curves and calculating required stopping sight distance to the observed parameter values found in published research results. Friction supply is significantly greater than maximum friction used for design. The perception-reaction time used for design represents a 90th percentile value (i.e., 90 percent of drivers have faster perception- reaction times). Deceleration rates assumed for design represent a 10th percentile value (i.e., 90 percent of drivers decelerate at higher rates). The conservative approach is consistent with other engineering disciplines when there is variability in design parameters. Values suggest that a majority of drivers can traverse a horizontal curve or stop prior to hitting an object in the roadway if they are traveling at a rate higher than the design speed—even if the minimum design values have been used.
Actual design values are determined once minimum values are established. The Green Book recommends that “Above-minimum design criteria for specific design elements should be used, where practical…” and “Although the selected design speed establishes the limiting values of curve radius and minimum sight distance that should be used in design, there should be no restriction on the use of flatter horizontal curves or greater sight distances where such improvements can be provided as part of an economical design.”(28) The process results in the inferred design speed, defined above as meeting the maximum speed for which all critical design speed-related criteria at a particular location are greater than the design speed. Speed-related road cues perceived by the driver (e.g., available sight distance, degree of curvature) are more associated with inferred design speed than with design speed. Operating speeds have been shown to increase as inferred design speed increases.(21,38,39) The following example illustrates some of the key concepts discussed here.
Example
A suburban road is classified as an urban collector. The design speed is 35 mph and the maximum rate of superelevation is 6 percent. The road is undivided with a normal crown of 2 percent.
The maximum side friction factor for a 35 mph design speed is 0.18 (see figure 4).

Source: AASHTO
Figure 4. Graph. Maximum side friction factor assumed for design (figure 3-6 from AASHTO 2011).(28)
The equation in figure 5 then computes the minimum radius for horizontal curves on this road:

Figure 5. Equation. Minimum radius of horizontal curvature.
Where:
Rmin = minimum radius of horizontal curvature (ft).
V = design speed (mph).
emax = maximum rate of superelevation (percent).
fmax = maximum side friction factor.
The calculation to determine minimum radius of horizontal curvature for the suburban road in this example, with a 35-mph design speed, 6-percent maximum rate of superelevation, and 0.18 maximum side friction factor, is 340 ft.
Assume a radius of 1,000 ft is selected for a curve on this suburban road based on the Green Book guidance that “there should be no restriction on the use of flatter horizontal curves or greater sight distances where such improvements can be provided as part of an economical design.” (28)
The cross section would remain at normal crown for this selected radius if superelevation and side friction are distributed according to Method 2 (see table 3).
Table 3. Minimum radii and superelevation for low-speed urban streets (part of figure 3-13b from AASHTO 2011).(28)
| e (%) | Vd = 15 mph R (ft) |
Vd = 20 mph R (ft) |
Vd = 25 mph R (ft) |
Vd = 30 mph R (ft) |
Vd = 35 mph R (ft) |
Vd = 40 mph R (ft) |
Vd = 45 mph R (ft) |
| -6.0 | 58 | 127 | 245 | 429 | 681 | 1,067 | 1,500 |
| -5.0 | 56 | 121 | 231 | 400 | 628 | 970 | 1,350 |
| -4.0 | 54 | 116 | 219 | 375 | 583 | 889 | 1227 |
| -3.0 | 52 | 111 | 208 | 353 | 544 | 821 | 1125 |
| -2.8 | 51 | 110 | 206 | 349 | 537 | 808 | 1107 |
| -2.6 | 51 | 109 | 204 | 345 | 530 | 796 | 1089 |
| -2.4 | 51 | 108 | 202 | 341 | 524 | 784 | 1071 |
| -2.2 | 50 | 108 | 200 | 337 | 517 | 773 | 1055 |
| -2.0 | 50 | 107 | 198 | 333 | 510 | 762 | 1039 |
| -1.5 | 49 | 105 | 194 | 324 | 495 | 736 | 1000 |
| 0 | 47 | 99 | 181 | 300 | 454 | 667 | 900 |
| 1.5 | 45 | 94 | 170 | 279 | 419 | 610 | 818 |
| 2.0 | 44 | 92 | 167 | 273 | 408 | 593 | 794 |
| 2.2 | 44 | 91 | 165 | 270 | 404 | 586 | 785 |
| 2.4 | 44 | 91 | 164 | 268 | 400 | 580 | 776 |
| 2.6 | 43 | 90 | 183 | 265 | 396 | 573 | 767 |
Source: AASHTO
The inferred design speed in this case is the maximum speed that meets the side friction factor criterion for the horizontal curve. A superelevation value of -2 percent is used for the inferred design speed calculations because the adverse cross slope in one travel direction will result in a component of the vehicle’s weight pointed to the outside of the curve. (The opposite travel direction would have a superelevation of +2 percent and, as a result, a higher inferred design speed.) The equation in figure 6 computes the required side friction factor for a vehicle traversing a horizontal curve:

Figure 6. Equation. Required side friction factor.
Where:
f = required side friction factor.
V = speed of vehicle traversing the horizontal curve (mph).
R = radius of horizontal curvature (ft).
e = superelevation (percent).
The inferred design speed estimate for the horizontal curve uses an iterative process. Table 4 summarizes the results. Donnell et al. provides additional detail on how to perform inferred design speed calculations.(21)
Table 4. Results of iterative inferred design speed calculations.
| Iteration | V | f | Comment |
| 1 | 35 | 0.102 | The required side friction, 0.102, is less than the maximum for 35 mph, 0.18. The inferred design speed is higher than 35 mph. |
| 2 | 45 | 0.155 | The required side friction, 0.155, is greater than the maximum for 45 mph, 0.15. The inferred design speed is lower than 45 mph. |
| 3 | 40* | 0.127 | The required side friction, 0.127, is less than the maximum for 40 mph, 0.16. The inferred design speed is 40 mph. |
*The inferred design speed in this example is calculated to the nearest 5-mph increment for which the design side friction is satisfied. If one were to assume a linear change in friction with each unit increase in the speed, the inferred design speed could be calculated to the nearest 1 mph, using the process described in this example.
The calculations used to populate table 4 were based on the maximum side friction factors used for design. As previously noted, the design values are significantly lower than limiting values of side friction (see figure 4). The curve in this example would have an inferred design speed of approximately 80 mph using the calculations based on side friction supply for passenger cars on wet pavement at the point of impending skid.
Speeding-Related Outcomes of U.S. Design Practice
Donnell et al. describes and illustrates the speed-related outcomes of U.S. road design practice. Figure 7 illustrates a typical outcome on low- to intermediate-speed roads.(21) While design speed is determined during the design process, inferred design speeds are determined implicitly (but typically not considered or calculated) as a result of geometric design decisions. The inferred design speeds are often higher than the design speed because designers are encouraged to exceed minimum values determined for geometric design features that are determined based on the design speed. The result is that many design features meet criteria for design speeds far greater than the design speed (shown by the inferred design speed line above the designated design speed line in figure 7). Initial posted speeds are generally equal to or less than the design speed.(26) As figure 7 shows, actual operating speeds may be higher than both the speed limit and the design speed after a road is open to traffic.

Reproduced with permission of the Transportation Research Board
Figure 7. Chart. Observed speed-related outcomes of the typical U.S. design practice (figure 2a from Donnell et al., 2009).(21)
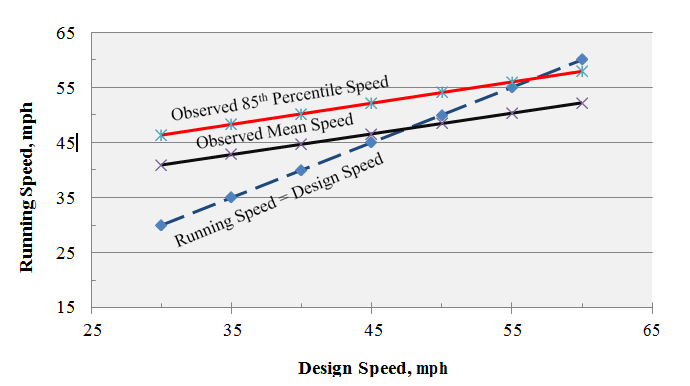
Observations show that mean operating speeds tend to be higher than design speeds of approximately 45 to 50 mph or less (the exact crossing point appears to depend on facility type). Observed 85th percentile speeds tend to be higher than design speeds of approximately 55 mph or less. Figure 8 illustrates these findings.(22)
Reproduced with permission of the Transportation Research Board
Figure 8. Graph. Observed relationships between design speed and operating speeds (figure 5 from Porter et al., 2012).(22)
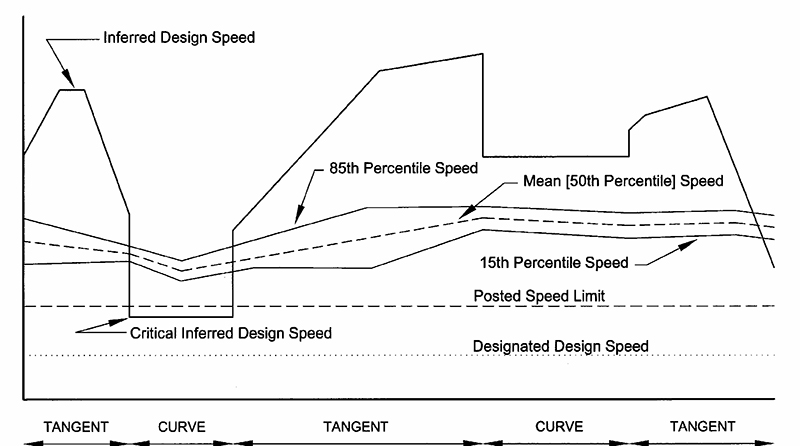
Tarris et al. first illustrated conceptually possible speed-related outcomes of U.S. road design practice on road segments with a series of tangents and curves (see figure 9).(40) The figure compiles many of the ideas of the preceding discussion. Donnell et al. later used a series of case studies with field data that invalidated the concepts portrayed in this figure.(4)
Reproduced with permission of the Transportation Research Board
Figure 9. Diagram. Conceptual speed-related outcomes of U.S. road design practice (adapted from figure 1 in Tarris et al., 2000).(40)
Donnell et al. defined the terms “speed harmony” and “speed discord.”(4,21)
Design that results in speed harmony is generally desired.
Relationship Between Speed and Safety
Speeding and relationships between operating speed and safety are poorly understood, likely a result of confusing terminologies, inconsistent crash coding, and conflicting research results. Consider the following:
Two separate literature reviews on speed and safety, citing 73 and 65 published sources, respectively, concluded that “although evidence tended to support the notion that accident risk increased with speed, more study was needed to determine when changes in speed limit affect accidents or to predict the sizes of these effects.”(43,44,45)
Although these issues can confuse the speed-s afety paradigm, defined relationships among distance, time, and speed lead to the following six conclusions:
These points indicate that, all else being equal, drivers traveling at faster speeds may be less likely to successfully react to unexpected situations (e.g., changes in lead vehicle behavior, nonmotorized users crossing traveled way, changes in roadway alignment, roadside encroachments) than drivers traveling at slower speeds.
The energy dissipated during a crash is directly proportional to the square of travel speed at the time of the crash. Impact forces affecting drivers increase as this initial speed increases and as the time over which energy is dissipated decreases. Therefore, the crash severity (i.e., probability of fatality or severe injury) increases as initial travel speed increases. Figure 10 depicts previous research (Joksch et al.) that demonstrates an exponential relationship.(46)
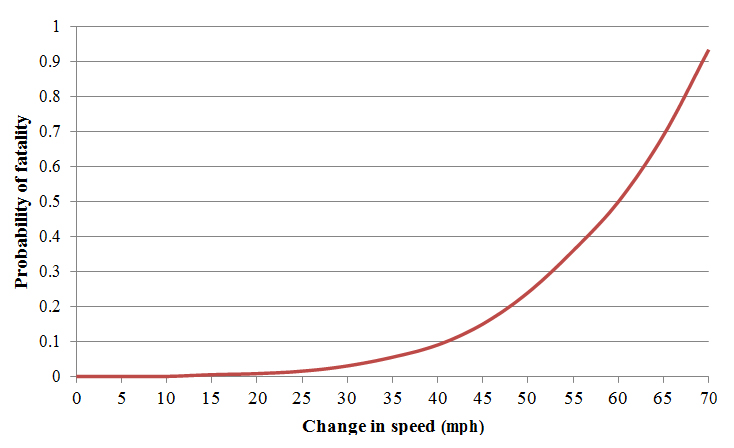
Figure 10. Graph. Relationship between change in travel speed during a crash and the probability of fatality (plotted model estimated by Joksch).(46)
The challenge to road designers, traffic engineers, and safety professionals is to design and retrofit roadways so that drivers choose speeds consistent with the intended operating speed of a facility (indirectly defined by the design speed, speed limit, and/or advisory speed).
There are well-documented relationships among geometric design features, speed, and safety in the design consistency and crash prediction modeling literature for rural, two-lane highways. Similar literature on other rural and suburban roadway types is less developed. This section provides a general summary of the relationships among geometric design features, operating speeds, and safety on rural and suburban roadways. The discussion focuses on horizontal alignment, vertical grades, and cross-section elements. The research team reviewed domestic and international literature.
In much of the design consistency literature, researchers use statistical models to estimate the association between operating speeds and geometric design features. The most commonly modeled operating speed measures are the mean or 85th percentile speeds of a sample of drivers (mostly free-flow passenger cars, with free-flow defined as having a magnitude of a preceding headway greater than some value). The Operational Effects of Geometrics Committee (AHB65) of the Transportation Research Board (TRB) prepared the Modeling Operating Speed Synthesis Report, which is a combination of operating speed models developed in different regions of the world.(47) The research team used this report to prepare table 5, which summarizes modeled associations between design elements and operating speeds. The values shown are individual or range of estimated parameters from linear regression models. They represent the expected change in the magnitude and direction of operating speed associated with a unit change of the design element. For example, the lane width parameter of 2.08 indicates that operating speed is expected to decrease by 2.08 mph for every 1 ft reduction in lane widths. The parameter for the grade of horizontal curve approach tangent indicates that operating speed is expected to decrease by 1.47 mph for every 1 percent increase in grade.
Table 5. Statistical associations between vehicle operating speeds and geometric design features. (Information gathered from TRB Operational Effects of Geometrics Committee, 2011).(47)
| Geometric Feature |
Change in Operating Speed per Unit Change in Geometric Feature (mph) |
||
Rural Two-Lane Highways |
Rural Multi- Lane Highways |
Suburban Highways |
|
| Lane width (ft) | 0.032–2.08 |
N/A |
N/A |
| Paved shoulder width (ft) | 0.015–0.17 |
0.328 |
N/A |
| Length of horizontal curve approach tangent (ft) | -0.005–0.008 |
N/A |
N/A |
| Grade of horizontal curve approach tangent (percent) | -1.47–3.11 |
N/A |
N/A |
| Length of horizontal curve departure tangent (ft) | -0.002–0.023 |
N/A |
N/A |
| Grade of horizontal curve departure tangent (percent) | -1.45– -0.224 |
N/A |
N/A |
| Length of horizontal curve (ft) | -0.009–0.001 |
0.00002 |
N/A |
| Horizontal curve deflection angle (degrees) | -0.21– -0.08 |
N/A |
N/A |
| Radius of horizontal curve (ft) | 0.001–0.026 |
0.0005 |
N/A |
| Degree of horizontal curve | -0.481– -0.189 |
N/A |
-17.90– -23.4 |
| Rate of vertical curvature (ft/ft) | 0.011 |
N/A |
N/A |
N/A = Not Available
Much of the work on statistical modeling of vehicle operating speeds has been for rural, two-lane highways. It appears that a unit decrease in the lane width is associated with a decrease in operating speed, although the magnitude of the decrease varies widely across published research. Similarly, a unit decrease in the paved shoulder width is consistently associated with a decrease in operating speeds. Narrowing lane and shoulder widths appears to be a possible speed- reduction measure on rural, two-lane highways. The research team also found consistency across two-lane rural highway speed prediction modeling research for the grade of the horizontal curve departure tangent, the horizontal curve deflection angle, and the degree of horizontal curve. All signs in table 5 for these variables are negative, which indicates that a unit increase in any of these dimensions is associated with a decrease in operating speeds. This suggests that increasing grades on the departure tangent, increasing the horizontal curve deflection angle, or increasing the degree of curve, will produce lower vehicle operating speeds. Note that the degree of horizontal curve is inversely related to the radius of curve, thus increasing the radius of curve is expected to increase operating speeds, which table 5 also illustrates. Porter et al. noted that the sensitivity of operating speeds to changes in geometry is relatively small:(22)
The concept that road geometry can be adjusted to achieve consistency between target speeds and operating speeds is based on the premise that changes in geometry will affect operating speeds. Research has shown, however, that operating speeds may not be influenced by geometric design decisions unless very constrained dimensions are used. This may be counterintuitive given that geometric design criteria are dependent on design speed. (pp. 43–44)
There is limited published research relating geometric design features to vehicle operating speeds on rural, multi-lane highways and suburban roads. However, the statistical associations in table 5 for these two roadway types appear to confirm the findings for rural, two-lane highways— narrower paved shoulders and sharper horizontal curves are both associated with lower operating speeds, but the relationships are not highly sensitive.
Changes in road geometry associated with reductions in speeds (e.g., smaller horizontal curve radii, narrower lane widths, and narrower shoulder widths) are sometimes associated with increases in expected crash frequency. The following paragraphs discuss this phenomenon at greater length.
The Highway Safety Manual (HSM) contains crash modification factors (CMF) for geometric design features, particularly for rural, two-lane highways. Appendix A of this document includes available HSM CMFs for various geometric design features. In some cases, there are references to a figure or a table from the HSM. In other cases, an expected value is provided for the CMF with a standard error of the estimate.
Figure 11 shows an HSM sample of the lane width and shoulder width CMFs for rural, two-lane highways. In this case, the baseline condition is a 12-ft travel lane and a 6-ft shoulder, which has a combined CMF equal to 1.00 (i.e., the base condition). As illustrated in figure 11, it is expected that narrowing the lane width, shoulder width, or both will increase crash frequency. It is expected that CMFs related to other geometric elements, as well as to other facility types, follow similar patterns; narrower, geometries will result in higher crash frequencies.
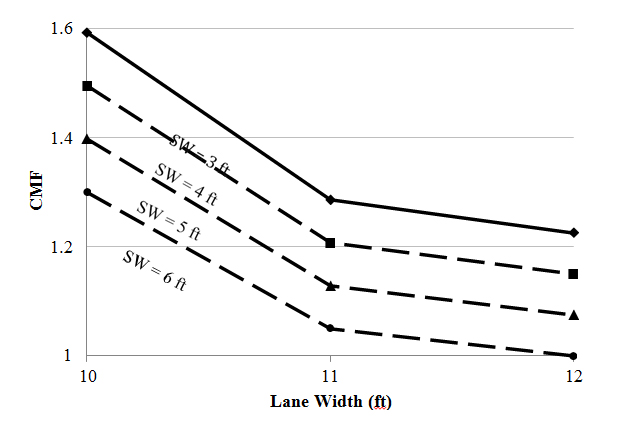
Figure 11. Graph. CMFs for combinations of lane and shoulder widths for two-lane rural highways (Average Annual Daily Traffic > 2,000 vehicles/day).
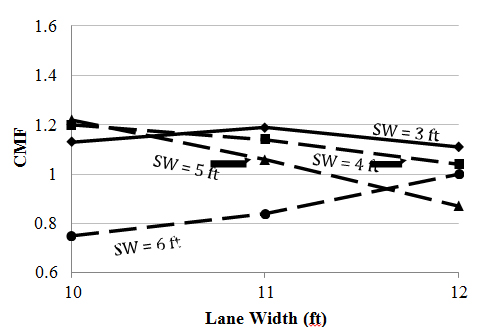
Gross et al. developed CMFs for lane-width–shoulder-width combinations on rural, two-lane highways; these are plotted in figure 12.(48) The interactions between lane width and shoulder width were accounted for during CMF estimation by using a case-control methodology. Results yield the following conclusions:
Estimated interactions between lane and shoulder width by Bonneson and Pratt have similar implications—the safety effect of lane width depends on the
shoulder width. (49)
Reproduced with permission of the Transportation Research Board
Figure 12. Graph. CMFs for combinations of lane and shoulder widths for two-lane rural highways (figure 1 in Gross et al., 2009).(48)
Much of the research cited earlier in this section treats speed and safety effects of geometric design elements independently. Crash prediction algorithms currently in the HSM would lead geometric designers to conclude that larger radii horizontal curves, flatter vertical grades, and wider lane and shoulder widths will result in lower expected crash frequencies than geometric designs with smaller radius curves, narrower lane and shoulder widths, and steeper vertical grades. Speed prediction algorithms suggest that wider and flatter geometric designs produce higher vehicle operating speeds than do more curvilinear designs with narrower cross sections. Researchers explored the simultaneous effects of geometric design decisions on speed and safety by overlaying the results from the independently conducted speed and safety studies. Figure 13 through figure 15 provide the results.
The solid line in figure 13 represents the predicted 85th percentile speed for free-flow passenger cars as a function of horizontal curve radius on two-lane rural highways. The research team used models reported by Fitzpatrick et al. to create the operating speed line.(50) The dashed line represents the CMF for horizontal curve radius on two-lane rural highways from the HSM.(37) Horizontal curve radius clearly influences vehicle operating speeds; however, the effect is nominal until the radius falls below approximately 1,000 ft. Similarly, the expected crash frequency changes only nominally until the horizontal curve radius falls below 1,000 ft.
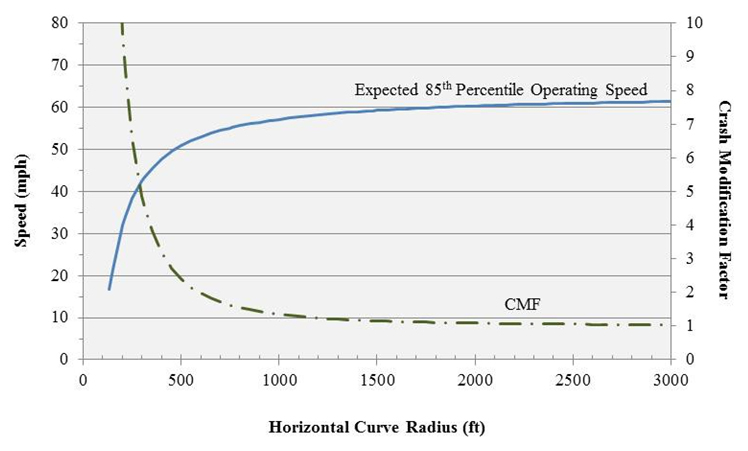
Figure 13. Graph. Relationships among horizontal curve radius, speed, and safety for two- lane rural highways.
Figure 14 shows the speed and safety effects for lane width on rural, two-lane highways. The solid line shows the predicted 85th percentile speed for free-flow passenger cars as a function of lane width on rural, two-lane highways. The research team used models reported by Lamm and Choueiri to create the operating speed line.(51) The dashed lines show the CMFs for lane width on rural, two-lane highways from the HSM for two levels of average daily traffic volumes.(37) The lane width is linearly related to the predicted operating speed—wider lane widths are associated with higher speeds. The expected crash frequency changes nominally for lane widths between 11 and 12 ft; however, the CMF increases significantly as lane widths are reduced below 11 ft. The lane width CMFs reported is applicable to run-off-road, sideswipe, and head-on collisions.
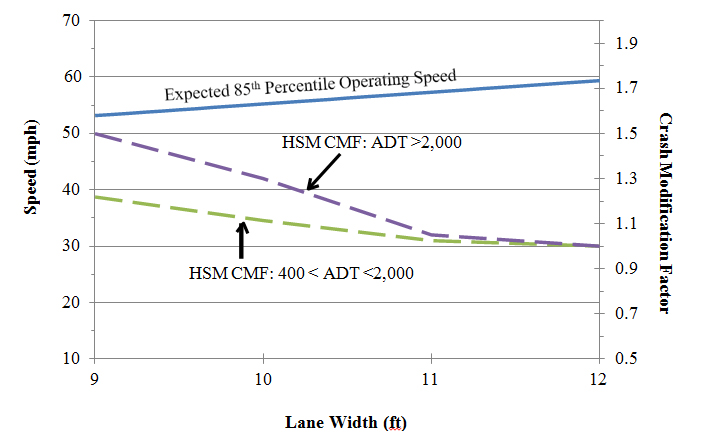
Figure 14. Graph. Relationship between lane width and speed and safety for two-lane rural highways.
Figure 15 shows the speed and safety effect tradeoff for the shoulder width on rural, two-lane highways. The solid line shows the predicted 85th percentile speed for free-flow passenger cars, as a function of shoulder width on rural, two-lane highways. Again, the research team used models reported by Lamm and Choueiri to create the operating speed line.(51) The dashed lines show the CMFs for shoulder width on rural, two-lane highways from the HSM for two levels of average daily traffic volumes.(37) The shoulder width is linearly related to the predicted operating speed—wider shoulder widths are associated with higher speeds. The expected crash frequency decreases in a linear manner as the shoulder width increases from 0 to 8 ft. As with lane width, the shoulder width CMFs reported are applicable to run-off-road, sideswipe, and head-on collisions.
The overall conclusion to be inferred from the speed and safety assessment of geometric design features is that more forgiving geometric designs generally tend to improve safety performance (i.e., fewer expected crashes), according to the HSM; however, more, smaller radii and narrower cross sections tend to produce lower vehicle operating speeds. The study by Gross et al. indicated that narrower cross-section geometries are not necessarily less safe and that the interactions between lane and shoulder widths are important to consider when evaluating safety effects (see figure 12, for example).(48) Because there was enough evidence to support exploring different combinations of cross-section elements (e.g., lane and shoulder widths) as a strategy to reduce operating speeds and improve safety on rural and suburban roads, FHWA recommended a new safety study on rural, two-lane roadway cross-section allocation. The study was conducted as part of the research project associated with this informational guide.
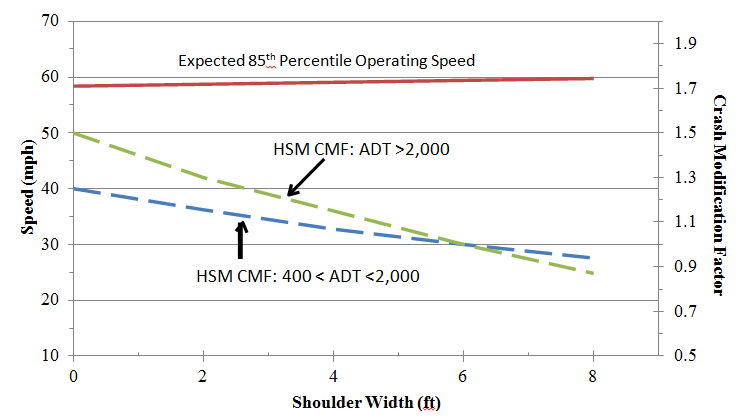
Figure 15. Graph. Relationship between shoulder width and speed and safety for rural, two-lane highways.
Engineering Treatments for Reducing Speeds
Traffic engineering treatments may affect speed or speeding-related crashes on rural or suburban roadways. Agencies sometimes implement speed-related traffic engineering treatments on or near a roadway section with the intention to modify driver operating speeds or reduce speeding- related crashes. The literature review identified more than 40 traffic engineering countermeasures that show promise of speed reductions or safety improvements on rural and suburban road segments. Appendix B includes a tabular summary of the countermeasures identified in both the international and domestic literature. This appendix also provides a description of the treatment, a photograph of the treatment (when available), the safety and operational effectiveness of each treatment, and cost information (if available). Readers are also referred to Engineering Countermeasures for Reducing Speeds: A Desktop Reference of Potential Effectiveness, Speed Management: A Manual for Local Rural Road Owners, and Toolbox of Countermeasures for Rural Two-Lane Curves.(5,6,52)