U.S. Department of Transportation
Federal Highway Administration
1200 New Jersey Avenue, SE
Washington, DC 20590
202-366-4000
Federal Highway Administration Research and Technology
Coordinating, Developing, and Delivering Highway Transportation Innovations
 |
| This report is an archived publication and may contain dated technical, contact, and link information |
|
Publication Number: FHWA-HRT-04-138
Date: December 2005 |
||||||||||||||||||||||||||||||||||||||||||||||||||||||||||||||
Enhanced Night Visibility Series, Volume VII: Phase II—Study 5: Evaluation of Discomfort Glare During Nighttime Driving in Clear WeatherPDF Version (574 KB)
PDF files can be viewed with the Acrobat® Reader® CHAPTER 2—METHODSPARTICIPANTSSixty individuals participated in the data collection studies. Participants were divided into three different age categories: 20 participants were between the ages of 18 and 25 years (younger category of drivers), 20 were between the ages of 40 and 50 (middle-aged category of drivers), and 20 were age 60 or over (older category of drivers). An equal number of males and females were in each age category. Participation was allowed after a screening questionnaire was completed, and only if the selection conditions were fulfilled (appendix A). Participants were required to sign an informed consent form (appendix B), present a valid driver’s license, pass the visual acuity test (appendix C) with a score of 20/40 or better corrected vision (as required by Virginia State law), and have no health conditions that would make operating the research vehicles a risk. The participants’ visual acuities ranged from 20/10 to 20/40 using a Snellen eye chart. Based on findings of earlier research, no distinction was made between participants with and without visual correction with regard to study participation.(10) Participants were instructed about their right to withdraw freely from the study at any time without penalty. They were told that no one would try to make them participate if they did not want to continue. If they chose at any time not to participate further, they were instructed that they would be paid for the amount of time of actual participation. Participants received 20 dollars per hour for their participation. All data gathered as part of this experiment were treated with complete anonymity. INDEPENDENT VARIABLESVESFollowing are the definitions for the 11 VES configurations used in the study:
For a more indepth look at the technical specifications of each headlamp, refer to ENV Volume XVII, Characterization of Experimental Vision Enhancement Systems. These 11 VES configurations were selected based on several considerations. The HLB and the HID headlamps currently are available on the market and are what most drivers have traditionally used in their vehicles; therefore, they were added as baseline conditions to allow comparing new VES alternatives to what is readily available. HID lamps have a high level of luminous efficiency, providing much more luminous flux than conventional halogen lamps. These traits have made HID lamps good candidates for vehicular applications, and they already have been implemented as standard components in some new automobiles. Since these headlamps were introduced, however, public concern and media coverage about the glare associated with them have become increasingly prevalent. The HID lamps appear much brighter to oncoming drivers, and they have a blue-white color, which appears different from the yellow light produced by halogen lamps. These characteristics have led to a perceived increase in discomfort glare when nighttime drivers approach a vehicle equipped with HID lights. In turn, this perception has led to a growing number of complaints made to the U.S. Department of Transportation, which has called for additional research to determine if the increase in discomfort is an acceptable tradeoff for the possible increase in visibility. Similar research is also needed for HOH lamps. The HOH lamp provides approximately 20 percent more visible light in a low-beam configuration than a standard halogen lamp; however, its effects on visibility and glare are unknown. Supplemental UV–A headlamps have the promise of improving the visibility distance of objects while minimizing glare. UV–A headlamps emit radiation with a wavelength ranging from 320 to 400 nm. This radiation causes materials that contain phosphors and selected other materials to fluoresce. Studies conducted in Sweden and the United States have found that nighttime driving visibility increases as much as 30 to 200 percent when these devices are used.(11) Furthermore, because UV–A radiation falls outside of the visible spectrum, it is possible that the disability and discomfort glare caused by UV–A headlamps would be minimal—perhaps even nonexistent. The hybrid UV–A headlamps used in this study include visible light, but it is not known whether this increased light will, in conjunction with standard HLB or HID headlamps, increase discomfort glare. AgeAs mentioned, there were three age variables: younger participants (18 to 25 years), middle-aged participants (40 to 50 years) and older participants (60 years or older). These age groups were created based on literature review findings (ENV Volume II) that suggest changes in vision during certain ages. (See references 12, 13, 14, 15, and 16.) Gender was used as a control but not as a factor of interest. An equal number of males and females was assigned to each age group. DEPENDENT VARIABLESThe dependent variables were two subjective discomfort glare ratings—a far rating and a near rating—using the deBoer scale. The far rating was the discomfort that a participant experienced while driving a segment of road that stretched from 396.2 to 304.8 m (1,300 to 1,000 ft) away from the opposing headlamps. The near rating reflected the discomfort that a participant experienced while driving a segment of road that stretched from 137.2 to 45.7 m (450 to 150 ft) away from the opposing headlamps. For both discomfort ratings, participants used the scale developed by deBoer and Schreuder. As discussed earlier, the deBoer scale is the most common method to measure subjective glare discomfort, and its use was recommended by Sivak and Olson in their attempt to develop a universally acceptable methodology for evaluating discomfort glare from vehicle headlamps.(17) It is a nine-point scale with qualifiers only for the odd points:
EXPERIMENTAL DESIGNAn 11 (VES) by 3 (Age) experimental design was used to assess discomfort glare. Because of voltage fluctuations, some discomfort glare resulting from VESs was reassessed in an additional data collection effort. As a result, two separate data collection efforts were used to complete this study. The data collection details for each effort are discussed below. The initial data collection effort was an 11 (VES) by 3 (Age) mixed factor design. Three age groups were used with 10 participants in each age group for a total of 30 participants. The 11 VESs were treated as a within-subjects variable with each participant rating the discomfort glare for each VES. Because of the hardware constraints of combining the different headlamps (detailed in the Apparatus and Materials section), special considerations were taken while counterbalancing the VES configurations for the initial data collection effort. Data were collected on two nights. The VES configurations that could be presented in the same night were grouped into experimental sessions. Because the UV headlamp setups were mounted permanently on different vehicles, the base headlamps (HLB and HID) had to be moved between vehicles to achieve the desired configurations. This movement of base headlamps was time-consuming, so it was done only once per night before the participants arrived. This constraint forced the grouping of the UV–A configurations into sessions A and B. To evaluate the other VESs, the HOH and HHB were added to session A; the HLB–LP condition was added to session B. Session A had six VESs, and session B had five VESs (table 1).
The VES sessions remained consistent throughout the evaluation. The initial data collection effort required that the two experimental sessions occur on two separate nights; however, to avoid any order effects, the participant pool was split in half, and each half was assigned a different presentation order. This resulted in half of the participants being presented with session A on night 1 and the other half being presented with session B on night 1; the presentations reversed on night 2. In addition, the presentation of the VESs within a session was counterbalanced for each participant. Two participants performed the experiment simultaneously. After reviewing the results from the initial data collection effort, there was some indication that some of the lights may have had variations in their output caused by fluctuations in the glare vehicle voltage. The following lights could have been affected by these fluctuations:
To compensate for this potential problem, the data for these VESs were excluded from analysis, and a second data collection effort was designed that included only these six VESs. An additional 30 participants were selected from the same three age groups used in the initial data collection effort (i.e., 10 from each group). The six VESs included in the second data collection effort also were treated as a within-subjects variable, with each participant rating the discomfort glare on each of these VESs. This data collection effort was completed on a single night. The VESs were counterbalanced to reduce order effects. The same protocol was followed in both data collection efforts. These two data collection efforts resulted in an experiment that used an incomplete block design. The initial data collection effort was one block, and the second data collection effort was the second block. In a complete block design, each block receives a replication of the entire experiment, as was the initial intent of the first data collection effort. The design of this experiment was an incomplete block because each block was exposed to only certain VESs. The VESs included in each block are shown in table 2.
SAFETY PROCEDURESSafety procedures were implemented as part of the instrumented vehicle system. These procedures were used to minimize possible risks to participants during the experiment. There were five required safety measures:
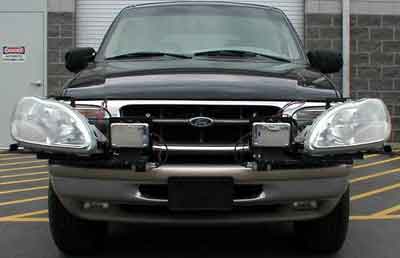
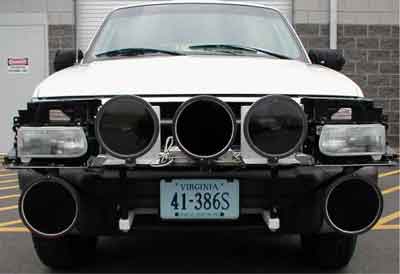
APPARATUS AND MATERIALSVehiclesThe VESs were configured on four glare vehicles, including two sport utility vehicles (SUV), a pickup truck, and a sedan. One SUV (black) was equipped to provide the HLB, HID, hybrid UV–A + HLB, and
The pickup truck provided the HHB and HOH VES configurations. Both bulb types were located in the same housing unit, with the HOH lamps replacing the standard HLB lamps that were installed originally. The sedan was equipped with the HLB–LP system by the manufacturer. Table 3 summarizes the headlamps mounted on each glare vehicle.
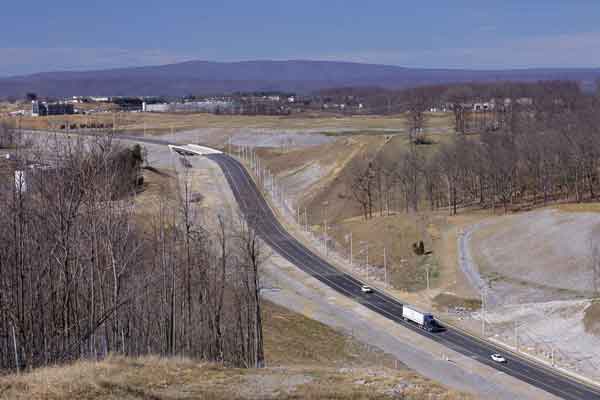
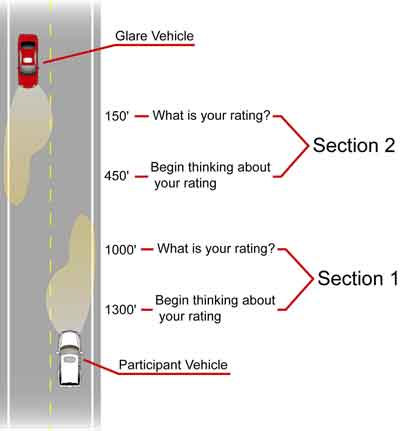
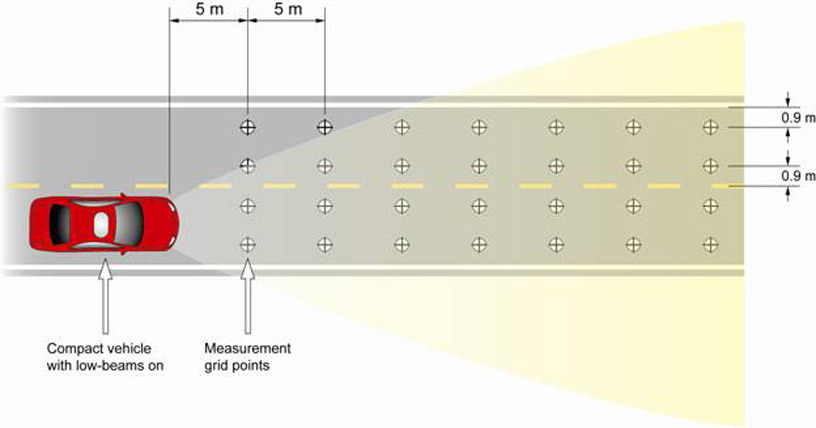
During the experiment, participants drove in one of two identical compact vehicles using the conventional HLB configuration equipped by the manufacturer. Smart RoadThe Virginia Smart Road (all overhead lighting turned off) was used for the onroad study (figure 4 and appendix F). The Smart Road is a cooperative research effort between the Virginia Department of Transportation (VDOT), the Federal Highway Administration (FHWA), and the research contractor. The road is a two-lane highway that is approximately 3.2 km (2 mi) long with turnaround sections at both ends. The road has a vertical grade, which is fairly constant, and some horizontal curvature, as well as one section composed of asphalt pavement and one section of concrete pavement. The area surrounding the Smart Road consists mostly of open fields and mountains with few extraneous light sources; therefore, the ambient lighting was controlled fairly easily, decreasing the variability of the data. The secluded area and closed-off road also helped maximize the safety of the participants and provided convenience to the experimenters, who were able to position the test vehicles easily without disrupting traffic or surrounding neighborhoods. Figure 4. Photo. Smart Road. The locations of the parked glare vehicles were marked on the pavement before beginning data collection. Two locations were chosen in each of two travel lanes (in one experimental run, the participant would pass two glare vehicles in the opposing lane) in areas with minimal horizontal curvature. The locations were 798 m (2,592 ft) apart. For each glare vehicle, four orange cones were located on the right shoulder of the Smart Road to denote the separation distance between the driver and the glare vehicle. The first and second cones were located at 396.2 and 304.8 m (1,300 and 1,000 ft), respectively, from the glare vehicle (denoting the road segment corresponding to the far rating). The third and fourth cones were located at 137.2 and 45.7 m (450 and 150 ft) from the glare vehicle (denoting the road segment corresponding to the near rating). The two selected glare source positions were based on Sivak and Olson’s discomfort glare protocol.(17) The setup is illustrated in figure 5. Figure 5. Diagram. Experimental onroad setup. Headlamp AimingThe headlamps used for the HLB, HID, HOH, HHB, and UV–A configurations were located on external light bars. To change from one configuration to another, the HLB and HID headlamps were moved onto, off of, and between vehicles. Each light assembly movement required a re-aiming process, which took place before starting the experimental session each night. At the beginning of the Phase II studies, a headlamp aimer was not available to the contractor, so an aiming protocol was developed with the help of experts in the field. (See references 18, 19, 20, and 21.) The details of the aiming protocol used for this specific study are described in appendix G. During the photometric characterization of the headlamps, it was discovered that the position of the maximum intensity location of the HLB, HOH, and HHB configurations was aimed higher and more toward the left than is typical, which likely resulted in these lights being rated as having increased discomfort glare; however, a secondary study comparing the discomfort glares associated with a standard optical aimer method and the method used for this study showed a minimal difference for the halogen baseline lights. More information on this secondary study can be found in the Discussion section of this report. Details about the aiming procedure and the maximum intensity location are discussed in ENV Volume XVII, Characterization of Experimental Vision Enhancement Systems. EXPERIMENTAL PROCEDUREThe driving performance portion of the study took place at the Smart Road testing facility. The road was closed to all traffic except for experimental vehicles. The experimental procedures were adapted from Sivak and Olson’s field tests, which involved a proposed discomfort glare evaluation methodology at intermediate speeds.(17) To increase the efficiency of the data collection effort, data for two participants, each driving in a separate vehicle with one following the other, were collected simultaneously. During pilot testing, protocol adjustments were made so that the drivers in each vehicle would not be distracted by each other or by the onroad experimenters who changed the glare vehicles after each run. Participants drove only in clear weather conditions. The test session was cancelled if there was any precipitation on the roadway (e.g., rain, snow, fog). Participant ScreeningBefore beginning the glare experiment, each participant completed vision tests and a study familiarization process (appendix D). This included signing the informed consent form shown in appendix B and participating in three vision tests to determine visual acuity, contrast sensitivity, and any color vision deficiencies. The only vision requirement to participate in the discomfort glare study was normal or corrected vision with an acuity of 20/40 or better. Results of the contrast sensitivity and color blindness tests were documented but were not used for screening. A detailed experimenter protocol for vision testing is presented as part of appendix D. TrainingEach participant was given an orientation of the glare study (appendix E). He or she was told the purpose of the experiment and, using a map of the Smart Road, was shown where he or she would be driving, where the glare vehicles would be parked, and when he or she would be asked to evaluate the glare. Each participant was also instructed to drive as he or she normally would drive, in the right lane at a speed of General Onroad ProcedureFollowing the completion of the vision tests and instructions, the participant drove to one end of the Smart Road with an in-vehicle experimenter in the front passenger seat. Run 1 was a practice run to familiarize the participants with the road and vehicle. During this run, there were no glare vehicles in the opposite lane. When the participant reached the end of the Smart Road, he or she parked in the turnaround area, where he or she was prepared for run 2. While the participant was parked in the turnaround area, onroad experimenters positioned two glare vehicles in the opposing lane and turned on the headlamps. Run 2 was the first experimental run. Before beginning the run, the in-vehicle experimenter read the following instructions to the driver (see figure 5): “You will drive this vehicle up and down the road at 25 miles per hour. While you are driving, always look directly ahead and never directly at the oncoming headlights. Along the way, there will be vehicles parked in the opposite lane with the headlights facing you. For each vehicle, I will ask you to rate the discomfort you experience from the glare two different times. You will use the nine-point scale that we reviewed during the screening (while showing the scale, the experimenter read the scales qualifiers). “When I need you to begin evaluating the glare, I will say, ‘Begin.’ You will then begin thinking about the discomfort rating you want to give the headlights. I will then ask, ‘What is your rating?’ At that time, I want you to tell me your rating for the discomfort you experienced on the stretch of road from where I said ‘begin’ to where I asked for the rating. We will then repeat that procedure for the same headlights on a different stretch of road. Do you have any questions?” If there were no questions, the participant began driving up the road at 40 km/h (25 mi/h). As explained previously, for each glare vehicle, there were four orange cones located on the right shoulder. Cones 1 and 2 marked the near road segment where the discomfort was rated, and cones 3 and 4 marked the far road segment. Therefore, at cones 1 and 3, the in-vehicle experimenter would say, “Begin,” and at cones 2 and 4 the experimenter would say, “Give me your rating.” At the end of run 2, the participant pulled into another turnaround area while the onroad experimenters positioned the glare vehicles for the next run. Runs 3 and 4 both repeated the procedure followed in run 2. The in-vehicle experimenter protocol used in the study is in appendix E. Photometric MeasurementsAfter completion of the participant data collection, a series of photometric measurements were taken to determine two important parameters of each VES: the vertical illumination directed toward the driver’s eye for each VES configuration and the driver’s adaptation luminance. These measurements will be used in the analysis to help interpret the results. Vertical IlluminationA Konica MinoltaTM T-10 illuminance meter was used to measure the vertical illumination directed toward the participant’s eye. The meter was placed inside a compact vehicle identical to the one driven by the participant during testing; the meter was then positioned to replicate the driver’s eye position. An average driver eye height of 119.4 cm (47 inches) was assumed. The onroad experimental setup for each VES configuration was replicated so that the measurement vehicle was in the right lane with the glare vehicle facing it in the opposing lane. The vertical illumination measurements were taken at 15.2-m (50-ft) intervals in the far rating segment of road (i.e., 396.2 m, 381.0 m...304.8 m (1,300 ft, 1,250 ft ...1,000 ft)) and near rating segment (i.e., 137.2 m, 121.9 m...45.7 m (450 ft, 400 ft ...150 ft)). The complete set of vertical illumination measurements are shown in appendix H. Adaptation LuminanceDuring testing, the participant drove a compact vehicle with the HLBs turned on. Because a driver’s adaptation level may affect the level of discomfort glare experienced, an attempt was made to quantify this parameter.(7) It was assumed that the driver’s adaptation level would be the average pavement luminance provided by the HLB headlamps. A Pritchard® PR-1980A photometer with a 6-min aperture was used to make the luminance measurements. To evaluate an average adaptation luminance, the measurements were taken in a grid similar to that used in the Illuminating Engineering Society of North America (IESNA) American National Standards Institute (ANSI) Recommended Practice for Roadway Lighting (RP-8-00) to evaluate the luminance of pavement surfaces.(23) As illustrated in figure 6, grid points were spaced longitudinally every 5 m (16 ft) and laterally 0.9 m (3 ft) inside the edges of each lane (one quarter of the lane width). The measurement vehicle was parked in the right lane with the photometer positioned inside the vehicle to represent the driver’s eye position (119.4 cm (47 inches)). Luminance measurements were then taken at each grid point, starting with the first lateral row, located 5 m (16 ft) from the front of the vehicle, and ending at the final row, located 80 m (263 ft) from the front of the vehicle; the distance from the front of the vehicle to the observer was approximately 2 m (6 ft). This method assumed a stationary observer, meaning that the observer perceived the entire roadway at once; therefore, the measurement angle varied for each measurement, which is different than the moving observer method used in IESNA RP-8-00. The RP-8-00 model also assumes an observer line-of-sight of 1° below horizontal, spanning a distance of 83 m (272 ft) before intersecting the ground.(23) A similar model was used here. It was assumed that the observer would have an adaptation luminance equal to the average pavement luminance over this span. The adaptation level provided by the low beam on the vehicle driven by the participant was 0.14 cd/m² (0.04 fL). The luminance measurements for each grid point are in appendix I. Figure 6. Diagram. Location of luminance measurement points to determine adaptation level.
|