U.S. Department of Transportation
Federal Highway Administration
1200 New Jersey Avenue, SE
Washington, DC 20590
202-366-4000
Federal Highway Administration Research and Technology
Coordinating, Developing, and Delivering Highway Transportation Innovations
 |
| This report is an archived publication and may contain dated technical, contact, and link information |
|
Publication Number: FHWA-HRT-10-043
Date: September 2010 |
||||||||||||||||||||||||||||||||||||||||||||||||||||||||||||||||||||||||||||||||
Effects of Yellow Rectangular Rapid-Flashing Beacons on Yielding at Multilane Uncontrolled CrosswalksCHAPTER 3. EXPERIMENT 1METHODThe first experiment took place in St. Petersburg, FL. Participants drove on several routes including: 1st Street N south of 37th Avenue, 58th Street N south of 3d Avenue, 22d Avenue N east of 7th Street, and 31st Street S north of 54th Avenue. The crossing at 1st Street N traverses four lanes and has a posted speed limit of 35 mi/h and an average daily traffic (ADT) of 8,596. This location provides a crossing between two bus stops and includes a median island. The 58th Street N crossing traverses four lanes of traffic and has a posted speed limit of 35 mi/h and an ADT of 19,192. It also has a median island and provides a crossing for residents from a nearby retirement center. The 22d Avenue N crossing traverses four lanes and has a posted speed limit of 35 mi/h and an ADT of 13,524. It is equipped with a center island and provides a crossing for neighbor residents and a dog park. The 31st Street S crossing traverses three lanes at the crossing itself and has a posted speed limit of 35 mi/h and an ADT of 9,600. It has a median island and provides a crossing between an overflow parking lot and a community sports complex. Each of these sites is on a road carrying two-way traffic. All sites have advance yield markings installed and no-pass solid lane lines in advance of the crosswalks to reduce the risk of multiple threat crashes. These features were present during the before-and-after conditions at each site. The treatment in this experiment was a standard pedestrian warning sign with two rectangular yellow LED flashers attached (see figure 1). The warning sign was either yellow or yellow-green depending on whether it was a regular sign or a school crossing sign. Each LED flasher is 6 inches wide and 2.5 inches high and placed 9 inches apart. In addition, each unit is dual indicated, with LEDs on the front and back. Each side of the LED flasher illuminates in a wig-wag sequence (left and then right). The left LED flashes two times in a slow volley each time it is energized (124 ms on and 76 ms off per flash). This is followed by the right LED, which flashes four times in a rapid volley when energized (25 ms on and 25 ms off per flash) and then has a longer flash for 200 ms. This flash pattern violates a person's expectation and results in a pattern that can be described as a "stutter flash effect."(6) In addition to the LED beacons, four signs were installed at each crosswalk. Radio frequency transmitters linked the devices so that depressing any of the pedestrian call buttons activated the flashers on all four signs. A flashing LED display facing the pedestrians flashed to indicate to them that the system was operating. The system also presented an audible message informing pedestrians that the light flashing across the street indicated that the device was operating and instructing them to wait for cars to stop before crossing. This message was also visible on a plaque posted by the call button. Figure 1. Photo. RRFB with two forward-facing LED flashers and a side-mounted LED flasher. For this experiment, a reversal design was used. The design allowed for control of several possible confounding variables. Following baseline conditions, the signs were installed and activated in an alternating series of LED beacons flashing on two side signs and LED beacons flashing on all four signs upon button activation. Each datasheet consisted of 20 pedestrian crossings when vehicles were present. Baseline sessions consisted of four sites, and researchers recorded the first site for 5 datasheets, the second site for 7 datasheets, the third site for 9 datasheets, and the fourth site for 11 datasheets. This allowed for a staged introduction of the treatment across sites. Once the treatment was introduced, two datasheets were collected at each site, with one datasheet used to record only two of the flashers switched on and the second datasheet used to record the other half of the crossing with all four systems switched on. After five sessions of data collection using this procedure, the treatment was switched off, and data were collected for five sessions without device activation (a return to the baseline condition). Next, the treatment was switched on again, and two sets of data were collected for each of the next five sessions, half with only the two curbside devices activated and half with both curbside devices plus the two median devices activated. This produced a total of 82 datasheets comprised of 1,640 crossings. Long-term data were collected approximately 14 months following the initial experimental sessions. Each of the four sites received at least 40 additional crossings during follow-up data collection. During each session, data were collected for 20 pedestrians who crossed the street when vehicles were present, which could have influenced crossing behavior. Most data were collected on weekdays during daylight hours when it was not raining. Probe data were collected at night on a number of sessions. Observers measured the following behaviors:
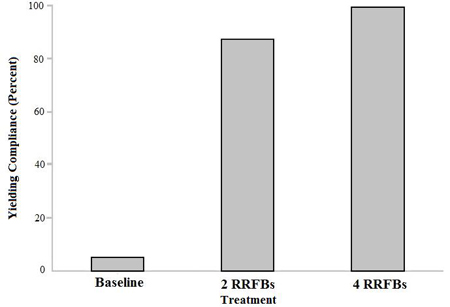
Whether Drivers Yielded to Pedestrians Observers recorded the percentage of drivers who did and did not yield to pedestrians. Drivers were recorded as yielding if they stopped or slowed and allowed pedestrians to cross. Conversely, drivers were recorded as not yielding if they passed in front of pedestrians but would have been able to stop when the pedestrians arrived at the crosswalk. The Institute of Transportation Engineers (ITE) signal formula for determining the duration of the yellow signal phase was used to decide whether a driver could safely stop.(7) Calculating the distance before which a driver can safely stop for a pedestrian is essentially the same problem as calculating the distance that a driver can stop for a traffic signal that changes to red. Traffic engineers use the signal-timing formula, which takes into account driver reaction time, safe deceleration rate, posted speed, and grade of the road.(7) This formula was used to measure the distance beyond which a driver could safely stop for a pedestrian by calculating the yellow time and then multiplying this time by the speed limit to determine a distance. A landmark associated with this distance was identified for each approach to the crosswalk. Drivers who passed this landmark before the pedestrian started to cross could be scored as yielding to pedestrians and not for failing to yield because they might not have sufficient distance to safely stop. Drivers who were located beyond the landmark when the pedestrian entered the crosswalk could be scored as yielding or not yielding because they had sufficient distance to safely stop. When pedestrians first started to cross, only drivers in the first half of the roadway were scored for yielding. Once pedestrians approached the painted median, the yielding behaviors of drivers in the remaining two lanes were scored. This procedure was followed because it conformed to the obligation of drivers specified in the Florida statutes. Staged crossings always followed a specific crossing protocol. First, the staged pedestrian placed one foot in the crosswalk when an approaching vehicle was just beyond the landmark distance (this is the measured distance for the vehicle speed, which ensured a safe stopping distance for drivers traveling at the posted speed). If the driver made no attempt to stop, the pedestrian did not proceed to cross and scored the driver and any subsequent drivers as not yielding. If the driver clearly began to yield and the next lane was free, the pedestrian would begin crossing. The pedestrian always stopped at the lane line and made sure the next lane was clear. If a large gap appeared, the pedestrian finished the crossing. This is essentially the protocol followed by police officers when they conduct pedestrian-crossing-enforcement sting operations. This protocol ensured the safety of the staged pedestrians. Unstaged pedestrian crossings were only scored if the pedestrian initiated a crossing in the same manner as the staged pedestrian by placing at least one foot in the crosswalk. Pedestrians who did not place a foot into the crosswalk were not scored because according to the Florida statutes, drivers are not required to yield unless the pedestrian is in the crosswalk. Conflicts Between Drivers and Pedestrians A conflict between a driver and a pedestrian was recorded whenever a driver suddenly stopped or swerved to avoid striking a pedestrian or whenever a pedestrian jumped, ran, or suddenly stepped or lunged backward to avoid being struck by a vehicle. Conflicts were rare because of the use of the safe crossing protocol. Pedestrian Trapped at the Centerline Pedestrians were recorded as trapped at the center whenever they had to wait at the centerline for 5 s or more because at least one car in the second half of the roadway did not yield. Yielding Distance The distances of yielding drivers were also recorded. Each yielding driver represented a yielding distance. The distance at which a driver yielded was recorded by observing the colored flag the driver yielded behind. A series of small colored utility-like flags were placed alongside the curb in each direction of traffic at 10, 20, 30, 50, 70, and 100 ft. The colors of the flags were red, orange, yellow, green, blue, and red, respectively. This provided a simplified system for recording the distance of yielding drivers in the following divisions: less than 10 ft, more than 10 ft but less than 20 ft, more than 20 ft but less than 30 ft, more than 30 ft but less than 50 ft, more than 50 ft but less than 70 ft, more than 70 ft but less than 100 ft, and more than 100 ft. The distance of a yielding driver was recorded only after the pedestrian had completely cleared the lane and was no longer in the path of the vehicle so that the vehicle posed no threat. Driver Passed or Attempted to Pass Stopped Vehicle Drivers were recorded as passing a stopped vehicle if they passed another driver that was yielding to a pedestrian. Drivers were recorded as attempting to pass a stopped vehicle if they did not yield until after they were alongside or past a yielding vehicle and engaged in hard braking after seeing the pedestrian or if they were behind a yielding vehicle and changed lanes to go around but then yielded. Driver Behind Yielding Vehicle Engaged in Hard Braking A driver was recorded as hard braking if his or her vehicle was behind a yielding vehicle, and the front end of his or her vehicle was observed taking a sudden movement toward the ground. RESULTSDriver Yielding Behavior The first site at 22d Avenue N east of 7th Street had an average baseline driver yielding percentage of 28 percent. The first two-beacon system produced an average yielding percentage of 82 percent, while the first four-beacon system produced an average yielding percentage of 95 percent. The reversal back to two beacons produced an average yielding percentage of 87 percent, and the second treatment of four beacons had an average yielding percentage of 91 percent. The second site at 58th Street N south of 3d Avenue had an average baseline driver yielding percentage of 11 percent. The first two-beacon system produced an average yielding percentage of 78 percent, while the first four-beacon system produced an average yielding percentage of 88 percent. The reversal back to two beacons produced an average yielding percentage of 85 percent, and the second treatment of four beacons had an average yielding percentage of 89 percent. The third site at 1st Street N south of 37th Avenue had an average baseline driver yielding percentage of 18 percent. The first two-beacon system produced an average yielding percentage of 87 percent, while the first four-beacon system produced an average yielding percentage of 90 percent. The reversal back to two beacons produced an average yielding percentage of 84 percent, and the second treatment of four beacons had an average yielding percentage of 90 percent. Night data were also collected at this location. During night collection, there was a baseline driver yielding percentage of 5 percent. The introduction of the two-beacon system increased yielding to 85 percent, while the activation of the four-beacon system further increased yielding to 100 percent. The yielding percentage decreased to 89 percent with the reversal back to the two-beacon system and increased to 99 percent during the last phase of the four-beacon system. The fourth site at 31st Street S north of 54th Avenue had an average baseline driver yielding percentage of 15 percent. The first two-beacon system produced an average yielding percentage of 67 percent, while the first four-beacon treatment produced an average yielding percentage of 79 percent. Yielding averaged 79 and 81 percent during the final two-beacon and four-beacon conditions, respectively. The results showed an average yielding percentage of 15 percent for the baseline, 73 percent for two systems, and 80 percent for four systems. A two-sample t-test for matched pairs was performed to test the significance of the reported yielding percentages between the two- and four-beacon systems. The test showed significance at the 0.05 level. Figure 2 illustrates the average yielding percentage per condition at night at one site where night data were collected. Figure 2. Graph. Yielding compliance for three conditions during nighttime observations at the third site at 1st Street and 37th Avenue S. The data collected during each of the follow-up sessions show that the RRFB devices were able to maintain a high level of driver yielding behavior during the follow-up condition. The first original site at 22d Avenue produced an average yielding compliance of 99 percent for the four-beacon treatment. The second site at 58th Street N had an average yielding compliance of 90 percent. The third site at 1st Street N produced an average four-beacon yielding compliance of 100 percent. The final site at 31st Street S had an average yielding compliance of 93 percent during the four-beacon system follow-up evaluation. The third site was evaluated during nighttime conditions as a follow-up to previous night evaluations. This location was evaluated for 60 consecutive crossings with an average yielding compliance of 97 percent. Brief reversals back to the baseline for the above follow-up locations produced low yielding compliances similar to pre-installation. These data are shown in table 1 and figure 3. Table 1. Average yielding compliance per condition including follow-up for each site.
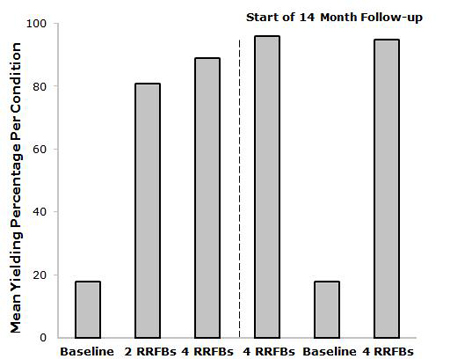
Figure 3. Graph. Mean yielding percentage for each condition. Figure 3 represents all of the data from the four experimental sites averaged together per treatment condition. The data to the right of the dashed line show yielding during the follow-up data collected 14 months after installation. Distance of Driver Yielding Behavior The majority of yielding across all four sites during each condition occurred at the 30- to 50-ft interval. Yielding increases of 3.1 and 8 percent occurred at more than 30 ft over the baseline for the two-beacon and four-beacon system treatments, respectively. Yielding doubled at more than 100 ft. The total average yielding distances for all four sites (more than 30 ft) is shown in table 2. The presence of advance yielding markings at all sites throughout the study likely influenced yielding distance. Table 2. Average percentage of drivers yielding in each distance category for each experimental condition.
Driver Passed or Attempted to Pass Stopped Vehicle During the baseline across all four sites, there was a total of 48 passes or attempted passes. There were only eight of these occurrences for both two- and four-beacon systems combined during all of the treatment phases. There were no significant results reported for evasive pedestrian-vehicle actions such as pedestrians trapped in a median or drivers behind a yielding vehicle slamming on their brakes. Both observers stood in such a way that they had the same vantage point, but they were not able to see what the other observer recorded. A measure of interobserver agreement was computed by dividing the number of times both observers agreed on the occurrence of each pedestrian behavior by the number of times they agreed plus the number of times they disagreed on its occurrence. The interobserver agreement on the occurrence of a yielding behavior averaged 92 percent with a range of 78 to 100 percent. The interobserver agreement on evasive conflicts was 100 percent. In addition, the interobserver agreement averaged 100 percent on whether the pedestrian was trapped in the center of the road, averaged 100 percent on vehicle passes or pass attempts, averaged 100 percent on vehicles that slammed on brakes, and averaged 95 percent on stopping distance. |
||||||||||||||||||||||||||||||||||||||||||||||||||||||||||||||||||||||||||||||||