U.S. Department of Transportation
Federal Highway Administration
1200 New Jersey Avenue, SE
Washington, DC 20590
202-366-4000
Federal Highway Administration Research and Technology
Coordinating, Developing, and Delivering Highway Transportation Innovations
 |
| This report is an archived publication and may contain dated technical, contact, and link information |
|
Publication Number: FHWA-HRT-98-107
Date: February 1998 |
Capacity Analysis of Pedestrian and Bicycle FacilitiesRecommended Procedures for the "Pedestrians" Chapter of the Highway Capacity Manual PDF Version (596 KB) PDF files can be viewed with the Acrobat® Reader®
3. SERVICE MEASURES OF EFFECTIVENESS3.1 Uninterrupted Pedestrian Facilities
Sidewalks and Walkways TABLE 2 Existing HCM walkway Level of Service (LOS) criteria
SOURCE: TRB, 1994. Alex Sorton of Northwestern University suggests that the current LOS A space requirement is excessive, and should be reduced from 130 ft2/ped (12 m2/ped) to 60 ft2/ped (5.6 m2/ped). Indeed, the Interim Materials on Highway Capacity (TRB, 1980) recommended an even lower space threshold (3.7 m2/ped or 40 ft2/ped) than Sorton's recommendation. This report has stated earlier that capacity probably occurs around 75 peds/min/m, somewhat lower than HCM values. As a point of comparison, Table 3 compares LOS values in the HCM with those reported from other researchers. Tanaboriboon and Guyano (1989) developed LOS standards for Bangkok, Thailand. Although probably not useful for most areas of the United States, their data in the table highlight the importance of cultural values and physical characteristics on LOS breakpoints. The authors note that one result of the difference between Thai and American LOS standards is that pedestrian facilities in Thailand can accommodate higher flows at a given LOS. Stating that capacity limitations do not normally dominate pedestrian facility concerns, Brilon stated that Germany's revised pedestrian LOS standards will have breakpoints based on density (1994). The boundaries for Polus et al.'s work correspond to the three regimes of pedestrian flow reported by those researchers. TABLE 3 Walkway Level of Service (LOS) thresholds by space (m2/ped) and flow rate (ped/m/min)
SOURCES: TRB, 1994; Fruin, 1971; Pushkarev and Zupan, 1975b; Brilon, 1994; Polus et al., 1983; Tanaboriboon and Guyano, 1989.
TABLE 4 Recommended HCM walkway Level of Service (LOS) criteria.
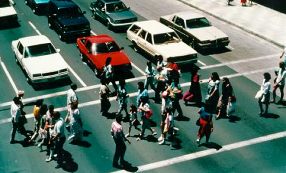
Platoons. The companion volume, Literature Review for Chapter 13, Pedestrians, of the Highway Capacity Manual noted the effect of platoons on walkway flow. Table 5 summarizes the initial research on platoons. Pushkarev and Zupan (1975b) note that earlier research found the ability to pass slow-moving pedestrians to be relatively unrestricted at space modules above 3.3 m2/ped, difficult between 1.7 and 3.3 m2/ped, and essentially impossible below 1.7 m2/ped. Pushkarev and Zupan also compared average flow rates with possible flow in platoons. They found no difference between the flow conditions at any service level, except at that point in "Impeded" flow (approximately LOS B) when platoons begin (1975b). The Interim Materials on Highway Capacity (TRB, 1980) contained platoon flow criteria. This work, relying on the "rule of thumb" mentioned earlier, simply rewrote the recommended walkway values up one level for platoons. The current HCM, which does not contain a platoon flow service level table, uses different walkway values for average flow rate and space at most service levels than those in the Interim Materials. Therefore, one cannot simply apply the values listed in the Interim Materials to the current HCM. One can develop platoon flow LOS criteria based on a synthesis of the relationship between average and platoon flow described in the companion Literature Review, the existing HCM walkway standards for midrange LOS values (TRB, 1994), and the earlier work of Pushkarev andZupan (1975b) for extreme values. For LOS A, this report uses Pushkarev and Zupan's relationship between average and platoon flow (Figure 20 in the Literature Review) and defines this breakpoint to be just before the discontinuity, at 1.6 ped/min/m (0.5 ped/min/ft), identical to the "Open" flow of Pushkarev and Zupan. For LOS B through D, this study applies metricized "rule of thumb" to 1994 HCM walkway values, by subtracting 13 ped/min/m from walkway flow rates. For LOS E, and thus LOS F, this report uses the highest platoon flow rate found by Pushkarev and Zupan, 59 ped/min/m. The resulting values, shown in Table 6, provide a sound basis for determining the level of service experienced by people who travel in platoons, such as the pedestrians shown in Figure 6.
TABLE 5 Platoon-adjusted walkway Level of Service (LOS) thresholds.
TABLE 6 Recommended HCM platoon-adjusted walkway Level of Service (LOS) criteria.
Transportation terminals provide a special case of platoon flow. Davis and Braaksma (1987) analyzed the pedestrian flow within an airport corridor by a "floating pedestrian" method, in which the surveyor measures traffic parameters from within the pedestrian stream. Table 7 shows the LOS standards developed by the authors for platoon flow in transportation terminals. By implication, the use of the term "transportation terminal" refers to both an airport and to those other locations with tendencies for the platooning behavior common in airport walkways. Note that, although maximum speed and space occur at the highest LOS (A+ in the table), the maximum flow occurs at the boundary between LOS D and E. Also of note, the extremely high flows in these facilities warrant much less restrictive service criteria. To facilitate incorporation into the HCM, one can eliminate or consolidate one of their seven service levels (Table 8). This report consolidates Davis and Braaksma's LOS A and B into LOS B and redesignates LOS A+ as LOS A. In effect, this expands the transportation terminal LOS B to a range roughly coincident with platoon-adjusted walkway criteria LOS E. In addition, LOS E reflects the capacity thresholds suggested earlier.
TABLE 7 Level of Service (LOS) thresholds for platoon flow in transportation terminalsa.
TABLE 8 Recommended HCM pedestrian Level of Service (LOS) criteria for platoon flow in transportation terminalsa.
Stairs. To allow for the determination of pedestrian arterial ("network" in this review) LOS, Virkler utilized a 20–year–old proposed ITE stairways standard (ITE, 1976), which provided space and flow values at various stairway LOS. Virkler states that he modified this standard somewhat "to ensure that the basic equation of traffic flow is satisfied," although this review of his research could discern no difference between his values and the space and flow values given in the ITE stairways standard. Table 9 shows the recommended HCM pedestrian LOS criteria. The values reflect ITE's flow values, Fruin's (1971) original breakpoints for stairway level of service, and Virkler's values for speed and volume–capacity ratio. Note that the LOS E values of 49 and 56 ped/min/m for Virkler and Fruin, respectively, are noticeably less than the 62 to 73 ped/min/m capacity ranges found in the Hong Kong and London transit systems listed earlier by Lam et al. (1995).
TABLE 9 Recommended HCM pedestrian Level of Service (LOS) criteria for stairs.
Crossflows. A crossflow is a pedestrian flow that is roughly perpendicular to and crosses another pedestrian stream. In general, one refers to the smaller of the two flows as the crossflow. Khisty (1982) notes that pedestrian crossflows occur in hallways and corridors and are "ubiquitous." Table 10 notes his suggestions for acceptable criteria regarding corridor crossflows. These values correspond roughly with the bottom half of HCM walkway LOS E; by terming them minimums and maximums, he implies that his values establish LOS boundaries for crossflows.
TABLE 10 Recommended capacity thresholds for crossflows.
Off–Street Paths Shared Pedestrian–Bicycle Paths. Virkler and Balasubramanian (1997) describe a 1995 study by Hein Botma of shared pedestrian–bicycle facilities in The Netherlands. This study develops LOS guidelines for both pedestrians and bicyclists on the basis of the frequency of passing (same direction) and meeting (opposite direction) other users on the trail. Botma characterizes these two occurrences as "events," with an overtaking equal to one event and a meeting equivalent to one–half of an event. Under this framework, LOS F refers to "very bad quality of traffic operation," not congestion (Botma, 1995). More specifically, it refers to a situation where an average user experiences "hindrance" more than 1.0 times in a 1–km trail segment. Virkler and Balasubramanian note that, for one–way paths, pedestrians seldom overtake other pedestrians, and thus the LOS afforded a pedestrian on a shared path depends on the frequency with which an average pedestrian would be overtaken by bicyclists. In Botma's discussion of his own work (1995), he poses the question of whether it is justified to neglect hindrance due to pedestrian interactions. As the authors of this report have observed moderate pedestrian–pedestrian hindrances on various mixed–use trails, it is likely that Botma's assumption of negligible pedestrian interactions is not entirely correct. Botma's expression describing the total number of overtakings of pedestrians by bicyclists, Nf/s, is: Nf/s = X T Qf Qs (1/Us – 1/Uf) where:X = length of site, m; T = time period considered, s; Qf = flow of faster group in subject direction, bicyclists/s; Qs = flow of slower group in subject direction, pedestrians/s; Uf = mean speed of faster group, m/s (for bicyclists); and Us = mean speed of slower group, m/s (for pedestrians). Using an average pedestrian speed of 1.25 m/s and an average bicyclist speed of 5 m/s, Botma developed a LOS table for pedestrians on one–way, two–lane shared–use paths. Table 11, which converts "frequency" of events into period between events to eliminate fractions, provides Botma's LOS thresholds.
TABLE 11 Level of Service (LOS) thresholds for one–way, two–lane, mixed–use paths.
For two–way trails, Botma states that pedestrians still seldom overtake other pedestrians, and thus the LOS afforded a pedestrian on a shared path depends on the frequency with which an average pedestrian experiences meetings of and overtakings by bicyclists. Using the speed assumptions listed above for one–way paths, Botma established a table for pedestrians traveling on two–lane, two–way, shared–use paths. Table 12 , again substituting period for frequency, shows Botma's service levels. As an aside, if one applied either of the tables to an exclusive pedestrian trail, one would always have a service level of A, regardless of pedestrian volume, since the tables depend entirely on bicycle volume. Therefore, Virkler and Balasubramanian's implication to use existing walkway standards certainly seems more reasonable than the use of Botma's method for an exclusive pedestrian facility. TABLE 12 Level of Service (LOS) thresholds for two–way, two–lane, mixed–use paths.
Virkler and Balasubramanian (1997) studied flow characteristics on two–way, shared–use trails in both Columbia, Missouri, and Brisbane, Australia. They found bicycling speeds of 5.95 m/s and 5.76 m/s in Missouri and Australia, respectively, both of which were somewhat higher than the 5 m/s speed used by Botma. However, Botma uses 5 m/s for simplicity; field studies of trails in The Netherlands show slightly higher average speeds of 5.28 m/s (Botma, 1995). Also, they found that the standard deviations of bicycling speeds, 2.1 m/s for Missouri and 1.33 m/s for Australia, were much higher than the 0.83 m/s average speed reported by Botma. Finally, they observed average "hiking" (presumably walking) speeds of 1.59 and 1.56 m/s in Missouri and Australia, respectively. Upon comparison between predicted (by Botma's tables) and observed values, Virkler and Balasubramanian found that their results generally supported the framework espoused by Botma for bicyclists overtaking pedestrians. Although not mentioned by Virkler and Balasubramanian (1997), if one rounds the Missouri average speed measurements to the nearest 0.5 m/s (i.e., rounding bicycling speeds from 5.95 m/s to 6 m/s and walking speeds from 1.59 m/s to 1.5 m/s), then the resulting table of values for both one– and two–way trails will be identical to that by Botma. Therefore, in so far as Botma's assumptions are correct, one can directly apply Botma's pedestrian LOS tables listed above to at least one American mixed–use trail.
TABLE 13 Recommended HCM pedestrian Level of Service (LOS) criteria for two–lane, mixed–use paths.
3.2 Interrupted Pedestrian FacilitiesSignalized Crossings
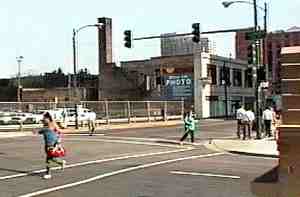
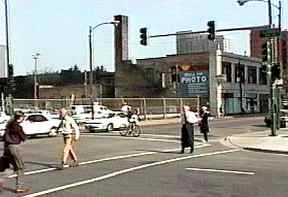
Overview of Noncompliance. The pedestrian literature contains several articles dealing with pedestrian disobedience of traffic signals. In addition, anecdotal evidence suggests that assuming legal behavior will not sufficiently resemble reality for analysis purposes. Therefore, before considering a delay–based service measure of effectiveness in detail, one should examine the effects of pedestrian noncompliance. Figures 7 and 8 are illustrative of the problem. Middleton (1981), bemoaning the levels of pedestrian accidents in Australia and the United States, notes the presence of what he terms an "over–supply of pedestrian facilities at signalized intersections." He notes that safety–motivated pedestrian control signals at signalized intersections may actually reduce safety by encouraging noncompliance to avoid the "largely unnecessary delay imposed" on pedestrians. Indeed, the author observed disobedience rates as high as 70 percent in Queensland, Australia. Stating that the "very existence of this widespread lawbreaking in the community should be sufficient evidence that the system needs attention," he reiterates an earlier suggestion by F.R. Fulsher to change the legal meaning of the DON'T WALK signal to "Yield to Vehicles." In so far as the resulting change in pedestrian signals from regulation to guidance may discourage avoidance of pedestrian signals, he hypothesizes that safety improvements may result.
The Literature Review for Chapter 13, Pedestrians, of the Highway Capacity Manual included a study by Rouphail (1984) noting the preference of pedestrians for midblock crossings. However, when a pedestrian crossing is displaced from the intersection, the increase in travel path for many users walking along the cross–street may tend to breed signal noncompliance in some situations, as people tend to use the intersection crosswalks regardless of signal indication (Pretty et al., 1994). Hunt and Griffiths (1991) note that pedestrians experience very little delay at zebra crossings, since they always have the right–of–way. However, they note that pedestrians who are unable or unwilling to accept gaps in traffic during the DON'T WALK period at the signalized pelican (pedestrian light controlled) midblock crossings in Britain incur substantial delay. They suggest that pedestrians crossing illegally at signalized intersections could be less safe than those crossing at random points along a roadway since drivers approaching a green signal will not expect to have to yield to a pedestrian. Griffiths et al. (1984a) observed during their field studies that significant numbers of pedestrians are prepared to begin crossing during either flashing or steady DON'T WALK pedestrian indications. They noted that noncompliant behavior occurred almost exclusively when two–way conflicting vehicle flows were below 1,500/h. Gordon and Robertson (1988) noted that driver noncompliance with traffic signals is a serious problem as well, particularly at low–volume intersections. They recommend a combination of higher enforcement levels, stiffer violation penalties, education of the public, and the removal of unnecessary informational or regulatory control devices adjacent to intersection approaches. Knoblauch, Pietrucha, and Nitzburg (1996) noted that, of the pedestrians they observed during their field study of intersections in eastern cities, those who crossed against the signal (i.e., noncompliant pedestrians) tended to walk faster than those who crossed legally. A study of Hong Kong pedestrians noted that pedestrians walk faster during the red phase at signals, confirming the ubiquity of noncompliant pedestrians (Lam et al., 1995). The authors report an average noncompliant pedestrian crosswalk speed of 1.5 m/s in Hong Kong crosswalks, much higher than the 1.27 m/s level observed at those facilities during the WALK indication. Virkler (1997a) noted that, based on his observations of intersections in Brisbane, Australia, pedestrians typically treat about 69 percent of the flashing DON'T WALK signal as an effective WALK. He discerns two groups of noncompliant pedestrians: "jumpers," who start crossing before the WALK indication begins, and "runners," who begin crossing after the flashing DON'T WALK signal commences. Between the two groups, he observed that the runners saved over seven times as much delay per person as jumpers, so he focused on the behavior of the former group. North Carolina State University (NCSU) also noticed similar noncompliant behavior at several sites during its field study of American intersections. NCSU calculated that pedestrians typically treated the first 5 s of flashing DON'T WALK as a de facto WALK signal indication. Indeed, the NCSU data–collection team observed some crossings during both flashing DON'T WALK (which typically coincides with the latter part of the vehicular green) and the vehicular clearance interval. Milazzo II (1996) adjusted his volume–occupancy data collection framework to allow for pedestrian occupancy of the crosswalk at any time during the pedestrian clearance interval. Viney and Pretty (1982) examined pedestrian and vehicle interactions at Brisbane, Australia, intersections. They observed an average WALK "extension time" (i.e., de facto WALK) of 1.95 s with a standard deviation of 2.7 s. They used 2 s as an allowance for disobedient pedestrians. It is important to note that changes in signal timing can affect noncompliance. For example, the slight increase in green time and cycle length that may occur under the assumption of reduced walking speeds will increase pedestrian delay and probably increase pedestrian noncompliance. Of course, the presence of excessive cycle lengths and/or unnecessary phases also causes pedestrian delay and noncompliance. Some jurisdictions use "early release" signal timing, where pedestrians receive the WALK before the concurrent vehicles receive the green, in an effort to reduce pedestrian delay. Regardless of the phasing scheme chosen, most facility users are local pedestrians who will learn the signal timing and try to reduce their own delay. In summary, any delay measure to pedestrians should include some mechanism for considering noncompliance. Table 14 summarizes the findings of the last three research groups mentioned; coincidentally, two of the three groups examined downtown Brisbane, Australia. All of this empirical research seems to indicate that pedestrians, recognizing the margin of safety built into the pedestrian clearance interval, treat the initial part as an effective walk time. TABLE 14 Selected de facto WALK extension times.
Delay. Currently, no LOS standard based on pedestrian delay at signalized intersections exists in the HCM. However, the HCM does incorporate vehicular delay at these facilities into its LOS criteria for vehicles at signalized intersections (Table 15). The Australian signalized intersection software package SIDRA considers pedestrian delay (Akçelik, 1989) as a performance measure. The following paragraphs, which give the results of several delay studies, provide a useful frame of reference for establishing a suitable pedestrian delay criteria at signalized crossings. TABLE 15 Existing HCM signalized intersection Level of Service (LOS) criteria.
Noland (1996) states that any street crossing, regardless of the control device used, will result in some delay to pedestrians due to caution before entering the crosswalk. He also argues that, since average delay to pedestrians is frequently ignored at signals, total "costs to society" may rise due to unfavorable timing patterns. He notes that, if pedestrian green phases remain constant while cycle lengths increase, average delay to pedestrians can increase quite rapidly. Griffiths et al. (1984a) examined pedestrian delay at both signalized and unsignalized crossings in Great Britain. Table 16 shows the results. TABLE 16 Pedestrian and vehicle delay at midblock crossings in Great Britain.
The authors note that Great Britain began installing unsignalized pedestrian crossings in 1935, with signalized pelican installations commencing in 1969. The latter device was introduced to provide the "flexibility of a Zebra" with the "positive command to drivers to stop." Along these lines, Dunn and Pretty (1984) state that, provided that pelicans are a legal device in the jurisdiction, one should always install a pelican crossing over a standard pedestrian signalized crossing, because they provide reduced vehicular delay with no detriment to pedestrian delay. At a field survey of fixed–time signalized crossings in Great Britain, Griffiths et al. (1984a) found significant increases in pedestrian delay for increases in vehicular delay over a wide (400–1,400 veh/h) range. They did not observe any additional effect on pedestrian delay at signalized crossings with vehicle actuation over these volume levels. MacLean and Howie (1980) examined the performance of pedestrian crossings in Victoria, Australia. They found that mean pedestrian delay was 17 s at signalized crossings. Table 17, based on anecdotal evidence and empirical observation, provides some maximum delay thresholds recommended by various researchers for signalized intersections. Dixon (1996) terms the choice of 40 s for Gainesville, Florida, a compromise value. Kaiser (1994) notes the increase in pedestrian impatience and risk–taking behavior beyond 30 s of delay; Dunn and Pretty (1984) also mention that pedestrians become increasingly impatient when delayed beyond 30 s. Hunt and Griffiths (1991), noting that risk–taking behavior increases with pedestrian delays of 30 s or more, state that the vehicle precedence time should not exceed 40 s at a pelican crossing in Great Britain. Of course, with sufficiently high conflicting vehicle volume, pedestrians can face delays above 60 s (Dunn and Pretty, 1984). Under these conditions, pedestrian compliance increases, because sufficient gaps do not exist in the vehicle stream for pedestrians to utilize. TABLE 17 Selected thresholds for maximum pedestrian delay at signalized intersections.
TABLE 18 Recommended HCM pedestrian Level of Service (LOS) criteria for signalized crossing delay.
Space. As was the case with walkways, the current HCM uses pedestrian walkway space criteria as the primary MOE for street corners. However, in this case, the methodology centers on a validated "time–space" framework developed by Fruin and Benz (1984). It provides average space values of 5 ft2/ped in a queue and average time values of 3 to 5 s for moving through the corner. The existing HCM also offers a crude method of describing the effect of turning vehicles on pedestrians at intersections, by assuming a swept–path for a vehicle and decrementing the crosswalk time–space available to pedestrians. Indeed, despite the legal precedence of pedestrians over vehicles in the crosswalk, Virkler (1997c) found that vehicles occasionally occupy a portion of the crosswalk during the pedestrian phase.
Unsignalized Crossings. Delay. The current HCM does not have a method for analyzing unsignalized crossing facilities. However, the HCM unsignalized intersection chapter does provide a mechanism for computing vehicular delay at these locations. Table 19 provides delay thresholds for vehicles at (two– or all–way) stop–controlled intersections, the most common unsignalized intersection types in the United States. TABLE 19 Existing HCM unsignalized intersection Level of Service (LOS) criteria.
As in the signalized intersection case, it is useful to examine existing research on pedestrian delay at unsignalized crossings to gain a feel for actual delay levels at these facilities. Dunn and Pretty (1984) examined pedestrian and vehicle delay at Australian and New Zealand midblock crossings. They neglected pedestrian delay at unsignalized (zebra) crossings, however, effectively terming it negligible. They therefore focused solely on vehicle delay for the unsignalized case. MacLean and Howie (1980) examined the performance of pedestrian crossings in the Australian state of Victoria. They found that mean pedestrian delay was 1.7 s at unsignalized midblock crossings in Victoria, dramatically (and somewhat surprisingly) less than the 17–s mean delay at signalized midblock crossings. Mean pedestrian delay at zebra crossings was 2.3 s in metro Melbourne but negligible in rural areas. At low to moderate vehicle volumes, Griffiths et al. (1984a) found little pedestrian mean delay at unsignalized crossings. They also noted that average pedestrian delay decreases as pedestrian flow increases because more pedestrians can take advantage of "an established pedestrian precedence." Song, Dunn, and Black (1993) examined the interaction of pedestrians and vehicles for pedestrians crossing at least 10 m away from a designated crossing. The authors collected pedestrian gap acceptance characteristics at several streets in Sydney, Australia. They divide pedestrian crossing tactics into four categories: "double–gap," "risk–taking," "two–stage," and "walk'n–look," each of which serves to minimize crossing time while still providing a degree of safety. Their approach assumes that each crossing tactic, rather than each person, has critical gaps for the near lane, far lane, and combined traffic streams associated with it. A corollary is that different demographic groups will typically use a particular crossing tactic; for example, disabled and elderly pedestrians, and mothers with children, will often use the cautious "double–gap" tactic. The "double–gap" tactic involves identifying a gap of size a in the near stream and 2a in the far stream, in order to ensure successful crossing of the entire street in one continuous motion. The "risk–taking" tactic involves selecting individual gaps of a in each of the lane–by–lane traffic streams. A "two–stage" crossing involves the use of a median as a refuge. The "walk'n–look" tactic involves walking parallel to the street in the direction of desired travel until a suitable gap arrives, then crossing using one of the previous three tactics. Users of this tactic can essentially eliminate crossing delay under low to moderate conflicting vehicle volumes; in addition, the authors note that by minimizing interaction with vehicles, little accident risk exists for users of this tactic (Song et al., 1993.) Palamarthy et al. (1994) describe available crossing tactics to pedestrians at signalized intersections analogous to those described by Song et al. (1993), except that a lane–by–lane crossing substitutes for the "walk'n–look" at these locations. Palamarthy et al. found that pedestrians are more likely to look for an overall gap rather than separate gaps in individual traffic streams. The authors found mean critical gaps of 3.33 s for the near traffic stream under all crossing tactics, 7.14 s for the far stream under a double–gap crossing, 3.58 s for the far stream under a risk–taking crossing, and 3.81 s for the far stream under a two–stage crossing.
TABLE 20 Recommended HCM pedestrian Level of Service (LOS) criteria for unsignalized crossing delay.
Finally, the HCM contains no provision for a space–based measure of effectiveness for unsignalized crossings. In this case, the periodic element found at a signalized intersection is not as pronounced, and the delay to pedestrians predominates.
Other Waiting Areas Space. The current HCM uses pedestrian space as the primary MOE. Based on average pedestrian space, personal comfort, and degree of internal mobility, capacity here is 2 ft2/pedestrian (0.19 m2/ped). The values of space for queueing or waiting areas at each level of service shown in Table 21 vary from 10 to 50 percent of the space required for circulation on walkways. TABLE 21 Existing HCM queueing area Level of Service (LOS) criteria.
3.3 Pedestrian NetworksThe German Highway Capacity Manual recommends a maximum pedestrian delay of 90 s total for a series of signals (Brilon, 1994). Virkler (1996) notes that the HCM's arterial analysis chapter (11) uses overall average travel speed as the measure of effectiveness in determining LOS. He recommends use of average travel speed for pedestrian arterials (routes) as well. Table 22 compares his recommended travel speed values with appropriate speed values from the HCM's vehicular arterial analysis chapter. Virkler's values represent an adaptation of pedestrian walkway and signalized intersection vehicular delay LOS standards. For a given LOS, the pedestrian arterial values represent an average travel speed, assuming the average walkway speed at that LOS with a delay over a 100–m length equal to that signalized intersection LOS. Examination of the above criteria reveals that one would have to maintain normal walking speeds throughout the entire arterial (i.e., essentially no stopping at signals or other nodes) in order to achieve the upper levels of service. TABLE 22 Comparison of existing HCM vehicle arterial Level of Service (LOS) criteria with pedestrian arterial threshold proposals by both Virkler and North Carolina State University.
One alternative method could be to determine the minimum travel time at a given LOS, compare this with the actual travel time (i.e., incorporating any delay), and define a pedestrian network LOS based on this ratio. The following equation shows this:
With this expression, a trip with no delay will have a time ratio of 1.0, while a trip taking four times as long as the minimum will have a time ratio of 0.25. In addition, this formulation allows for calibration of minimum times at a local site. However, Virkler's proposal offers the convenience of a fixed-speed criterion for each service level.
|
|||||||||||||||||||||||||||||||||||||||||||||||||||||||||||||||||||||||||||||||||||||||||||||||||||||||||||||||||||||||||||||||||||||||||||||||||||||||||||||||||||||||||||||||||||||||||||||||||||||||||||||||||||||||||||||||||||||||||||||||||||||||||||||||||||||||||||||||||||||||||||||||||||||||||||||||||||||||||||||||||||||||||||||||||||||||||||||||||||||||||||||||||||||||||||||||||||||||||||||||||||||||||||||||||||||||||||||||||||||||||||||||||||||||||||||||||||||||||||||||||||||||||||||||||||||||||||||||||||||||||||||||||||||||||||||||||||||||||||||||||||||||||||||||||||||||||||||||||||||||||||||||||||||||||||||||||||||||||||||||||||||||||||||||||||||||||||||||||||||||||||||||||||||||||||||||||||||||||||||||||||||||||||||||||||||||||||||||||||||||||||||||||||||||||||||||||||||||||||||||||||||||||||||||||||||||||||||||||||||||||||||||||||||||||||||||||||||||||||||||||||||||||||||||||||||||||||||||||||||||||||||||||||||