Logistics and Infrastructure: Challenges and Opportunities
Harry Caldwell
Federal Highway Administration
Office of Freight Management and Operations
Objectives
- logistics and transportation infrastructure
- infrastructure and economic development
- challenges facing future infrastructure development and use
- approaches to problem solving
Challenges Placed on Infrastructure
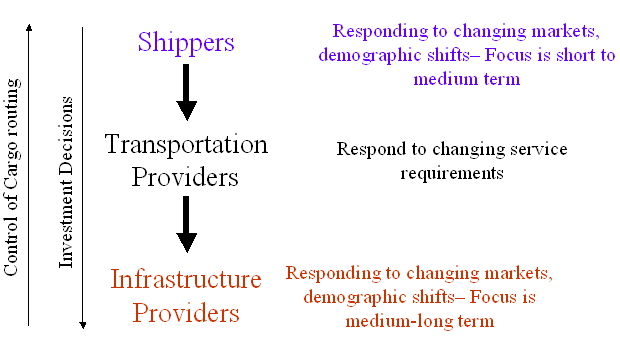
Logistics Productivity Factors
- Product Supply Chain Concept
- Government Regulation
- Equipment Carrying Capacity
- Mode Optimization
- Global Logistics & Technology
- Inventory Reduction
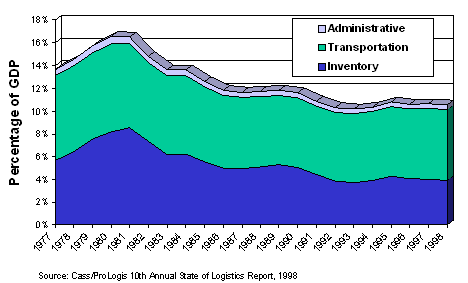
Logistics Expenditures and GDP
After a long improvement, expenditures have stalled at about 10%
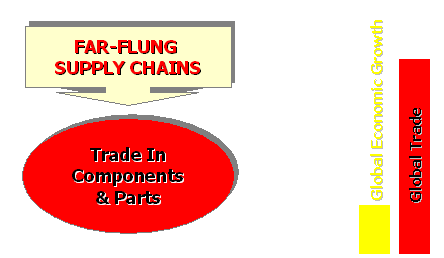
Trade Outpacing Economic Growth
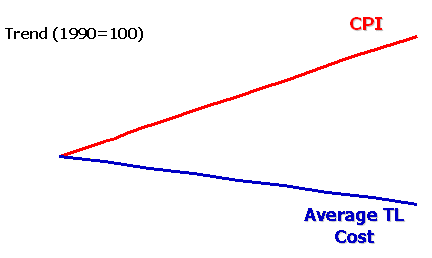
Trucking Costs Have Dropped
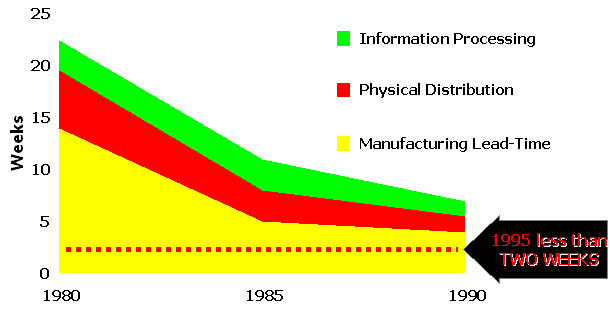
Order Cycle Time Development
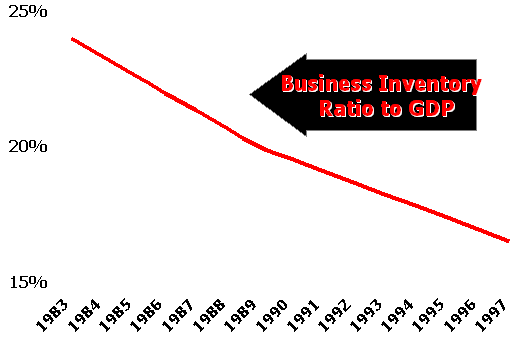
Inventories Are Shrinking
Freight Trends and Issues: Themes
Presentation of trends and issues is organized around three sets of themes
- Markets/Logistics (demand)
- From national markets to global markets
- From a manufacturing to a service economy
- From push to pull logistics systems
- Carriers/Transportation Systems (supply)
- From modal fragmentation to cross-modal coordination
- From system construction to system optimization
- From DoD stovepipes to "Focused Logistics"
- Public Policy
- From economic deregulation to safety regulation
- From modal to multi-modal surface transportation policy
- From low visibility to environmental accountability
Trends Shaping Demand for Transportation Services
- Continuing evolution of the U.S. into a service and information economy
- Increasing domestic, NAFTA, and global trade
- Outsourcing for comparative economic advantage in production
- Customer-driven shift to customized, mass-market products and services
- Manufacture-to-order and time-definite-delivery
- Emergence of e-commerce and e-business
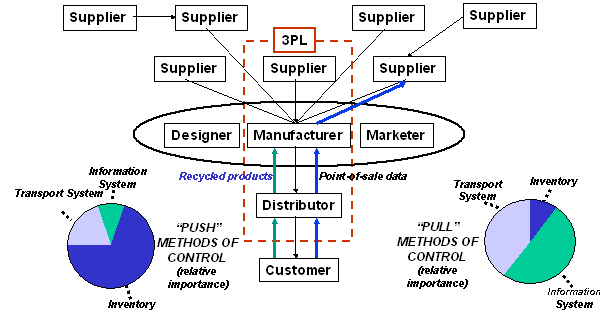
From Push to Pull Logistics Systems
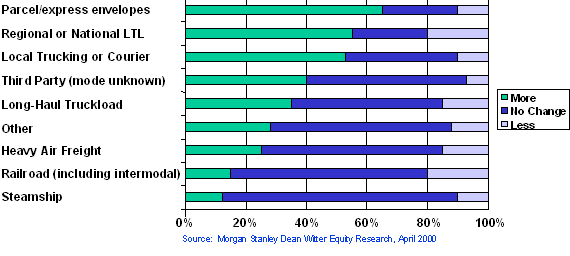
E-Commerce and Freight Movement
Shippers expect to use more parcel/express, LTL, local trucking, and /courier services
 \
\
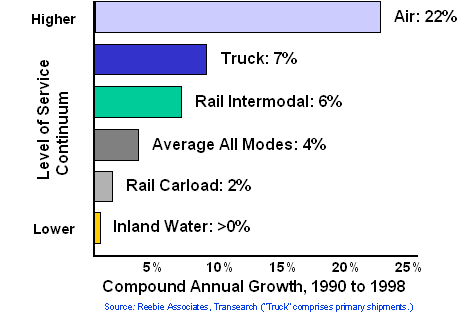
Modal Growth in Tonnage
Demand for reliable, high-speed service is growing
Transportation Infrastructure is:
An Asset to contain costs and make products more competitive
Are we using it wisely?
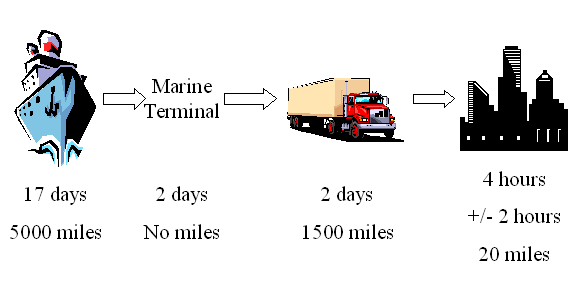
Infrastructure Concerns add to delays and unnecessary costs
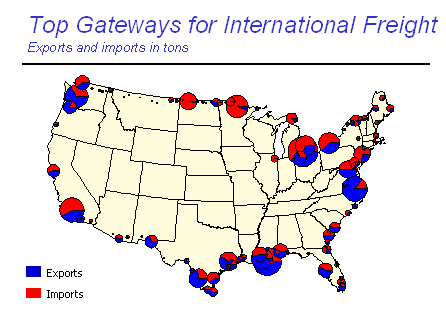
Top Gateways for International Freight Exports and imports in tons
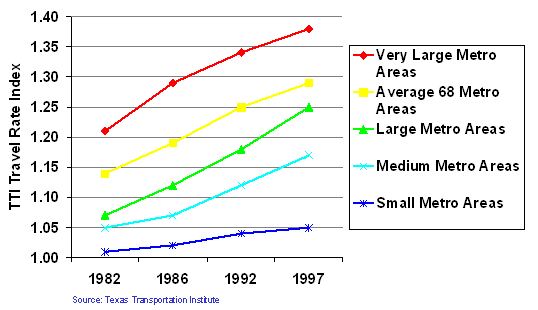
Travel Rate Congestion Index
The average percentage growth in peak-period-travel-time compared to off-peak-travel-time in 68 large metro areas was 81%
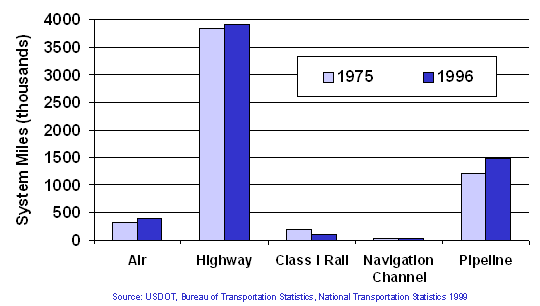
System Mileage within the U.S.
Highway and air increased modestly; Class I rail lost mileage
NHS Intermodal Connectors -- Infrastructure Constraints
NHS Connectors
- Poor physical condition
- Port access issues
- "orphan status"
- inadequate coordination of investment strategies
- need for intermodal impact statements
More Traffic on the Highways
Daily Vehicle Miles of Travel per Lane-Mile, 1987-1997
| |
1987 |
1997 |
Annual Rate of Change |
| Rural |
| Interstate |
3,530 |
4,952 |
3.40% |
| Other Principal Arterials |
2,090 |
2,522 |
1.90% |
| Urban |
| Interstate |
11,230 |
13,696 |
2.00% |
| OtherFreeway |
9,240 |
10,620 |
1.40% |
| Other Principal Arterials |
5,010 |
5,768 |
1.40% |
California Motor Carriers' Perception of Congestion and Response
Carriers are investing in technology to counter increasing congestion
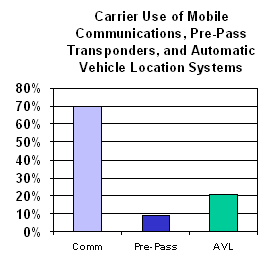
- 82% see congestion as serious or critical
- Costs of slower speed
- Scheduling problems
- Driver morale
- Accidents & insurance
- Higher fuel & maintenance
- 85% see congestion worsening over next five years
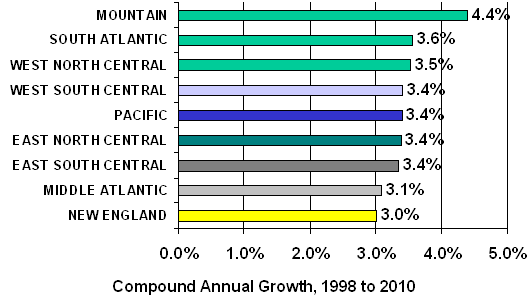
Regional GNP Growth Rates to 2010
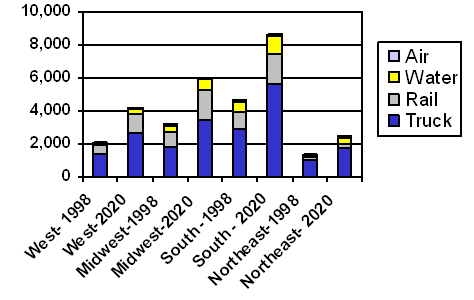
Growth by Major Region and Mode
(Tons in Millions)
Capacity and the Nation's Infrastructure
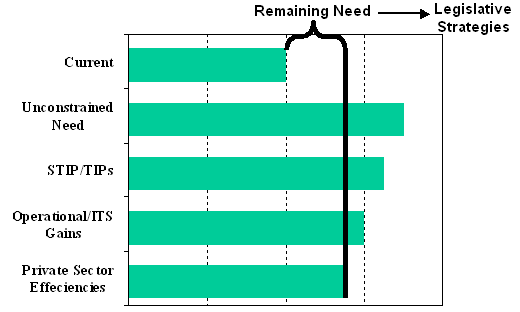
From System Construction to System Optimization
- Highway congestion, especially landside access to ports and terminals
- Insufficient rail and intermodal terminal capacity
- fragmented operational strategies; immature national and international ITS and automated identification standards
- Shortages of labor and skills
- Limitation of public and private finance for system maintenance and new capacity
- Public-public and public-private integration of ITS and IT systems
From Modal to Multi-Modal Surface Transportation Policy
- Trends
- Evolving public sector awareness of the need for multi-modal policy, planning, and investment (ISTEA and TEA-21)
- Increasing state and local control of transportation investment
- Increasing use of highway trust funds for system preservation
- Growing demand to re-link transportation investment and economic development
- Implications for freight
- More complex planning and investment environment
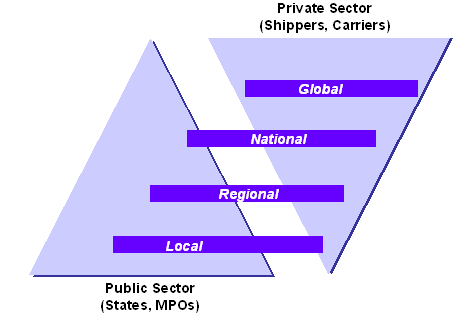
- Mismatch between scale of transport operations (increasingly regional and global) and public sector jurisdictions (local and state)
- Issues
- Role of multistate freight and trade corridor programs
- Identifying and financing freight projects of national significance
- Use of highway trust funds for non-highway freight projects
- Slow, inflexible public planning and project delivery compared to private sector
- Disjointed modal planning
- Difficult to engage private sector freight interests in state and MPO planning processes; limited freight representation
- Inadequate freight planning data and analysis tools
Freight Transportation Perspectives
State and MPO focus is regional and local; private sector focus is increasingly national and global
Why Identified Projects Go Unprogrammed
- Low priority in State/MPO plans
- Lack of local match or sponsorship
- Lack of private sector participation
- Neighborhood/Community opposition
- Environmental concerns
- Physical/Other Constraints
North American readiness...
The Challenge
- Over the past 20 years, highway travel demand has increased an average of over 3.0 percent per year
- During that same time, highway capacity has increased at a rate of 0.3 percent per year.
- Over the next 20 years, freight movements are expected to double, with more intense growth in major traffic lanes, hubs, and POE
- Customer expectations will increase; environmental issues will intensify
There Is A Role for the Public Sector
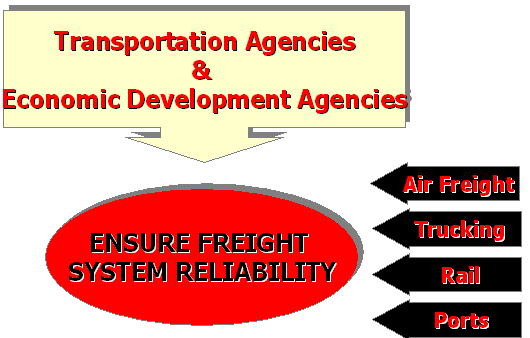
The Evolution of Freight Policy
 |
| Intermodalism
Innovative Finance
|
Funding Increase
State/local freight focus
|
Information Technology
Infrastructure Funding
(multimodal?) Institutional Development
|
Future Challenges
- Institutional Development - break the paradigms
- Encouraging multistate, regional, and binational intermodal freight coalitions
- Establishing statewide and metropolitan freight advisory groups
- Developing tools to evaluate freight improvement options
Future Challenges - 3 I's
- Information Technology - leverage technology to optimize system performance
- ITS - need full deployment; links throughout supply chain
- Border crossings and ports of entry - national security, trade processing, credentialing
- Data needs - develop real-time operations information system - technology as enabler
- Infrastructure - early planning & public/private partnerships
- Improve financing options -- eligibility issues...multijurisdictional infrastructure banks
- Develop financing guidelines
- Raise freight concerns during the planning process
Logistics Challenges...Policy Responses
- Comprehensive ops strategy...intermodal ITS
- support for private sector efficiency gains
- data and analytical development
- corridor and border support
- creation of RCOEs to support inst. dev.
- Initiate FDP...planning, prog, finance
- initiate pilot projects illustrating each element
- NAFTA component...variations of the above


 \
\


