| << Previous | Contents | Next >> |
Geotechnical Aspects of Pavements Reference Manual
Chapter 4.0 Geotechnical Exploration And Testing (continued)
4.5 Plan And Perform The Subsurface Exploration Program
Following the collection and evaluation of available information from the above sources, the geotechnical engineer (or engineer or geologist with geotechnical training) is ready to plan the field exploration program. The field exploration methods, sampling requirements, and types and frequency of field tests to be performed will be determined based on the existing subsurface information obtained from the available literature and site reconnaissance, project design requirements, the availability of equipment, and local practice. A geologist can often provide valuable input regarding the type, age, and depositional environment of the geologic formations present at the site for use in planning and interpreting the site conditions.
The subsurface investigation for any pavement project should be sufficiently detailed to define the depth, thickness, and area of all major soil and rock strata that will affect construction and long-term performance of the pavement structure. The extent of the exploration program depends on the nature of both the project and the site-specific subsurface conditions. To acquire reliable engineering data, each job site must be explored and analyzed according to its subsurface conditions. The engineer in charge of the subsurface exploration must furnish complete data so that an impartial and thorough study of practical pavement designs can be made.
4.5.1 Depth of Influence
Planning the subsurface exploration program requires a basic understanding of the depth to which subsurface conditions will influence the design, construction, and performance of the pavement system. For pavement design, the depth of influence is usually assumed to relate only to the magnitude and distribution of the traffic loads imposed on the pavement structure under consideration. Current AASHTO (1993) describes this depth at 1.5 m (5 ft) below the proposed subgrade elevation with this depth increased for special circumstances (e.g., deep deposits of very soft soils). In this section, support for the recommended depth is provided, and special circumstances where this depth should be extended are reviewed.
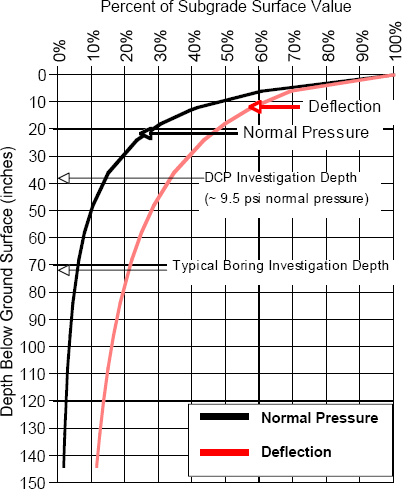
The zone of influence under the completed pavement varies with the pavement section, but typically 80 - 90 percent of the applied stress is dissipated within 1 m (3 ft) below the asphalt section as shown in Figure 4-3. However, consideration must also be given to the roadway section (i.e., height and width of the roadway embankment for fill application), the nature of the subsurface conditions, and consideration for construction (e.g., depth of soils that may require stabilization to allow for construction). A common rule of thumb in geotechnical engineering is that the depth of influence is on the order of two times the width of the load. This adage is also true for pavement sections during construction and for unpaved roads. Considering a dual wheel is about 1 m (3 ft) in width, subsurface investigations for shallow cut and fill with no special problems should generally extend to 1.5 - 2 m (5 - 7 ft) below the proposed subgrade level to account for construction conditions. Special problems requiring deeper exploration may include deep highly compressible deposits (e.g., peat or marsh areas) or deep deposits of frost-susceptible soils in cold regions. Greater depths may also be required for embankment design.
Figure 4-3. Typical zone of influence for an asphalt pavement section (Vandre et al., 1998).
From a pavement design perspective, the critical layers are in the upper meter of the subgrade. This understanding is especially critical for rehabilitation projects. Mechanistic design is based upon the critical horizontal tensile strain at the base of an asphalt layer or the critical vertical compressive strain at the surface of the subgrade (and within the other pavement layers) under repetitions of a specific wheel or axle load (Huang, 1993). Subgrade strain often controls the pavement design except for very thick asphalt layers or overlays. For rehabilitation projects and in consideration of sampling for roadway design, the depth of influence should be evaluated based on the type of pavement and the reconstruction layering. The subsurface investigations should focus on these depths (typically the upper 1 to 2 meters). However, as discussed in Chapter 3, groundwater and bedrock at depths of less than 3 m (10 ft) beneath the pavement can have an influence on pavement design. In addition, location of the groundwater level within 3 m (10 ft) of the pavement will influence decisions of frost susceptibility, as discussed later in Chapter 7, and the presence of bedrock within 6 - 9 m (20 - 30 ft) can influence deflections of pavement layers and FWD results. Therefore, in order to confirm that there are no adverse deeper deposits, to identify groundwater conditions, and to locate bedrock within the influence zone, a limited amount of exploration should always be performed to identify conditions in the subgrade to depths of 6 m (20 ft). However, as discussed in the next section, this does not necessarily mean borings to that depth.
4.5.2 Subsurface Exploration Techniques
Generally, there are four types of field subsurface investigation methods, best conducted in this order:
- Remote sensing
- Geophysical investigations
- In-situ investigation
- Borings and sampling
All of these methods are applicable for pavement design. For example, in new pavement construction projects, the location of old streambeds, usually containing soft, organic deposits that will require removal or stabilization, can usually be identified by remote sensing. Once identified, the vertical and horizontal extent of the streambed deposit can be explored by using geophysics to determine the horizontal extent, followed by in-situ tests to quantify the vertical extent and qualitatively evaluate soil properties, and borings with samples to quantify soil properties. The extent of use for a specific exploration method will be dependent upon the type of pavement project (i.e., new construction, reconstruction, or rehabilitation), as discussed in the following subsections.
4.5.3 Remote Sensing
Remote sensing data from satellite and aircraft imagery can effectively be used to identify terrain conditions, geologic formations, escarpments and surface reflection of faults, buried stream beds, site access conditions, and general soil and rock formations that may impact new pavement design and construction. Infrared imagery can also be used to identify locally wet areas.
While remote sensing methods are most valuable for new construction, this information may also be used to explain poor performance of existing pavements in rehabilitation and reconstruction projects.
Remote sensing data from satellites (e.g., LANDSAT images from NASA), aerial photographs from the USGS or state geologists, U.S. Corps of Engineers, commercial aerial mapping service organizations) can be easily obtained. State DOTs also use aerial photographs for right-of-way surveys and road and bridge alignments, and they can make them available for use by the engineer responsible for exploration. Especially valuable are old air photos compared to new ones in developed areas, which often identify buried features, such as old streambeds. Some ground control (e.g., borings) is generally required to verify the information derived from remote sensing data.
4.5.4 Geophysical Investigations
Geophysical survey methods can be used to selectively identify boring locations, supplement borehole data, and interpolate between borings. There are several kinds of geophysical tests that can be used for stratigraphic profiling and delineation of subsurface geometries. These include the measurement of mechanical waves (deflection response, seismic refraction surveys, crosshole, downhole, and spectral analysis of surface wave tests), as well as electromagnetic techniques (resistivity, EM, magnetometer, and radar). Mechanical waves are additionally useful for the determination of elastic properties of subsurface media, primarily the small-strain shear modulus. Electromagnetic methods can help locate anomalous regions, such as underground cavities, buried objects, and utility lines. The geophysical tests do not alter the soil conditions and, therefore, classify as non-destructive. Several are performed at the surface level (termed non-invasive). The advantages of performing geophysical methods include:
- nondestructive and/or non-invasive,
- fast and economical testing,
- provide theoretical basis for interpretation, and are
- applicable to soils and rocks.
The primary disadvantage is that no samples or direct physical penetration tests are taken. Models are also assumed for interpretation, which sometimes appears to be an art. The results are also affected by cemented layers or inclusions, and are influenced by water, clay, and depth.
The most common geophysical methods used for pavement evaluation is deflection response testing, with a majority of the agencies using the falling weight deflectometer (FWD) impulse type method (as previously mentioned in Sections 4.2.2 and 4.2.3 for rehabilitation and reconstruction projects). In rehabilitation and reconstruction projects, this method provides a direct evaluation of the stiffness of the existing pavement layers under simulated traffic loading. FWD, especially the newer lightweight deflectometers (LWD), can also be used during the construction of new pavements to confirm subgrade stiffness characteristics, either for verifying design assumptions or providing a quality control (QC) tool. LWD, along with other methods used for evaluating the stiffness of natural or compacted subgrades for construction control, are discussed in Chapter 8.
Other deflection methods include steady-state dynamic methods, which produce a sinusoidal vibration in the pavement, and quasi-static devices, which measure pavement deflections from a slow, rolling load (e.g., the Benkelman beam). The most promising development in deflection methods is the high-speed deflectometers, which measure deflections while continuously moving. While these methods increase the complexity of measurement, they offer significant advantages in terms of safety, through reduced traffic control requirements, productivity (typically 3 - 20 km/hr {2 - 12 mph}), and increased volume of information. A detailed review of each of these deflection methods in provided in NCHRP Synthesis 278 (Newcomb and Birgisson, 1999), and guidelines for deflection measurements are provided in ASTM, one on general dynamic deflection equipment (ASTM D 4695) and one on falling-weight-type impulse load devices (ASTM D 4602).
Electrical-type geophysical tests may also be used in pavement design and construction, including surface resistivity (SR), ground penetrating radar (GPR), electromagnetic conductivity (EM), and magnetic survey (MS). These electrical methods are based on the resistivity or, conversely, the conductivity of pore water in soil and rock materials. Mineral grains comprised of soils and rocks are essentially nonconductive, except in some exotic materials, such as metallic ores, so the resistivity of soils and rocks is governed primarily by the amount of pore water, its resistivity, and the arrangement of the pores. These techniques allow for mapping of the entire surface area of the site, making them useful in imaging the generalized subsurface conditions and detecting utilities, hidden objects, boulders, and other anomalies. The mapping is conducted on a relative scale of measurements that reflect changes across the property. For rehabilitation projects and reconstruction projects, GPR is often used for mapping the thickness of existing pavement layers. Electrical-type methods may also aid in finding underground cavities, caves, sinkholes, and erosion features in limestone and dolomite terrain. In developed areas, they may be used to detect underground utility lines, buried tanks and drums, and objects of environmental concern. Additional details on SR, EM, GPR, and MS can be found in Greenhouse, et al. (1998), FHWA manual on Application of Geophysical Methods to Highway Related Problems (Wightman et al., 2003), and in the geophysical information portion of the Geoforum website at http://www.geoforum.com/info/geophysical.
Mechanical wave geophysical methods are also used in pavement design and construction, including seismic refraction, seismic reflection, and, most recently, spectral analysis of surface waves (SASW). Both methods can be used to locate the depth to bedrock. Seismic refraction is also a key method for estimating rippability of rock. The use of the SASW mechanical wave method for determining subgrade modulus values for pavement design has recently been demonstrated in field trails. An automated device has been developed and is being tested by the Texas DOT. However, the testing and interpretation time is still somewhat long for use in pavement applications (Newcomb and Birgisson, 1999, and Wightman et al., 2003).
A general summary for each of the more common geophysical methods used in pavement design is outlined in Tables 4-2 through 4-7. Application examples are provided following the tables.
| Reference Procedures | ASTM D4694 (Deflections with a Falling Weight Type Impulse Load Device); LTPP Manual for Falling Weight Deflectometer Measurement: Operational Field Guidelines (August 2000). | |||||||||||||||||||||||||||||||||||||||||||||||||||||||||||||||||||||||||||||||||||||||||||||||
| Purpose | Used to determine the variation of pavement layer and subgrade stiffness along a length of pavement. For geotechnical features, can be used to backcalculate resilient modulus of subgrade and previously constructed base layers and to identify areas (e.g., weak subgrade conditions) requiring boring and sampling. | |||||||||||||||||||||||||||||||||||||||||||||||||||||||||||||||||||||||||||||||||||||||||||||||
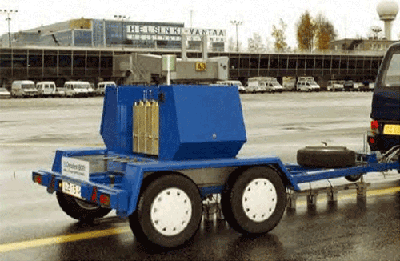
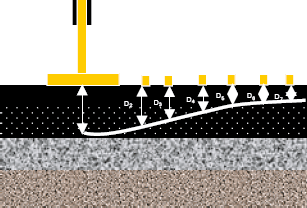
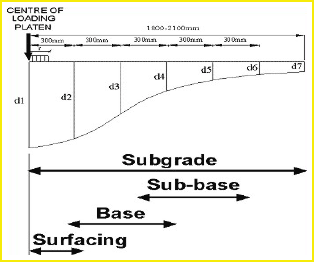
| Procedure | As described in ASTM D4694, the FWD method consist of applying an impulse load to the paved or unpaved road surface using a falling weight, typically between 4 - 107 kN (1,000 - 24,000 lbs), dropped on a plate resting on the pavement surface, as shown in Figure 4-4 below. The peak force at impact is measured by a load cell and can be recorded as the impact force or the mean stress (by dividing the load by the plate area). The vertical deflection of the pavement surface is measured at the center of the applied load and at various distances (up to eight locations are typical) away from the load, as shown in Figure 4-4. The method usually uses a vehicle or a trailer that is brought to a stop with the loading plate positioned over the desired test location. Several tests may be performed at the same location and at the same or different heights. By measuring the deflection response at the same location under different loads (drop heights), the linear or non-linear characteristics of the pavement system and individual layers can be evaluated. The vehicle is then moved to the next location. The plate and deflection sensors are lowered to the pavement surface. For routine surveys, the tests are typically performed on a spacing of 20 - 50 m (70 - 160 ft) along the road. The deflection at the center gives an idea of the overall pavement performance and the difference in deflection between deflections at various distances indicates the conditions of the pavement layers (bound, unbound, and subgrade). Profiles of the deflections can then be plotted over the length of the pavement (Figure 4.4c), in order to show the variation of pavement layer and subgrade stiffness.
The deflection bowls obtained from the FWD data can be analyzed to back calculate the effective stiffness (or load spreading ability) of the various pavement and subgrade layers, by matching measured deflections to computed values. Back calculation is most commonly performed using a multi-layer linear elastic model for the pavement layers. For example, the effective pavement modulus, which is a measure of the effective or combined stiffness of all layers above the subgrade, can be determined from the center deflection as follows (AASHTO, 1993):
where,
Outer deflection reading of the deflection basin primarily reflects the in-situ modulus of the lower soil (or subgrade). The subgrade resilient modulus can be calculated as follows:
r ≥ 0.7 ae
where,
Subgrade resilient modulus for design purposes is usually less than the value directly from FWD data. The AASTHO design guide (1993) recommends a design subgrade resilient modulus equal to 33% of that back calculated from FWD data for flexible pavement and 25% of the back-calculated value for PCC pavement. Figure 4-4. FWD showing: a) typical equipment; b) schematic of procedure; and, c) sketch of deflection bowl for interpretation of results. a) b) c) | |||||||||||||||||||||||||||||||||||||||||||||||||||||||||||||||||||||||||||||||||||||||||||||||
| Commentary | The FWD produces a dynamic impulse load that simulates a moving wheel load, rather than a static, semi-static, or vibratory load. FWD tests can be used for all construction types (i.e., new construction, rehabilitation, or reconstruction). For new construction, testing can be performed directly on cleared subgrade, or done during construction, after placement of the subbase, base, or pavement surface layer. The method can also be used to evaluate the effectiveness of subgrade improvements (for weak subgrades). Based on the results of FWD, the roadway section can be delineated into design sections with similar properties and the intrusive explorations methods (i.e., in-situ testing and borings) located accordingly to obtain the thickness of layers, confirm subgrade stiffness values, and obtain other characteristics of the subgrade (e.g., soil type and moisture conditions).
The deflection profile along the project may be examined to determine if changes exist in the pavement's structural response. The profile can be used to assist in locating areas where more intensive sampling and testing will be required, greatly improving the efficiency of laboratory evaluation. The profile may also be used to divide the project into design sections. For example, in rehabilitation projects, FWD results can be used to optimize the overlay design and/or subdrainage design in each of the design sections. It should be noted that the influence depth for elastic deflections measured with FWD may extend more than 9 m (30 ft) and, as a result, may miss near-surface critical features. Also, the results may be influenced by deep and often unknown conditions. FWD results are also affected by temperature and freezing conditions. Thus, it is important to consider the time of day and the season when scheduling the FWD program. As previously indicated, deflection measurements are corrected to a standard temperature, typically 20°C (68°F), and critical season equivalent deflections based on locally-developed procedures.
| |||||||||||||||||||||||||||||||||||||||||||||||||||||||||||||||||||||||||||||||||||||||||||||||
| Reference Procedures | ASTM G57 (Field Measurement of Soil Resistivity [Wenner Array]) | ||||
| Purpose | Resistivity is used to locate bedrock, stratigraphy, wet regions, compressible soils, map faults, karstic features, contamination plumes, buried objects, and other uses. | ||||
| Procedure | Resistivity is a fundamental electrical property of geomaterials and can be used to evaluate soil types and variations of pore fluid and changes in subsurface media (Santamarina et al., 2001). The resistivity (ρR) is measured in ohm-meters and is the reciprocal of electrical conductivity (kE = 1/ρR). Conductivity is reported in siemens per meter (S/m), where S = amps/volts. Electrical current is put into the ground using two electrodes, and the resulting voltage is measured using two other electrodes. Using pairs or arrays of electrodes embedded into the surface of the ground, a surface resistivity survey can be conducted to measure the difference in electrical potential of an applied current across a site. The spacing of the electrodes governs the depth of penetration by the resistivity method and the interpretation is affected by the type of array used (Wenner, dipole-dipole, Schlumberger). The entire site is gridded and subjected to parallel arrays of SR-surveys, if a complete imaging map is desired. Mapping allows for relative variations of soil types to be discerned, as well as unusual features. Recently developed automated resistivity systems collects much more data than simple SR and combines resistivity sounding and traverse data to form a resistivity section with detailed interpretation, as shown in Figure 4-5.
Figure 4-5. Two-dimensional cross-section resistivity profile for detection of sinkholes and caves in limestone (from Schnabel Engineering Associates).
| ||||
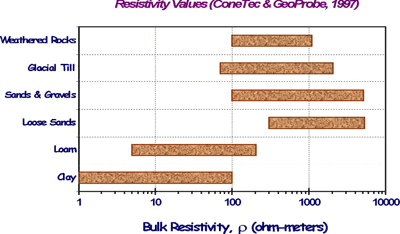
| Commentary | In general, resistivity values increase with soil grain size. Figure 4-6 presents some illustrative values of bulk resistivity for different soil and rock types. Figure 4-7 shows the field resistivity illustrative showing stratigraphic changes. Downhole resistivity surveys can also be performed using electronic probes that are lowered vertically down boreholes, or are direct-push placed. The latter can be accomplished using a resistivity module that trails a cone penetrometer, termed a resistivity piezocone (RCPTu). Downhole resistivity surveys are particularly advantageous in distinguishing the interface between upper freshwater and lower saltwater zones in coastal regions.
Figure 4-6. Representative values of resistivity for different soils (Mayne et al., 2002).
Figure 4-7. Resistivity data showing stratigraphic changes (Advanced Geosciences, Inc.).
For new pavement design, surface resistivity can be used to evaluate the areal extent of soil deposits and assist in identifying sample locations. Resistivity is also related to moisture content and can be used to map variations in moisture, and, thus, regions of compressible soils can be delineated. This moisture relation can also be valuable for rehabilitation and reconstruction projects, indicating areas requiring special considerations, such as improved drainage. SR may also be useful in determining the depth of rock, which as previously indicated may have an influence on FWD results and is a design input for ME design. SR can also be used in construction to assist in locating prospective sand, gravel, or other sources of borrow material.
|
| Reference Procedures | Wightman et al., (2003) Application of Geophysical Methods to Highway Related Problems, FHWA Contract Number DTFH68-02-P-00083. | ||||
| Purpose | GPR can be a valuable tool used to define subsoil strata, moisture variation, depth to rock, voids beneath pavement, buried pipes, cables, as well as to characterize archaeological sites before soil borings, probes, or excavation operations. It can also be utilized to determine the thickness of pavement layers, thus complementing FWD evaluation, and mapping reinforcing steel in concrete surface pavements. | ||||
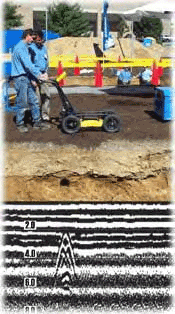
| Procedure | Short impulses of a high-frequency electromagnetic waves are transmitted into the ground using a pair of transmitting & receiving antennae. The reflected signals, which occur at dielectric discontinuities in the pavement system and subgrade, are recorded. Thus changes in the dielectric properties (permittivity) of the soil reflect relative changes in the subsurface environment. The GPR surveys are made by driving over the surface with air-coupled antennas mounted on the vehicle or pulling a tracking cart with ground-coupled antenna mounted on a sled across the ground surface. Air-coupled antennas are used to evaluate shallow depths (e.g., thickness of pavement layers) at highway speeds. Ground-coupled antennas are used to evaluate greater depths (up to 18 m (60 ft)). The EM frequency and electrical conductivity of the ground control the depth of penetration of the GPR survey. Many commercial systems come with several sets of paired antennas to allow variable depths of exploration, as well as accommodate different types of ground. | ||||
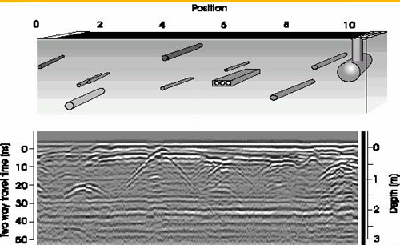
| Commentary | The GPR surveys provide a quick imaging of the subsurface conditions, leaving everything virtually unchanged and undisturbed. In pavement engineering practice, GPR using air-coupled antenna is most commonly used to identify layer thickness of pavement materials and perform condition evaluation of pavement surface materials. Methods for improving the accuracy of thickness measurements are reported by Al-Qadi et al., 2003. For subsurface evaluation, ground-coupled GPR is required. The GPR subsurface surveys are particularly successful in deposits of dry sands with depths of penetration up to 20 m or more (65 ft). In wet, saturated clays, GPR is limited to shallow depths of only 1 - 3 m (3 - 10 ft) (still adequate for pavement subgrade evaluation. Searches below the water table are difficult and, in some cases, not possible. Several illustrative examples of GPR surveys are shown in Figure 4-8. Additional information on current usage of GPR by state agencies is contained in NCHRP Synthesis 255 on Ground Penetrating Radar for Evaluating Subsurface Conditions for Transportation Facilities (Morey 1998).
Figure 4-8. Representative ground-coupled GPR results showing buried utilities and soil profile (from EKKO Sensors & Software: http://www.sensoft.ca/).
A recent development (GeoRadar) uses a variably-sweeping frequency to capture data at a variety of depths and soil types. Other developments include combining the use of air-coupled antenna with ski-mounted, ground-coupled antenna to allow for surface and subsurface evaluation at highway speeds.
|
| Reference Procedures | Wightman et al., (2003) Application of Geophysical Methods to Highway Related Problems, FHWA Contract Number DTFH68-02-P-00083. | ||||
| Purpose | The EM methods provide a very good tool for identifying areas of clay beneath existing pavements in rehabilitation and road widening projects, or in the subgrade for new construction. These methods are also excellent at tracking buried metal objects and are well known in the utility locator industry. They can also be used to detect buried tanks, map geologic units, and groundwater contaminants, generally best within the upper 1 or 2 m (3 or 6 ft), yet can extend to depths of 5 m (16 ft) or more. | ||||
| Procedure | Several types of electromagnetic (EM) methods can be used to image the ground and buried features, including: induction, frequency domain, low frequency, and time domain systems. Ground conductivity methods can rapidly locate conductive areas in the upper few meters of the ground surface. These measurements are recorded using several instruments that use electromagnetic methods. Electromagnetic instruments that measure ground conductivity use two coplanar coils, one for the transmitter and the other for the receiver. The transmitter coil produces an electromagnetic field, oscillating at several kHz, that produces secondary currents in conductive material in the ground. The amplitude of these secondary currents depends on the conductivity of the material. These secondary currents then produce secondary electromagnetic fields that are recorded by the receiver coil. Surveys are best handled by mapping the entire site to show relative variations and changes. Areas of high electrical conductivity are likely places to find clay.
The choice of which instrument to use generally depends on the depth of investigation desired. Instruments commonly used include the EM38, EM31, EM34 (Geonics Ltd, Canada), and GEM2 (Geophex, USA). The EM38 is designed to measure soil conductivities and has a maximum depth of investigation of about 1.5 m (5 ft). The EM31 has a depth of investigation to about 6 m (20 ft), and the EM34 has a maximum depth of investigation to about 60 m (200 ft). The depth of investigation of the GEM2 is advertised to be 30 - 50 m (100 - 165 ft) in resistive terrain (> 1000 ohm-m) and 20 - 30 m (65 - 100 ft) in conductive terrain (< 100 ohm-m). | ||||
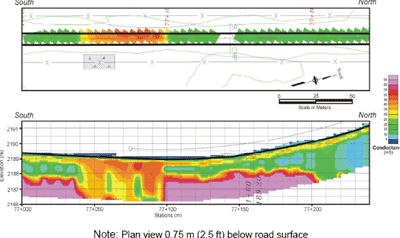
| Commentary | Clay is almost always electrically conductive, and areas of high conductivity have a reasonable chance that they will contain clay (e.g., see Figure 4-9). However, estimating the amount of clay from conductivity measurements alone is generally not possible. Conductivity is influenced by many factors including the degree of saturation, porosity, and salinity of the pore fluids. Conductivity measurements taken with instruments that investigate to depths greater than the upper layer are also influenced by other layers.
Figure 4-9. Conductivity results along a road in New Mexico (Blackhawk GeoServices, Inc).
|
| Reference Procedures | ASTM D5777. Wightman et al., (2003) Application of Geophysical Methods to Highway Related Problems, FHWA Contract Number DTFH68-02-P-00083. | ||||
| Purpose | Seismic refraction surveys are used to locate depth and characteristics (e.g., rippability) of bedrock, as well as evaluate dynamic elastic properties of the soil and rock. | ||||
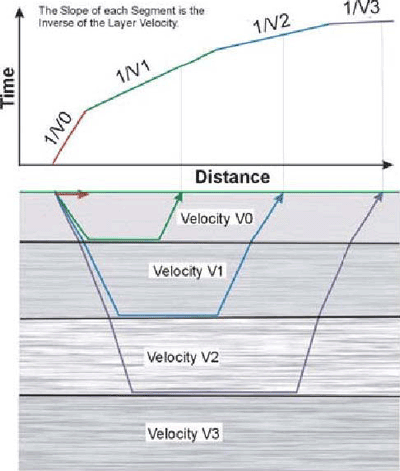
| Procedure | Seismic refraction involves placing a line of regularly spaced sensors (geophones) on the surface and measuring the relative arrival time of seismic energy transmitted from a specified source location. Seismic waves produced by the energy source penetrate the overburden and refract along the bedrock surface, continually radiating seismic waves back to the ground surface, as shown in Figure 4-10. Refraction data are recorded in the field using a portable seismograph, multiple (generally 12 per line) geophones (generally <15 Hz), a repeatable seismic source (e.g., sledgehammer striking a metal plate or light explosive charges), and a power source. Sledgehammer sources are generally used for depths less than 10 - 15 m (30 - 50 ft) and explosives for greater depths up to 30 m (100 ft). Mechanical waves generated by the seismic source include the compression (P-wave) and shear (S-wave) wave types that are measured. P waves are the first arrival waves, are the easiest to measure, and are not absorbed by saturated soil units (i.e., shear waves cannot transmit through water). Seismic energy travels with a compression velocity that is characteristic of the density, porosity, structure, and water content of each geologic layer. The seismic refraction survey is planned with respect to anticipated soil/rock velocities to be encountered, the approximate depth to rock, and the end-use of the data (e.g., rippability of the rock). Multiple seismic source points permit improved delineation of soil/rock interfaces.
Figure 4-10. Seismic refraction survey (Blackhawk GeoServices, Inc.).
| ||||
| Commentary | Seismic surveys are not intended to supplant subsurface sampling investigations, but aid in quickly and economically extending subsurface characterization over large areas, filling in the gaps between discrete borings.
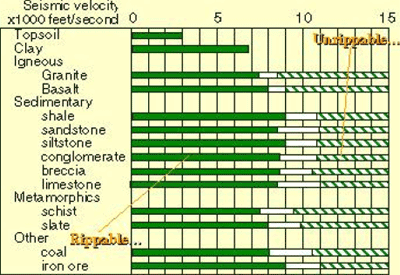
Although a number of parameters (e.g., uniaxial strength, degree of weathering, abrasivenesss, frequency of planes of weakness) relate to rippability of rock, seismic refraction has historically been the geophysical method utilized to predetermine the degree of rippability. Correlations of rock rippability as published by the Caterpillar Company are shown in Figure 4-11. Figure 4-11. Rippability (using a D9 Caterpillar tractor) versus seismic velocity (Caterpillar Handbook of Ripping, 8th Edition).
|
Figure 4-9 shows an example of using a geophysical method (i.e., EM) for locating clay seams on a project in New Mexico. This project demonstrates the ability to correlate the data with soil type and clay content. For this project survey, data were recorded with one of the EM instruments mounted on a trailer constructed primarily from non-conductive materials. The trailer was towed by an All Terrain Vehicle (ATV). A GPS receiver was also mounted on the trailer to provide position information. Data were recorded automatically at half-second intervals with the EM31 and EM38. Recordings with the EM31 were made at two different instrument heights above the ground, giving two different penetration depths. This procedure required several passes along the road. Having obtained conductivity measurements at a number of different depths at each recording location, the data were modeled and provided the interpreted vertical distribution of conductivity with depth. This interpretation is shown in the lower plot in Figure 4-9. The upper plot shows the ground conductivity measured with the EM38 at a depth of 0.75 m (2.5 ft) below the road surface. This data clearly shows the location of clay materials and provides a clear road map for planning additional exploration and sampling (Wightman et al., 2003).
Another example of a project that effectively incorporated geophysical testing into the investigation program has been reported by the Missouri DOT. Geophysical surveys were conducted for the Missouri Department of Transportation (MoDOT) by the Department of Geology and Geophysics at the University of Missouri-Rolla to determine the most probable cause or causes of ongoing subsidence along a distressed section of Interstate 44 in Springfield, Missouri. Ground penetrating radar (GPR) and reflection seismic survey quickly assessed roadway and subsurface conditions with non-destructive, continuous profiles. The GPR proved to be of useful utility in defining upward-propagating voids in embankment fill material. The reflection seismic survey established the presence of reactivated paleosinkholes in the area. These were responsible for swallowing the fill material as water drained through the embankment. On the basis of interpretation of these data, MoDOT personnel were able to drill into the voids that had developed beneath the pavement (as a result of washing out of the fine-grained material of the embankment fill), and to devise an effective grouting plan for stabilization of the roadway (Newton, et al., 1998).
Geophysical data was used to preclude additional subsurface exploration on a rehabilitation project by the Texas DOT. The project consisted of a 16.9 km (10.5 mile) section of road, which was exhibiting substantial alligator cracking and potholes in the southbound lane, as observed in 1999. The project was constructed in 1979 with 152 mm (6 in.) of lime stabilized subgrade where clay subgrade was present, 254 mm (10 in.) of granular base, and a 54-mm (2-in.) ACP surface. ACP level up courses and two open graded friction courses were then placed in 1988 and 1992, respectively. Maintenance forces had subsequently placed several seal coat patches, AC patches, and ACP overlays. FWD and GPR data were taken in the outside wheelpath at 160 m (0.1 mile) and 3 m (10 ft), respectively. Cores were taken at select locations based on the GPR data analysis. The data indicated that the open graded friction courses were holding water where the maintenance forces had placed the ACP overlays. Cores indicated that the open graded friction course was disintegrating; however, the original ACP layer underneath the friction course was in good shape. FWD data analysis indicated that the base material was structurally in good shape and no base repair and, consequently, no additional subsurface exploration were needed. The overlay and friction course were removed and replaced with a 127 mm (5 in.) ACP overlay in 2001, and was reported to be performing well (Wimsatt, A.J. and Scullion, T., 2003).
4.5.5 In-Situ Testing
In-situ testing can also be used to supplement soil borings and compliment geophysical results. In-situ geotechnical tests include penetration-type and probing-type methods, in most cases without sampling, to directly obtain the response of the geomaterials under various loading situations and drainage conditions. In-situ methods can be particularly effective when they are used in conjunction with conventional sampling to reduce the cost and the time for field work. These tests provide a host of subsurface information, in addition to developing more refined correlations between conventional sampling, testing, and in-situ soil parameters.
With respect to pavement design, in-situ tests can be used to rapidly evaluate the variability of subgrade support conditions, locate regions that require sampling, identify the location of rock and groundwater with some methods, and, with correlation, provide estimates of design values. Design values should always be confirmed through sampling and testing. Table 4-7 provides a summary of in-situ subsurface exploration tests that have been used for design of pavements and evaluation of pavement construction considerations.
| Type of Test | Best Suited For | Not Applicable | Properties That Can be Determined for Pavement Design and Construction | Remarks |
|---|---|---|---|---|
| Standard Penetration Test (SPT)* AASHTO T 206 & ASTM D1586 | Sand & Silt | Gravel, questionable results in saturated Silt | Crude estimate of modulus in sand. Disturbed samples for identification and classification. Evaluation of density for classification. | Test best suited for sands. Estimated clay shear strengths are crude & should not be used for design. See Table 4-8 and FHWA NHI-01-031. |
| Dynamic Cone Test (DCP)* ASTM D6951 | Sand, Gravel, & Clay | Clay with varying gravel content | Qualitative correlation to CBR. Identify spatial variation in subgrade soil and stratification. | See Table 4-9 and FHWA TS-78-209. |
| Static Piezocone Test (CPT)* ASTM D3441 | Sand, Silt, Clay | Undrained shear strength and correlation to CBR in clays, density & strength of sand & gravel. Evaluation of subgrade soil type, vertical strata limits, and groundwater level. | Use piezocone for pore pressure data. Tests in clay are reliable only when used in conjunction with other calibration tests (e.g., vane tests). See Table 4-10 and FHWA NHI-01-031. | |
| Field CBR | Sand, Gravel, Silt, Clay | Granular Soils (Lab and field correlations erratic.) | Load-deflection test providing direct evaluation of CBR and can be correlated with subgrade modulus k-value. | Slow, and field moisture may not represent worst-case condition. |
| Plate Load Test AASHTO T222 & ASTM D1196 | Sand, Gravel, Silt, Clay | Subgrade modulus k-value. | Slow and labor intensive. | |
| Vane Shear Test (VST) AASHTO T-223 | Clay | Silt, Sand, Gravel | Undrained shear strength, Cu with correlation to CBR. | Test should be used with care, particularly in fissured, varved, & highly plastic clays. See FHWA NHI-01-031. |
| Permeability Test ASTM D51216& ASTM D6391 | Sand, Gravel | Clay | Evaluation of coefficient of permeability in base and subbase for rehabilitation projects. | Variable head tests in boreholes have limited accuracy. See FHWA NHI-01-031. |
| Pressuremeter Test (PMT) ASTM D4719 | Soft rock, Sand, Silt, Clay | Subgrade modulus k-value & undrained shear strength with correlation to CBR. | Requires highly skilled field personnel. See FHWA IP-89-008 and FHWA NHI-01-031. | |
| Dilatometer Test (DMT) | Sand, Clay | Soil stiffness can be related to subgrade modulus k and compressibility. | Limited database and requires highly skilled field personnel. See FHWA NHI-01-031. |
* These tests can be used in pavement design to qualitatively evaluate subgrade stratification and determine optimum undisturbed sample locations required to obtain design property values.
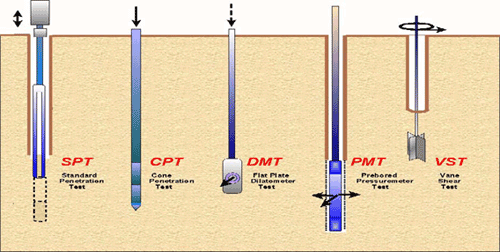
For new pavement design, the most utilized in-situ method is the standard penetration test (SPT); however, the dynamic cone penetrometer (DCP) and/or electronic cone penetrometer test (CPT) (see Figure 4-12) should be given special consideration for pavement design and evaluation (as many agencies are currently doing). DCP and CPT offer a more efficient and rapid method for subgrade characterization and have a significantly greater reliability than SPT, as explained in Table 4-8 on the SPT, Table 4-9 on the DCP, and Table 4-10 on the CPT.
Figure 4-12. Common in-situ tests for pavement evaluation (Mayne et al., 2002).
| Reference Procedures | AASHTO T 206 and ASTM D 1586. Standard Penetration Test and Split-Barrel Sampling of Soils. | ||||||||||||||||
| Purpose | A quick means to evaluate the variability of the subgrade with correlation to density of granular soils and to obtain disturbed samples. | ||||||||||||||||
| Procedure | The SPT involves the driving of a hollow, thick-walled tube into the ground and measuring the number of blows to advance the split-barrel sampler a vertical distance of 300 mm (1 ft). A drop weight system is used for the pounding where a 63.5-kg (140-lb) hammer repeatedly falls from 0.76 m (30 in.) to achieve three successive increments of 150-mm (6-in.) each. The first increment is recorded as a "seating," while the number of blows to advance the second and third increments are summed to give the N-value ("blow count") or SPT-resistance (reported in blows/0.3 m or blows per foot). If the sampler cannot be driven 450 mm, the number of blows per each 150-mm increment and per each partial increment is recorded on the boring log. For partial increments, the depth of penetration is recorded in addition to the number of blows. In current U.S. practice, three types of drop hammers (donut, safety, and automatic) and four types of drill rods (N, NW, A, and AW) are used in the conduct of the SPT. The test, in fact, is highly dependent upon the equipment used and the operator performing the test. Most important factor is the energy efficiency of the system. The range of energy efficiency for the current US standard of practice varies from 35 - 85% with cathead equipment, and 80 - 100% with automated trip Hammer equipment. A calibration of energy efficiency for a specific drill rig & operator is recommended by ASTM D-4633 using instrumented strain gages and accelerometer measurements in order to better standardize the energy levels. If the efficiency is measured (Ef), then the energy-corrected N-value (adjusted to 60% efficiency) is designated N60 and given by:
(5-1)
N60 = ( Ef / 60 ) Nmeas The measured N-values should be corrected to N60 for all soils, if possible. | ||||||||||||||||
| Commentary | The test can be performed in a wide variety of soil types, as well as weak rocks, yet is not particularly useful in the characterization of gravel deposits nor soft clays. The fact that the test provides both a sample and a number is useful, yet problematic, as one cannot do two things well at the same time. SPT correlations exist with angle of internal friction, undrained shear strength, and modulus. However, the SPT value and these correlations have large scatter, and should not be used alone for design.
For pavement design and construction, SPT provides a measure of subgrade variability. In granular soils, the method provides an evaluation of relative density, which can be correlated to CBR. In addition, disturbed samples are obtained for identification of subgrade materials and for classification tests. SPT results can be sued to identify locations where undisturbed samples should be taken. SPT data can also be compared with FWD results to confirm reasonableness (i.e., low resilient modulus values should compare to low SPT values). The following relationships have been suggested by Kulhowey and Mayne (1990) as a first order estimate of Young's modulus (E/Pa):
Where, Pa = atmospheric pressure Correlations have been attempted for estimating undrained shear strength and correspondingly CBR values in cohesive soils from N values. These relationships are extremely widespread in terms of interpretations, soil types, and testing conditions, such that a universal relationship cannot be advanced. In cohesive subgrades, SPT is better used to evaluate the variability of the subgrade (e.g., based on identification and classification of soil types encountered) and identify locations where proper samples (e.g., undisturbed tube samples for resilient modulus tests or bulk samples for CBR tests) should be taken. Alternatively, drill crews could be instructed to switch to tube samples when cohesive soils are encountered.
Note:
|
| Reference Procedures | ASTM D 6951. Standard Test Method for Use of the Dynamic Core Penetrometer in Shallow Pavement Applications. The method is also described in FHWA TS-78-209. | ||||||||||||||||
| Purpose | Another type of test that can be performed in the field to measure the strength of soils in-place, and is being used more commonly for pavement design purposes to estimate the in-place strength of both fine- and coarse-grained soils. | ||||||||||||||||
| Procedure | The principle behind the DCP is that a direct correlation exists between the strength of a soil and its resistance to penetration by solid objects, such as cones (Newcombe and Birgisson, 1999). The DCP consists of a cone attached to a rod that is driven into soil by means of a drop hammer that slides along the penetrometer shaft. The mass of the hammer can be adjusted to 4.6 and 8 kg (10 and 18 lbs) with the lighter weight applicable for weaker soils. According to NCHRP Synthesis 278 (Newcomb and Birgisson, 1999), more recent versions of the DCP have a cone angle of 60 degrees, with a diameter of 20 mm (0.8 in.). | ||||||||||||||||
| Commentary | A number of empirical correlations exist to relate the DCP penetration index (DPI) to subgrade strength parameters required for pavement design. The most widely used is (Webster et al., 1994):
The above methods were based on a database of field CBR versus DCP penetration rate values collected for many sites and different soil types, and correlated to test results by others (e.g., log CBR = 2.61 - 1.26 log DCP as developed by Kleyn, 1975, and currently used by the Illinois DOT). For DCPs with automatic release hammers (e.g., the Israeli automated DCP), CBR values are about 15% greater than the above correlations for manual hammers (after Newcomb and Birgisson, 1999).
Note: *COV, coefficient of variation as reported by Kulhawy and Mayne, 1990. |
| Reference Procedures | ASTM D-3441 (mechanical systems) and ASTM D 5778 (electric and electronic systems). Test Method for Electronic Cone Penetration Testing of Soils. | ||||
| Purpose | Fast, economical, and provides continuous profiling of geostratigraphy and soil properties evaluation. | ||||
| Procedure | The test consists of pushing a cylindrical steel probe into the ground at a constant rate of 20 mm/s (0.8 in/s) and measuring the resistance to penetration. The standard penetrometer has a conical tip with 60° angle apex, 35.7-mm (1.4 in.) diameter body (10-cm2 (1.6-in2) projected area), and 150-cm2 (23-in2) friction sleeve. The measured point or tip resistance is designated qc and the measured side or sleeve resistance is fs. The ASTM standard also permits a larger 43.7-mm (1.72-in.) diameter shell (15-cm2 (2.3-in2) tip and 200-cm2 (31-in2) sleeve). Piezocones are cone penetrometers with added transducers to measure penetration porewater pressures during the advancement of the probe. Most electric/electronic cones require a cable that is threaded through the rods to connect with the power supply and data acquisition system at the surface. An analog-digital converter and Pentium notebook are sufficient for collecting data at approximate 1-sec intervals. Depths are monitored using either a potentiometer (wire-spooled LVDT), depth wheel that the cable passes through, or ultrasonic sensor. Systems can be powered by voltage using either generator (AC) or battery (DC), or alternatively run on current. New developments include (1) the use of audio signals to transmit digital data up the rods without a cable and (2) memocone systems where a computer chip in the penetrometer stores the data throughout the sounding. | ||||
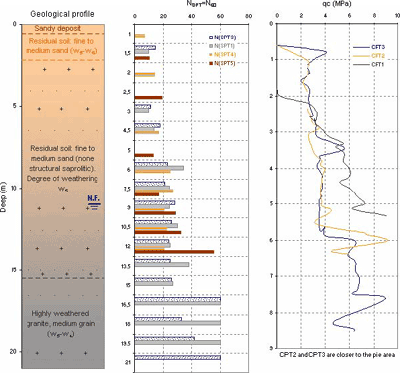
| Commentary | The CPT can be used in very soft clays to dense sands, yet is not particularly appropriate for gravel or rocky terrain. The pros and cons are listed below. As the test provides more accurate and reliable numbers for analysis, yet no soil sampling, it provides an excellent complement to the more conventional soil test boring with SPT measurements. Figure 4-13 provides a comparison of CPT and SPT logs.
Figure 4-13. CPT log in comparison to SPT data from several locations.
For pavement design, the CPT provides a continuous log of the vertical variability of the subgrade. CPT can be used to identify soil types and soil consistency, which in turn can be used to determine appropriate type(s) and location(s) for sampling. Empirical relations have been developed for undrained shear strength and elastic modulus, as reviewed in FHWA-NHI-01-031 (Mayne et al., 2002). The Louisiana Transportation Research Center in cooperation with FHWA has recently developed a correlation between cone parameters and resilient modulus (Muhammad et al., 2002).
Note:
|
The CPT and DCP provide information on subsurface soils, without sampling disturbance effects, with data collected continuously on a real-time basis. Stratigraphy and strength characteristics are obtained as the CPT or DCP progresses. Since all measurements are taken during the field operations and there are no laboratory samples to be tested, considerable time and cost savings may be appreciated. DCP is more qualitative than CPT, and is only useful for identifying variation in the upper meter of soil; however, it is performed with low cost, lightweight equipment, with a one- to two-person crew. DCP offers an excellent tool to perform initial exploration through core holes in the surface pavement in rehabilitation projects. Results of DCP tests through the pavement can be compared to test in the shoulders for road widening projects. DCP can also be an effective tool in the construction of pavement to evaluate the suitability of the subgrade after cut, fill, or stabilization operations, as discussed in Chapter 8, and the requirements for stabilization (as discussed in Chapter 7). The CPT provides more quantitative results, can be correlated directly to design properties and types of subgrade, and is useful to greater depths than the DCP in fine grained and sand type soils. Use of CPT and these correlations are detailed in the FHWA Subsurface Investigation Manual (FHWA NHI-01-031).
Other in-situ tests, such as pressuremeter (PM), dilatometer test (DMT) and vane shear test (VST), are also useful in obtaining in-situ design properties, as outline in Table 4-7 but require special skilled personnel and are time intensive. Thus, they are not often used for pavement design. There are also a number of static load tests (e.g., plate load and field CBR) that can be used to assess stiffness and/or strength of the subgrade surface. These tests are most valuable for reconstruction and rehabilitation projects Additional information on in-situ testing can be found on the website http://www.ce.gatech.edu/~geosys/misc/links.htm.
The relevance of each test also depends on the project type and its requirements. The general applicability of the test method depends in part on the geomaterial types encountered during the site investigation, as shown in Table 4-7.
| << Previous | Contents | Next >> |


