

| << Previous | Contents | Next >> |
Geotechnical Aspects of Pavements Reference Manual
Appendix B: Main Highway Project
B.1 Introduction
The Main Highway, the example project for the design exercises in this manual, involves the reconstruction and upgrading of an existing county road in the upper northeastern United States. This appendix summarizes the geotechnical and other data available for the design of this project.
A topographic map showing the project horizontal alignment is shown in Figure B-1. The length of the entire reconstruction project is 1.9 miles. The project subsurface investigation consisted of 10 test pits, 10 power auger borings, 5 hand auger borings, and 21 hand rod soundings. Seventeen soil samples were collected and tested in the laboratory.
For the purposes of the design examples in this manual, only a 1500-foot-long subsection of the entire project will be considered. This subsection between Sta. 255+00 and 270+00 is indicated in Figure B-1. Subsequent sections of this appendix summarize the relevant design data for this subsection.
B.2 Subsurface Conditions
A soils map for the site is shown in Figure B-2. Detailed plan and profile views of the subsection of interest are shown in Figure B-3 through Figure B-6. The locations of the various borings, test pits, and soundings are also indicated on these figures. Logs from borings within the subsection of interest are summarized in Figure B-7 through Figure B-14. Similar observations from the test pits are provided in Figure B-15 through Figure B-17.
B.2.1 General Conditions
The dominant soil type along this project is anticipated to consist of clay silt, with some remnants of the existing base material from the existing county road. The natural subgrade soils are all plastic and have been classified as an AASHTO A-4 or A-6 soil, with a frost rating of IV or III. Several undesirable soil conditions may be encountered along this project. These include soil support, drainage, and slumping.
Soil Support. The group index value is used as a general guide to the load bearing characteristics of a soil. It is a function of the liquid limit, plasticity index, and the amount of material passing the No. 200 sieve. Zero indicates good subgrade material, whereas a group index value of 20 or more indicates a poor subgrade material. Group index values obtained on the moist clay silts along this project ranged between 16.3 and 27.3, with an average of 21.6. CBR tests run on three samples (37791, 90021, 900221) produced soil support values of 2.6, 2.8, and 2.2, respectively. Based on this, it is anticipated that these soils will have a low bearing capacity resulting in poor soil support. It is anticipated that a standard 30 inch section will not provide adequate structural support. Due to the poor bearing capacity of the clay soils, it has been determined that an 18 inch lift of granular material will be required in addition to the structural aggregate base member. This 18 inch granular lift will provide a working platform for construction equipment to operate upon.
Drainage. Drainage of base and subgrade soils is extremely important along this project due to the presence of clay silt soils along the subgrade. The strength of the clay soils along this project will be dramatically affected by the presence of water. These soils have a high volume change between wet and dry states and will shrink and swell with changes in moisture content. Clay silt soils have a high dry strength but lose much of this strength upon absorbing water. Unfortunately, these soils are poorly drained and may absorb water by capillary action, resulting in low bearing capacity.
Slumping. The clay silt soils along this project have a tendency to slump with slopes greater than 2:1. At times, depending on seasonal conditions, these soils may even slump at slopes shallower than 2:1. It is anticipated that stone ditch protection and stone protection of some backslopes will be required. Vegetation of all exposed soil areas will be very important.
Additional relevant comments and observations from the geotechnical investigation report for this project are as follows:
- It is recommended that construction activities requiring heavy equipment operation on the native subgrade soils not be attempted during early to mid spring due to anticipated moist, soft soils.
- No substantial embankments or cuts are proposed along the project. However, some small embankments or cuts (less than about 5 ft) are proposed over/through the clay and silty clay native soils.
- Bedrock was not encountered along the project and thus no rock excavation or shallow rock conditions are anticipated.
B.2.2 Detailed Conditions along Study Section (Sta. 255+00 to 270+00)
This section consists of several cut and fill areas with a maximum cut of 4.0 feet and a maximum fill of 3.4 feet along the proposed centerline. Field explorations within this section consist of 2 power auger borings, 3 test pits, and 3 hand auger borings.
Earth excavation is anticipated to consist of existing base material (403) and clay silt (90021, 3777). The base material is classified as an AASHTO A-1-b soil, with a frost class of I. The clay silts are plastic and have been classified as A-6 soils, with a frost class of III. Depending on field conditions with respect to moisture, the clay silts along the surface may be moist to wet and softer than the underlying clay silts.
Subgrade soils are anticipated to consist of existing base material (403) and clay silt (90021, 3777). It is anticipated that most of the clay silts encountered at subgrade within the proposed cut sections may be a little firmer than the overlying clay silts. However, this is based upon the seasonal conditions at the time of the field explorations, and these conditions could change dramatically by the time of construction.
As previously discussed in other sections, drainage is extremely important with respect to the load bearing characteristics of the clay silt subgrade soils. The existing poor pavement conditions in this section can be attributed to the lack of adequate drainage and poor subgrade soils. It has been recommended that all proposed ditching be deepened to 2 feet below proposed subgrade wherever possible.
B.2.3 Laboratory Test Data
The sample log for all test specimens along the study subsection (Sta. 255+00 to 270+00) is given in Table B-1. The following laboratory test information is available:
- Gradation curves for several samples, including some from outside the study section (Figure B-18 and Figure B-19).
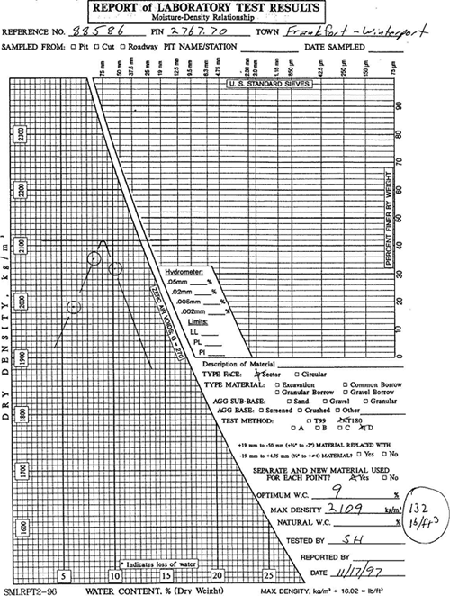
- Compaction curves and CBR value for the clayey silt subgrade (Figure B-20 and Figure B-21).
- Compaction curves for the granular working pad (Figure B-22).
- Laboratory resilient modulus values for the clayey silt subgrade (Table B-2) and the granular base material (Table B-3). Table B-4 summarizes the corresponding stress-dependent resilient modulus parameters k1, k2, and k3 for the NCHRP 1-37A level 1 MR relation:
MR = k1 pa θ k2 1 + τoct k3 pa pa in which
MR = subgrade resilient modulus (same units as pa) θ = bulk stress = σ1+σ2+σ3 (same units as pa) τoct = octahedral shear stress = 1/3 ( σ1 - σ2 )2 + ( σ2 - σ3 )2 + ( σ1 - σ3 )2 (same units as pa) pa = atmospheric pressure (to make equation dimensionless) k1,k2,k3 = material properties with constraints k1 > 0, k2 ≥ 0, k3 ≤ 0
B.2.4 Field Test Data
Several sets of FWD tests were performed at various times during the years prior to construction. These tests were used to backcalculate the subgrade resilient modulus and pavement effective modulus. These are summarized in Table B-5. The subgrade resilient modulus MR is calculated from the FWD results using the standard AASHTO equations:
| MR = | 0.24 P |
| dr r |
r ≥ 0.7 ae
| ae = |
|
in which:
| MR | = | back-calculated subgrade resilient modulus (psi) |
| P | = | applied load (pounds) |
| dr | = | deflection at a distance r from the center of the load (inches) |
| r | = | distance from the center of the load (inches) |
| ae | = | radius of the stress bulb at the subgrade-pavement interface (inches) |
| a | = | load plate radius (inches) |
| D | = | total pavement thickness above the subgrade (inches) |
The effective pavement modulus Ep is determined from:
| d0 = 1.5 pa | 1 | + | 1 - | 1 | ||||||||||||
| ||||||||||||||||
| MR |
| 2 | Ep | |||||||||||||
in which:
| d0 | = | deflection measured at the center of the load plate, adjusted to a standard temperature of 68°F (inches) |
| p | = | load plate pressure (psi) |
and the other terms as previously defined. Subgrade resilient modulus for design purposes is usually less than the value back-calculated from FWD data. The AASHTO design guide recommends a design subgrade modulus equal to 33% of the FWD value for flexible pavements and 25% of the FWD value for rigid pavements.
B.3 Environmental Conditions
The site is located in the northern United States in a cold and wet climate. Freezing Index and frost penetration estimates for the project site are summarized in Table B-6.
B.4 Traffic
Traffic estimates for use in design are summarized in Table B-7. The average traffic level is approximately 750 ESALs per day.
Figure B-1. Project alignment.
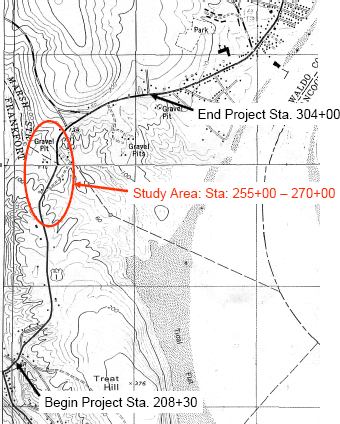
Figure B-2. Soils map for project site.
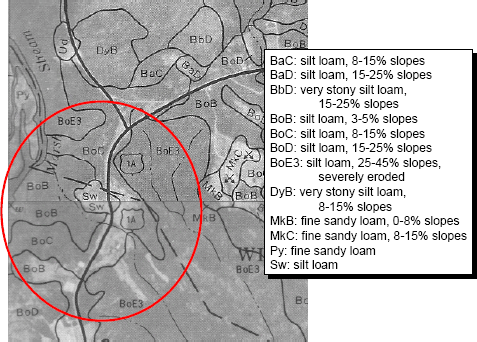
Figure B-3. Horizontal alignment with subsurface exploration locations: Sta. 255+00 to 263+50.
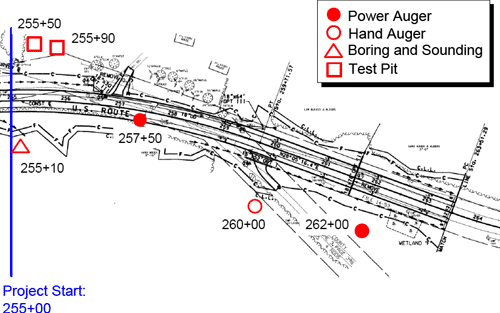
Figure B-4. Horizontal alignment with subsurface exploration locations: Sta. 263+50 to 270+00.
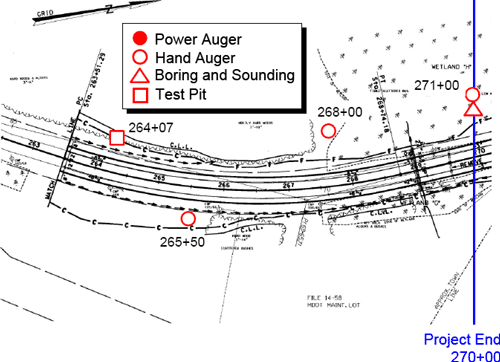
Figure B-5. Vertical alignment with subsurface exploration findings: Sta. 255+00 to 263+50.
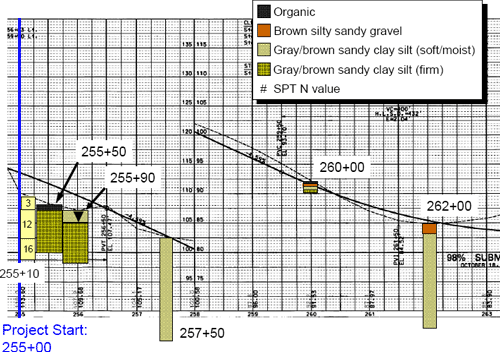
Figure B-6. Vertical alignment with subsurface exploration findings: Sta. 263+50 to 270+00.
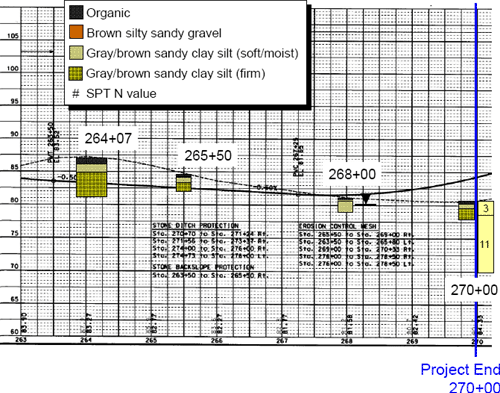
Figure B-7. Boring log, station 255+10.
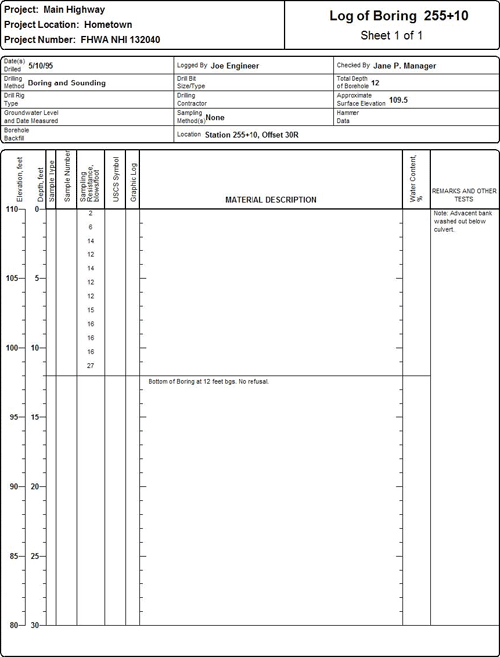
Figure B-8. Boring log, station 257+50.
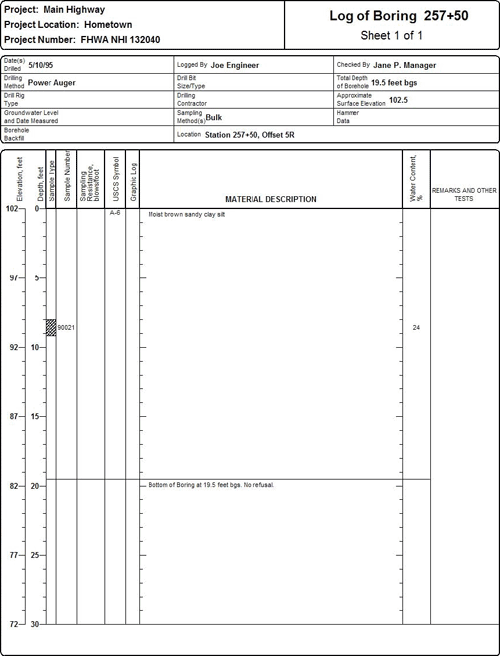
Figure B-9. Boring log, station 260+00.
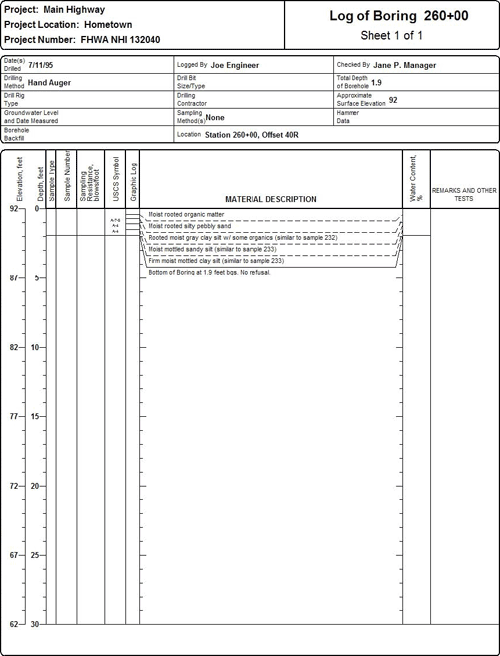
Figure B-10. Boring log, station 262+00.
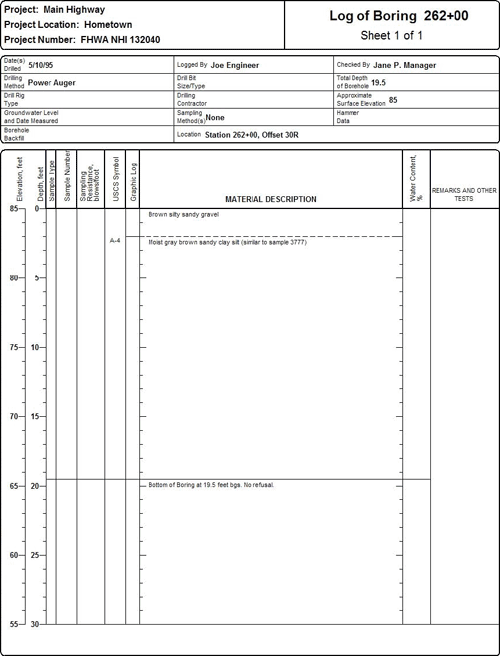
Figure B-11. Boring log, station 265+50.
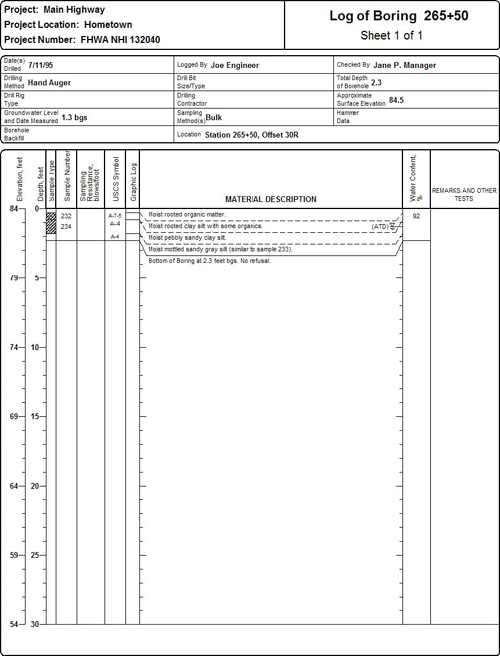
Figure B-12. Boring log, station 268+00.
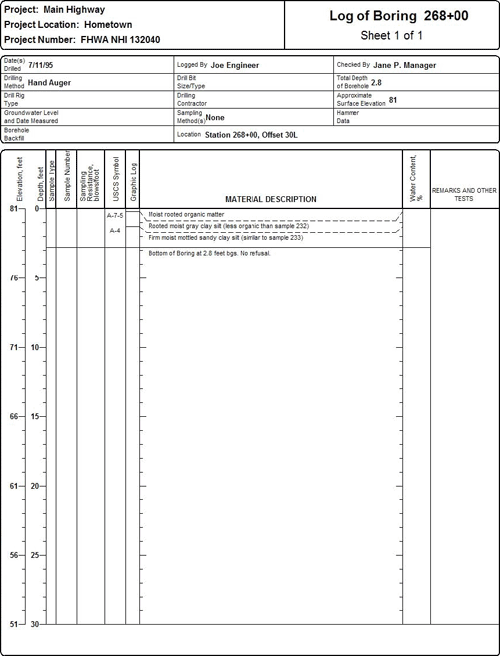
Figure B-13. Boring log, station 270+00.
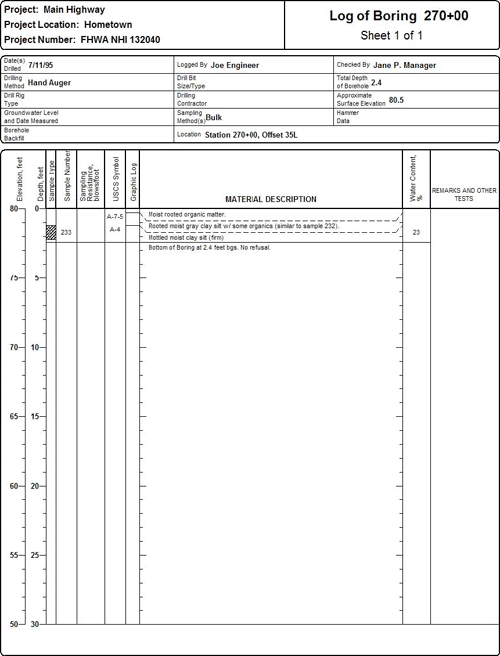
Figure B-14. Boring log, station 270+10.
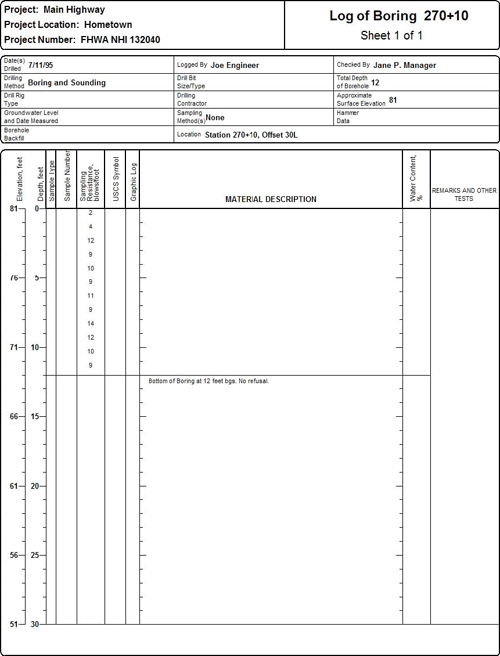
Figure B-15. Test pit log, station 255+50.
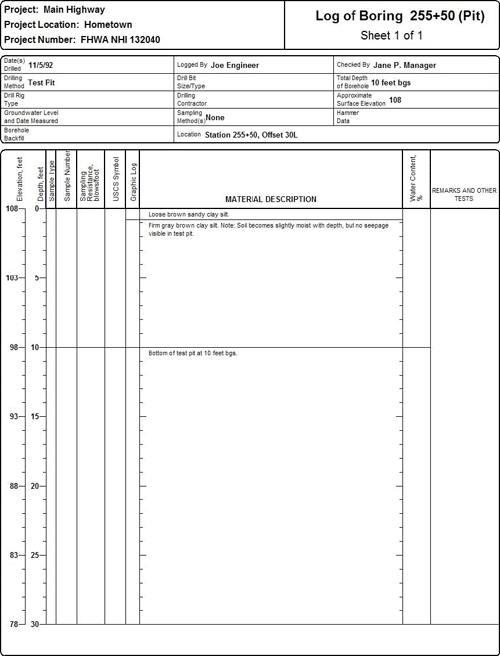
Figure B-16. Test pit log, station 255+90.
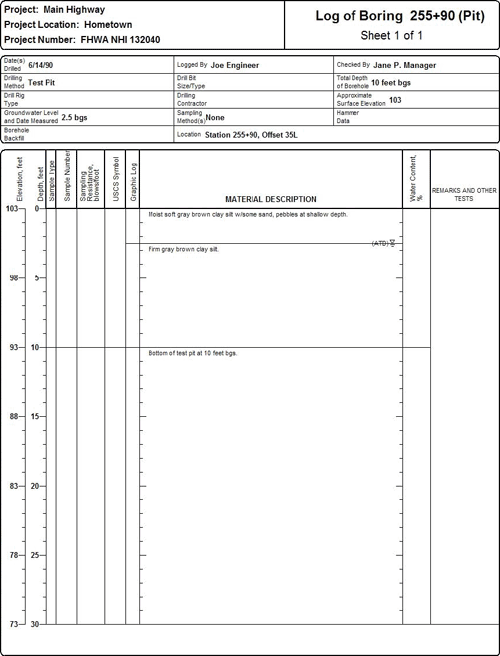
Figure B-17. Test pit log, station 264+07.
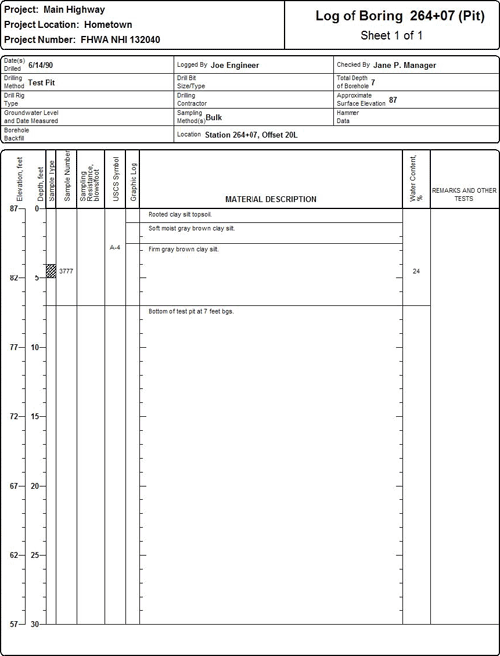
Figure B-18. Grain size distribution curves.
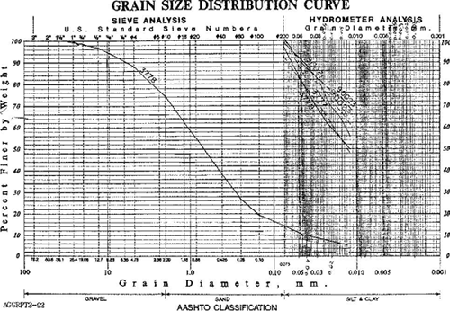
Figure B-19. Grain size distribution curves.
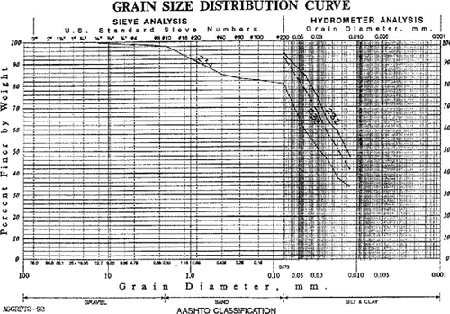
Figure B-20. Compaction curves for clayey silt subgrade soil (sample 90021).
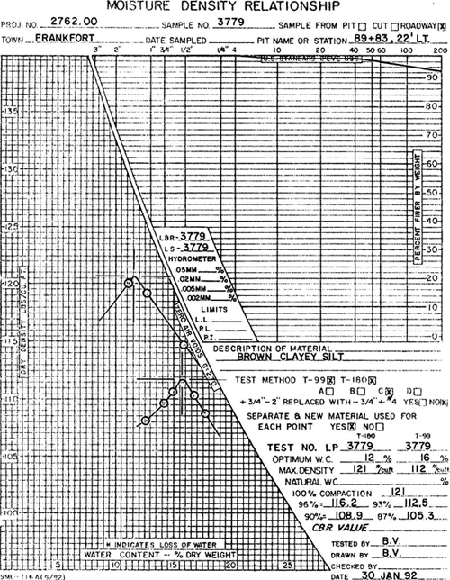
Figure B-21. Compaction curves for clayey silt subgrade soil (sample 90021).
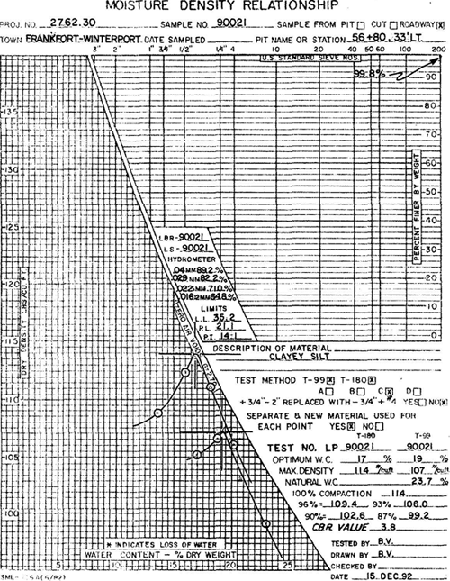
Figure B-22. Compaction curves for granular working platform.
| Station | Offset | Depth | Sample No. | W.C. | L.L. | P.I. | IGN. | pH. | Classification | |
|---|---|---|---|---|---|---|---|---|---|---|
| AASHTO | Frost | |||||||||
| 257+50 | 5R | 8.0 - 9.2 | 90021 | 24 | 35.2 | 14.1 | 6.5 | A-6 | III | |
| 264+07 | 20L | 4.0 - 5.0 | 3777 | 24 | 27.5 | 9.1 | 6.5 | A-4 | IV | |
| 265+50 | 30R | 0.3 - 0.8 | 234 | 24 | 26.1 | 5.6 | A-4 | IV | ||
| 265+50 | 30R | 0.8 - 1.8 | 232 | 92 | 65.1 | 29.4 | 16.6 | A-7-5 | III | |
| 270+00 | 35L | 1.2 - 2.2 | 233 | 23 | 22 | 6.4 | A-4 | IV | ||
Classification of these soil samples is in accordance with AASHTO Classification System M-145-40. This Classification is followed by the "Frost Susceptibility Rating" from zero (non-frost susceptible) to Class IV (highly frost susceptible). The "Frost Susceptible Rating" is based upon the Corps of Engineers Classification Systems.
| Replicate | Contact Stress (psi) | Confining Pressure (psi) | Cyclic Stress (psi) | θ (psi) | τoct (psi) | MR (psi) |
|---|---|---|---|---|---|---|
| 1 | 0.620 | 8.032 | 0.946 | 25.660 | 0.738 | 1450 |
| 0.743 | 6.099 | 0.839 | 19.880 | 0.746 | 1417 | |
| 0.307 | 4.107 | 0.806 | 13.433 | 0.525 | 1320 | |
| 0.151 | 2.043 | 0.757 | 7.037 | 0.428 | 1152 | |
| 0.636 | 8.032 | 1.431 | 26.164 | 0.974 | 1094 | |
| 0.455 | 5.969 | 1.390 | 19.752 | 0.870 | 1046 | |
| 0.307 | 3.972 | 1.316 | 13.537 | 0.765 | 971 | |
| 0.184 | 2.019 | 1.209 | 7.450 | 0.656 | 888 | |
| 2 | 0.603 | 8.045 | 0.880 | 25.618 | 0.699 | 1703 |
| 0.447 | 6.186 | 0.880 | 19.886 | 0.626 | 1675 | |
| 0.299 | 4.139 | 0.831 | 13.547 | 0.532 | 1519 | |
| 0.167 | 2.207 | 0.773 | 7.560 | 0.443 | 1337 | |
| 0.620 | 8.001 | 1.464 | 26.087 | 0.982 | 1289 | |
| 0.447 | 6.082 | 1.431 | 20.124 | 0.885 | 1240 | |
| 0.307 | 4.059 | 1.324 | 13.808 | 0.769 | 1125 | |
| 0.167 | 2.010 | 1.225 | 7.423 | 0.656 | 1013 | |
| 3 | 0.603 | 8.088 | 0.806 | 25.674 | 0.664 | 1351 |
| 0.463 | 6.030 | 0.789 | 19.342 | 0.591 | 1341 | |
| 0.307 | 4.036 | 0.724 | 13.140 | 0.486 | 1177 | |
| 0.151 | 2.028 | 0.674 | 6.909 | 0.389 | 1046 | |
| 0.603 | 8.025 | 1.357 | 26.036 | 0.924 | 1025 | |
| 0.463 | 6.083 | 1.316 | 20.027 | 0.839 | 970 | |
| 0.332 | 4.097 | 1.250 | 13.873 | 0.746 | 898 | |
| 0.200 | 2.012 | 1.143 | 7.381 | 0.633 | 808 |
| Replicate | Contact Stress (psi) | Confining Pressure (psi) | Cyclic Stress (psi) | θ (psi) | τoct (psi) | MR (psi) |
|---|---|---|---|---|---|---|
| 1 | 0.60 | 3.07 | 0.72 | 10.55 | 0.62 | 17623 |
| 1.17 | 5.96 | 2.51 | 21.55 | 1.74 | 19768 | |
| 2.04 | 9.98 | 4.89 | 36.87 | 3.27 | 27007 | |
| 3.07 | 15.08 | 8.07 | 56.36 | 5.25 | 34378 | |
| 4.02 | 20.08 | 11.35 | 75.60 | 7.25 | 43204 | |
| 0.60 | 3.06 | 2.17 | 11.96 | 1.31 | 10960 | |
| 1.16 | 6.00 | 5.54 | 24.69 | 3.16 | 16819 | |
| 2.04 | 9.97 | 10.54 | 42.48 | 5.93 | 23760 | |
| 3.00 | 14.91 | 17.48 | 65.21 | 9.66 | 33003 | |
| 4.01 | 20.02 | 23.99 | 88.07 | 13.20 | 42197 | |
| 0.61 | 3.03 | 4.84 | 14.55 | 2.57 | 10496 | |
| 1.20 | 6.07 | 12.30 | 31.71 | 6.36 | 17847 | |
| 2.04 | 10.03 | 23.44 | 55.58 | 12.01 | 27008 | |
| 3.03 | 14.98 | 35.69 | 83.66 | 18.25 | 37326 | |
| 4.05 | 20.10 | 46.70 | 111.03 | 23.92 | 44990 | |
| 0.63 | 2.97 | 7.56 | 17.09 | 3.86 | 10734 | |
| 1.19 | 6.06 | 20.15 | 39.52 | 10.06 | 20036 | |
| 2.06 | 10.00 | 35.35 | 67.41 | 17.64 | 28956 | |
| 3.02 | 15.04 | 51.98 | 100.11 | 25.93 | 37193 | |
| 4.01 | 19.99 | 67.65 | 131.64 | 33.78 | 44559 | |
| 0.61 | 2.99 | 14.79 | 24.37 | 7.26 | 12506 | |
| 1.22 | 5.95 | 35.32 | 54.39 | 17.23 | 21959 | |
| 2.08 | 10.03 | 58.14 | 90.30 | 28.38 | 29538 | |
| 3.00 | 15.04 | 84.55 | 132.69 | 41.27 | 38762 | |
| 4.05 | 20.03 | 108.67 | 172.83 | 53.14 | 49332 | |
| 2 | 0.61 | 3.02 | 1.29 | 10.97 | 0.90 | 7386 |
| 1.23 | 6.03 | 2.63 | 21.96 | 1.82 | 11375 | |
| 2.03 | 10.04 | 4.91 | 37.06 | 3.27 | 20089 | |
| 3.00 | 15.02 | 7.74 | 55.82 | 5.07 | 28547 | |
| 4.03 | 20.06 | 10.84 | 75.04 | 7.01 | 38724 | |
| 0.50 | 3.06 | 2.59 | 12.26 | 1.46 | 6802 | |
| 1.21 | 6.06 | 5.89 | 25.28 | 3.35 | 12349 | |
| 2.08 | 10.01 | 10.13 | 42.23 | 5.75 | 20448 | |
| 3.06 | 15.04 | 16.02 | 64.20 | 9.00 | 30563 | |
| 4.08 | 19.93 | 21.30 | 85.17 | 11.96 | 39487 | |
| 0.59 | 3.03 | 4.90 | 14.57 | 2.59 | 7355 | |
| 1.21 | 5.85 | 11.73 | 30.48 | 6.10 | 13987 | |
| 2.00 | 10.00 | 21.36 | 53.37 | 11.01 | 23784 | |
| 3.04 | 15.05 | 32.28 | 80.49 | 16.65 | 34193 | |
| 4.02 | 20.06 | 42.26 | 106.47 | 21.82 | 41623 | |
| 0.60 | 3.02 | 7.81 | 17.46 | 3.97 | 8253 | |
| 1.20 | 6.06 | 18.79 | 38.16 | 9.42 | 16909 | |
| 2.01 | 10.02 | 32.66 | 64.72 | 16.34 | 26331 | |
| 3.03 | 14.93 | 47.85 | 95.66 | 23.98 | 35554 | |
| 4.06 | 20.01 | 62.46 | 126.55 | 31.36 | 43168 | |
| 0.61 | 2.97 | 14.35 | 23.88 | 7.05 | 11096 | |
| 1.21 | 6.05 | 32.38 | 51.73 | 15.84 | 20945 | |
| 2.02 | 9.93 | 53.30 | 85.12 | 26.08 | 30242 | |
| 3.02 | 15.02 | 76.57 | 124.65 | 37.52 | 39709 | |
| 4.09 | 19.97 | 101.06 | 165.06 | 49.57 | 51042 |
| Soil | k1 | k2 | k3 |
|---|---|---|---|
| Clay silt subgrade | 170 | 0.450 | -16.388 |
| Granular base | 662 | 1.010 | -0.585 |
| Section | MR (psi) | Ep (psi) |
|---|---|---|
| 255+00 - 261+50 | 3000 | 25714 |
| 261+50 - 268+00 | 3857 | 27142 |
| 268+00 - 269+00 | 2571 | 27142 |
| Freezing Index | Total Frost Penetration | Frost Penetration into Subgrade | ||
|---|---|---|---|---|
| Nongranular Subgrade | Granular Subgrade | Nongranular Subgrade | Granular Subgrade | |
| Mean 1200 | 46 in. | 65 in. | 14 in. | 33 in. |
| Design 1700 | 53 in. | 85 in. | 21 in. | 15 in. |
| Vehicle Class | Est. AADT (2 way) | Est. AADT Percentage | ESAL Factor | Design ESALs |
|---|---|---|---|---|
| 4 | 90 | 1.51% | 0.4700 | 21.15 |
| 5 | 297 | 4.99% | 0.3000 | 44.55 |
| 6 | 361 | 6.04% | 1.3300 | 240.7 |
| 7 | 111 | 1.86% | 3.3600 | 186.48 |
| 8 | 118 | 1.96% | 0.8600 | 50.74 |
| 9 | 127 | 2.13% | 1.0900 | 69.22 |
| 10 | 79 | 1.32% | 2.8800 | 113.76 |
| 11 | 0 | 0.00% | 1.0000 | 0.00 |
| 12 | 0 | 0.00% | 1.0000 | 0.00 |
| 13 | 0 | 0.00% | 3.7500 | 0.00 |
| Light Vehicles | 4727 | 80.19% | 0.0008 | 1.89 |
| All Vehicles | 5910 | 100.00% | 727.85 |
Notes
- From locations outside of study section. Return to Text
| << Previous | Contents | Next >> |