U.S. Department of Transportation
Federal Highway Administration
1200 New Jersey Avenue, SE
Washington, DC 20590
202-366-4000
Freight Economy
Date: February 9, 2016
Our Host: Metro Atlanta Chamber of Commerce
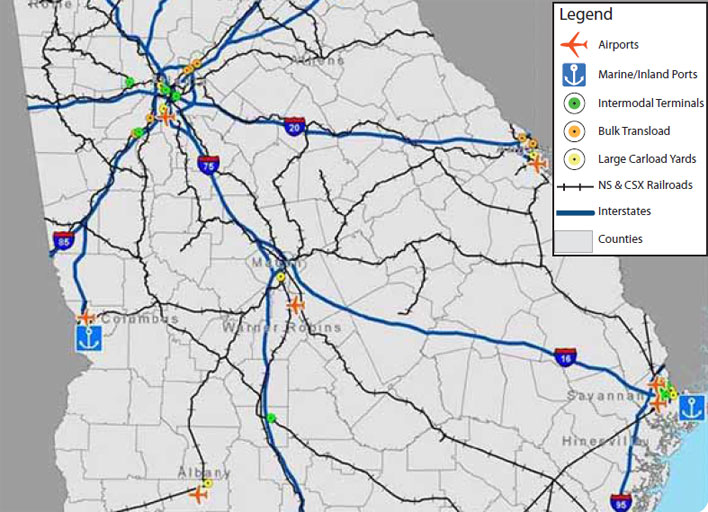
| HIGHWAYS | I-75 S of I-285, I-675 S of I-285, SR 155 @ I-75, Fulton Industrial Blvd S of I-20, Peachtree Industrial and I-85 N of I-285 | |
| RAILROADS | CSX Hulsey and Fairburn, NS Austell and Inman | |
| AIRPORTS | Hartsfield Air Cargo Operations | |
| SEAPORTS | Savannah and New Brunswick |
Source: GDOT
| Commodity | Value (millions $) | % of total |
|---|---|---|
| Machinery | 235,117 | 18% |
| Electronics | 145,244 | 11% |
| Pharmaceuticals | 120,152 | 9% |
| Precision instruments | 119,175 | 9% |
| Motorized vehicles | 110,233 | 8% |
| All commodities | 1,339,220 | 100% |
| Commodity | Tons (thousands) | % of total |
|---|---|---|
| Gravel | 76,052 | 13% |
| Nonmetal min. prods. | 49,398 | 9% |
| Waste/scrap | 44,893 | 8% |
| Mixed freight | 33,556 | 6% |
| Gasoline | 26,861 | 5% |
| All commodities | 571,048 | 100% |
| Trade partner | Tonnage | % of total |
|---|---|---|
| Georgia | 24,240 | 19% |
| Alabama | 11,114 | 9% |
| Florida | 9,693 | 8% |
| North Carolina | 8,922 | 7% |
| Tennessee | 7,661 | 6% |
| Total outbound | 124,465 | 100% |
| Trade partner | Tonnage | % of total |
|---|---|---|
| Georgia | 24,071 | 12% |
| Alabama | 18,512 | 9% |
| Tennessee | 17,567 | 9% |
| Michigan | 14,535 | 7% |
| Texas | 11,254 | 5% |
| Total inbound | 205,153 | 100% |
*2012 from FAF4, 2040 from FAF3
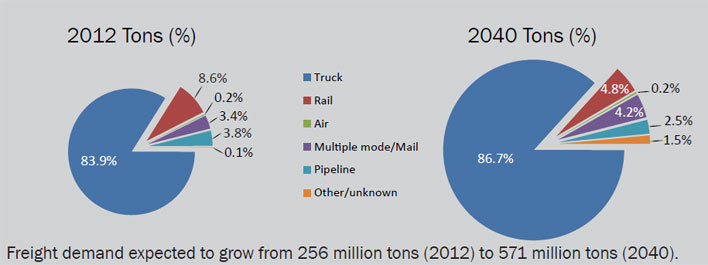
The Atlanta Region may experience three times more freight truck traffic on the interstate system in 2040 than today.
The majority of Atlanta's freight activity is domestic (81% by value and 93% by tonnage). International freight will grow in importance by 2020.
The majority of Atlanta's truck traffic serves local/regional markets (approximately 60%), highlighting Atlanta’s role as a distribution center and southeastern regional market hub.
The Atlanta region represents the 7th highest volume of freight tonnage among U.S. metropolitan markets.
Atlanta has a higher share of freight activity moving by truck (84%) as compared to the nation (70%; tonnage based).
Rail currently accounts for 9% of Atlanta's freight tonnage but plays an important role in key sectors (feedstock, electric utilities, and international trade).
Atlanta's freight activity and regional freight role is closely connected to the Port of Savannah which is the primary deepwater port serving the region.
Atlanta's warehouses and distribution centers are clustered in Fulton and Gwinnett counties and along the I-85 corridor. These centers support a range of sectors but especially: consumer retail, food, and industrial.
Key freight bottlenecks in the Atlanta region are: the I-85 / I-285 Interchange and the I-75 / I-285 interchange. These are also included in the top twenty worst interchange bottlenecks in the U.S.
Freight is an economic driver for the Atlanta region, accounting for more than 100,000 direct jobs throughout the twenty-county region.
A 20% decrease in trucking employment is estimated to cause a $6 billion decrease in Atlanta’s Gross Regional Product (GRP).
Sources for Freight Facts: FAF and ARC
To view PDF files, you can use the Adobe® Reader®.

